
Practical Aspects for Effective Monitoring of SLAs in Cloud Computing
and Virtual Platforms
Ali Imran Jehangiri, Edwin Yaqub and Ramin Yahyapour
Gesellschaft f¨ur wissenschaftliche Datenverarbeitung mbH G¨ottingen (GWDG),
Am Faßberg 11, 37077 G¨ottingen, Germany
Keywords:
SLA, Cloud, Root Cause, Monitoring, QoS, Analytics, IaaS, PaaS, SaaS.
Abstract:
Cloud computing is transforming the software landscape. Software services are increasingly designed in mod-
ular and decoupled fashion that communicate over a network and are deployed on the Cloud. Cloud offers
three service models namely Infrastructure-as-a-Service (IaaS), Platform-as-a-Service (PaaS), and Software-
as-a-Service (SaaS). Although this allows better management of resources, the Quality of Service (QoS) in dy-
namically changing environments like Cloud must be legally stipulated as a Service Level Agreement (SLA).
This introduces several challenges in the area of SLA enforcement. A key problem is detecting the root cause
of performance problems which may lie in hosted service or deployment platforms (PaaS or IaaS), and ad-
justing resources accordingly. Monitoring and Analytic methods have emerged as promising and inevitable
solutions in this context, but require precise real time monitoring data. Towards this goal, we assess practical
aspects for effective monitoring of SLA-awareservices hosted in Cloud. Wepresent two real-world application
scenarios for deriving requirements and present the prototype of our Monitoring and Analytics framework. We
claim that this work provides necessary foundations for researching SLA-aware root cause analysis algorithms
under realistic setup.
1 INTRODUCTION
Today more and more (monolithic) applications are
decomposed into smaller components which are then
executed as services on virtualized platforms con-
nected via network communication and orchestrated
to deliver the desired functionality. While the foun-
dations for decomposing, executing and orchestrat-
ing were well settled over the past decade, allocating
the needed resources for and steering the execution of
components to deliver the required Quality of Service
(QoS) is an active area of research. A critical aspect
of steering complex service-based applications on vir-
tualized platforms is effective, non-intrusive, low-
footprint monitoring of key performance indicators
at different provisioning tiers typically Infrastructure-
as-a-Service, Platform-as-a-Service and Software-as-
a-Service. These key performance indicators are
assessed to verify that a Service Level Agreement
(SLA) between a customer and a provider is met. Ide-
ally, the assessment goes beyond simply detecting vi-
olations of the agreed terms, but tries to predict and
pre-empt potential violations. The provider enacts
counter-measures to preventor resolve the violation if
it does occur. Deriving effective counter-measures re-
quires precise monitoring information spanning mul-
tiple tiers of the virtualized platform and analysis of
monitoring data to identify the root cause(s) of per-
formance problems.
Monitoring systems have been used for decades
in different computing paradigms. Monitoring solu-
tions for previous computing paradigms pose signifi-
cant limitations for their widespread adoption in large
scale, virtual platforms. The major obstacles with
these monitoring techniques are, their high perfor-
mance overhead, reliability, isolation, limited scala-
bility, reliance on proprietary protocols and technolo-
gies.
Common performance diagnosis procedures de-
pend on system administrator’s domain knowledge
and associated performance best practices. This pro-
cedure is labor intensive, error prone, and not feasi-
ble for virtual platforms. The prior art on detecting
and diagnosing faults in computing systems can be re-
viewed in (Appleby et al., 2001) (Molenkamp, 2002)
(Agarwal et al., 2004) (Chen et al., 2002)(Barham
et al., 2003). These methods do not consider virtual-
ization technologies and are inappropriate for rapidly
447
Imran Jehangiri A., Yaqub E. and Yahyapour R..
Practical Aspects for Effective Monitoring of SLAs in Cloud Computing and Virtual Platforms.
DOI: 10.5220/0004507504470454
In Proceedings of the 3rd International Conference on Cloud Computing and Services Science (CLOSER-2013), pages 447-454
ISBN: 978-989-8565-52-5
Copyright
c
2013 SCITEPRESS (Science and Technology Publications, Lda.)

changing, large scale virtual platforms that by very
nature require effectiveautomated techniques for QoS
fault diagnosis.
Our research motivations are to study the effec-
tiveness and practicality of different techniques for
performance problem diagnosis and SLA based re-
source management of virtual platforms. This is very
well applicable to Cloud Computing where efficient
monitoring is essential to accomplish these tasks. The
remainder of this paper is organized as follows. Sec-
tion 2 presents scenarios of our interest against which
in Section 3, we derive requirements for monitoring
and analytics. Based on this, in Section 4, we present
our Monitoring and Analytics framework prototype
developed as part of the GWDG Cloud Infrastructure.
Section 5 describes related work and finally, we con-
clude the paper in Section 6 with a summary and fu-
ture plan.
2 PERFORMANCE
MANAGEMENT SCENARIOS
AT GWDG
The GWDG is a joint data processing institute of the
Georg-August-Universit¨atG¨ottingen and Max Planck
Society. GWDG offers a wide range of information
and communication services. GWDG also owns a
state of the art Cloud Infrastructure. The Cloud infras-
tructure consists of 42 physical servers with a total of
2496 CPU cores and 9.75 Terabytes of RAM. Four of
the servers are Fujitsu PY RX200S7 using Intel Xeon
E5-2670. Thirty eight of the servers are Dell Pow-
erEdge C6145 using AMD Interlagos Opteron. The
raw disk capacity of the servers is 18.55 Terabytes.
Additionally, it hosts 1 PetaByte of distributed data
storage. On top of this, GWDG is offering “GWDG
Compute Cloud” and “GWDG Platform Cloud” ser-
vices. Currently, a self-service portal provides single-
click provisioning of pre-configured services. In fu-
ture, agents will be introduced to automatically nego-
tiate SLAs embodying desired qualities of procured
services, as outlined in our recent research (Yaqub
et al., 2011) (Yaqub et al., 2012).
GWDG Cloud service customers are divided in
two categories. The first category are small institutes
and novice individuals. They require simple off the
shelf software services such as WordPress, Moodle,
MeidaWiki, etc. These services are served by Plat-
form Cloud which can automatically scale and moni-
tor them. The second category of customers are large
institutes and advanced customers. They have ad-
ditional performance, availability and scalability re-
quirements on top of multi-tier architectures and as
a result have much more complex large scale dis-
tributed services. This class of customers prefer to
only procure VMs with a pre-installed base operating
system (OS) from the Compute Cloud. These cus-
tomers already have IT staff that administer the sys-
tem, handle support and scalability concerns and do
not require support from Cloud provider to manage
their services running inside VMs.
As part of the motivation for requirement elicita-
tion, we studied two Learning Management Systems
(LMS), which are web based environments created
especially to support, organize and manage teaching
and learning activities of academic institutes.
2.1 Scenario 1: LMS on GWDG
Platform Cloud
Moodle is a free web based LMS. It is a web ap-
plication written in PHP. A simple Moodle installa-
tion comprises the Moodle code executing in a PHP-
capable web server, a database managed by MySQL
and a file store for uploaded and generated files. All
three parts can run on a single server or for scalabil-
ity, they can be separated on different web-servers,
a database server and file server. Moodle is a mod-
ular system, structured as an application core and
supported by numerous plugins that provide specific
functionality. Customers can install Moodle with a
single click on the web interface of GWDG Platform
Cloud. One of the most important advantages of host-
ing Moodle on GWDG Platform Cloud is the ability
to scale up or down quickly and easily.
GWDG Platform Cloud is based on open source,
community supported version of RedHat OpenShift
Origin PaaS middleware(OpenShift, 2013). It enables
application developers and teams to build, test, de-
ploy, and run applications in the Cloud. Users can
create applications via command line or IDE client
tools. Platform Cloud is a multi-language PaaS that
supports a variety of languages and middleware out
of the box including Java, Ruby, Python, PHP, Perl,
MySQL and PostgreSQL. Platform Cloud is deployed
on top of GWDG Compute Cloud and is in its early
test phase. Figure 1 depicts the resulting dependen-
cies after hosting Moodle on Platform Cloud.
2.2 Scenario 2: LMS on GWDG
Compute Cloud
Electronic Work Space (EWS) is another LMS that
is used by the University of Dortmund. Teachers
and students of the University use EWS to publish
information and materials for lectures, seminars and
CLOSER2013-3rdInternationalConferenceonCloudComputingandServicesScience
448
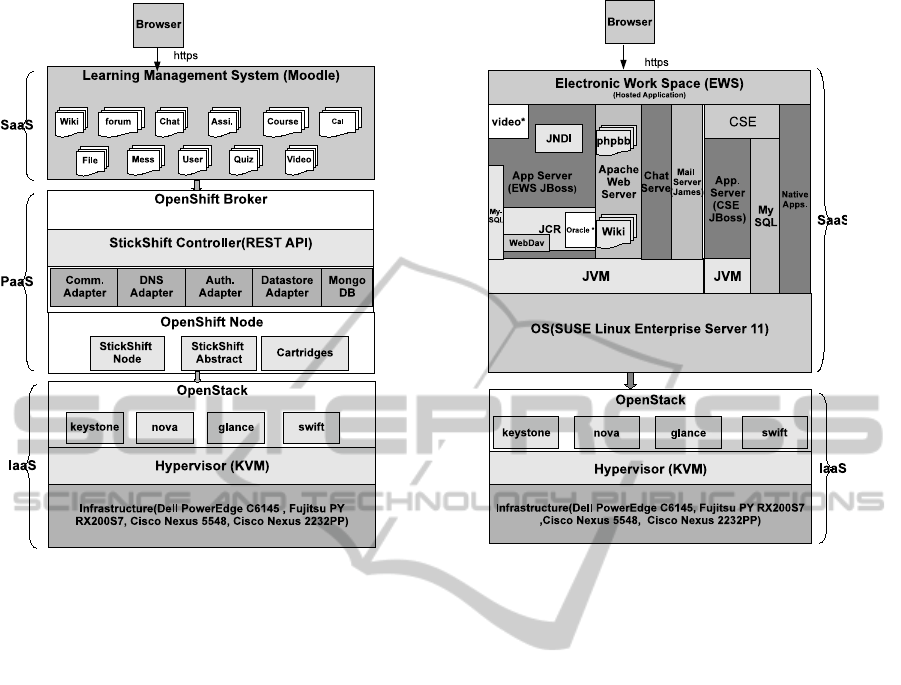
Figure 1: Scenario 1: Services dependencies.
classes. Currently, there are approximately 30,000
registered users of this service. EWS is a Java EE ap-
plication deployed in JBoss Application Server (AS).
Its structure is highly modular and at Dortmund Uni-
versity, it was tailored to interface with popular ph-
pBB forum and MediaWiki servers. Moreover, to fa-
cilitate collaborative editing and management of doc-
uments, a WebDAV server was also attached with it.
For video streaming, it was interfaced with a dedi-
cated video streaming server from the University of
Duisburg-Essen. Information about research projects,
lectures and scientists working at the University is
managed by another platform called “Lehre Studium
Forschung (LSF)”. Students have the possibility to
look at the course catalog and register for courses
at LSF. Data (participant, room, course description)
from LSF is automatically transferred to EWS by a
custom middleware (a Java EE application) that is de-
ployed on a separate JBoss AS. Oracle database is
used as the content repository.
EWS is a complex application and requires multi-
VM deployment to address scalability, load balanc-
ing, and availability requirements. In addition, secu-
rity and privacy are other main concerns when con-
sidering deployment over Cloud infrastructure. For
such complex applications, GWDG Compute Cloud
is more suitable where advance customers procure
VMs with base OS and some monolithic middle-
Figure 2: Scenario 2: Services dependencies.
ware. Applications running inside these VMs appear
as black-box to the Compute Cloud administrators.
The “GWDG Compute Cloud” is a service sim-
ilar to the well-known commercial IaaS like Ama-
zon EC2. It is especially tailored to the needs of
partner institutes. It provides a simplified web inter-
face for provisioning and managing the virtualized re-
sources (VMs, disk, public IPs). The self-service in-
terface allows customers to choose different VM fla-
vors (in terms of available processors, memory and
storage) and operatingsystems. Customers can access
their VMs directly from a web browser using the Vir-
tual Network Computing (VNC) protocol. Customers
can also attach the public IP address with VMs on
the fly. The GWDG Compute Cloud is based upon
open source products such as OpenStack, KVM, and
Linux. The service is in public test phase and is
available to members of the Max Planck Society and
the University of G¨ottingen. Figure 2 depicts the re-
sulting dependencies after hosting EWS on Compute
Cloud.
2.3 Discussion
The key concern for Cloud customers is the availabil-
ity and performance of SaaS. In scenario 1, we have
a hierarchical dependency between SaaS, PaaS and
IaaS tiers of Cloud. However, in scenario 2, our LMS
PracticalAspectsforEffectiveMonitoringofSLAsinCloudComputingandVirtualPlatforms
449

application (SaaS) is only dependent on IaaS tier of
the Cloud. These dependencies lead to strong corre-
lation between some performance metrics.
If customers of LMS are experiencing perfor-
mance or availability problems, then both Cloud
provider and customer needs to find the root cause
of the problem in their domain of responsibility. QoS
degradation may be due to the internal components
of SaaS or the problem could have propagated from
lower layers of the Cloud stack. For example, LMS
might guarantee to its users that the response time of
an HTTP request should be less than 1 second under
a fixed request invocation rate. If users experience
response time greater than 1 second, then possible
cause could lie in the customer domain, e.g., invo-
cation rate is increased or the network between web
server and database is congested, etc., but the prob-
lem could also lie in PaaS domain, e.g., due to a slow
DNS server, contention of resources caused by col-
located applications. The problem could even lie in
the IaaS domain for instance, due to a malfunctioning
virtual network or contention of resources due to col-
located VMs, etc. Therefore, service providers need
an Analytics module to pinpoint the component/tier
responsible for QoS degradation.
Analytics module process monitoring data from a
wide set of components/tiers involved in service de-
livery. It is vital to determine a clear ownership of re-
sponsibility when problems occur. In real world com-
plex scenarios as the ones mentioned above, this is
a very challenging task. Scenario 1 incorporates in-
frastructure, platform and software service tiers. Our
experience shows that all the components from these
tiers need to be monitored. Although in scenario 2,
we only have SaaS and IaaS tiers, but monitoring is
still difficult as the SaaS tier is highly complex and
appears only as a black-box to the IaaS tier. In the
given context, we identify three challenging problems
that we address in this work. These are:
1. Complexity: Usually the environment to monitor
is highly complex due to the complicated nature
of service delivery tiers and hosted applications.
2. Monitoring Isolation and Heterogeneity: Cloud
tiers are best monitored by separate monitoring
technologiesthat should work in isolated but com-
plementary fashion.
3. Scalability: Monitoring parameters grow expo-
nentially to the number of applications and ele-
ments belonging to the Cloud tiers. Hence, scal-
ability of monitoring approaches is of prime con-
cern as well as the method to deploy them auto-
matically.
3 REQUIREMENTS
In the following, requirements derived from the pre-
sented scenarios and general considerations from the
literature (Ejarque et al., 2011) (Jeune et al., 2012)
(Aceto et al., 2012) (Hasselmeyer and D’Heureuse,
2010) are generalised. These requirements have a
generic applicability where a Software-as-a-Service
(SaaS), e.g., Learning Management System (LMS)
is based upon Platform-as-a-Service (PaaS) or
Infrastructure-as-a-Service (IaaS) tier. We believe
that a thorough understanding of these requirements
provides solid foundations for an effective Monitor-
ing and Analytics solution for virtual platforms and
Cloud Computing.
3.1 Monitoring Framework (MF)
Requirements
M1. Scalability. The MF should be scalable i.e. it
can cope with a large number of monitoring data col-
lectors. This requirement is very important in Cloud
Computing scenarios due to a large number of param-
eters to be monitored for potentially large amount of
services and elements of Cloud tiers that may grow
elastically.
M2. Heterogeneous Data. The MF should consider
a heterogeneous group of metrics. The MF must al-
low the collection of service level runtime monitoring
data, virtual IT-infrastructure monitoring data (e.g.,
VM level runtime monitoring), and fine-grained phys-
ical IT-infrastructure monitoring data (e.g., network
links, computing and storage resources).
M3. Polling Interval. The data collection mech-
anism must allow the dynamic customization of the
polling interval. Dynamic nature of virtual platforms
demands gathering of data in a sufficiently frequent
manner, meaning that nodes should be monitored
continuously. Naturally, smaller polling intervals in-
troduce significant processing overhead inside nodes
themselves. However, long polling intervals do not
provide a clear picture of the monitored components.
Therefore, an optimal trade-off between polling inter-
val and processing overhead is required.
M4. Relationship. In the above mentioned scenario,
clusters of VMs and Physical Machines (PM) serve
many kinds of applications, so there is a hierarchi-
cal relationship between applications, VMs and PMs.
There is also a possibility of migration of VMs and
applications from one node to another, so relation-
ships can be changed dynamically. The metric’s value
must be tagged to showthat they belong to a particular
instance (e.g., application), and what is their relation
to other instances (e.g., VM and PM).
CLOSER2013-3rdInternationalConferenceonCloudComputingandServicesScience
450

M5. Data Repository. The MF requires a data
repository where raw monitoring data needs to be
stored after collection. The original data set must
be stored without down-sampling for auditing pur-
poses. The stored, raw monitoring data can be re-
trieved by consumers to perform QoS fault diagno-
sis, SLA validation, plot rendering, and as an input
for fine grained resource management. The database
must be distributed in order to avoid single point of
failure. Moreover, it must be scalable, and allow to
store thousands of metrics and potentially billions of
data points.
M6. Non-intrusive. The MF must be able to retrieve
data non-intrusivelyfrom a variety of sources (for VM
via libvirt API, for a host via cgroups, for the net-
work via SNMP, for Java applications via JMX, etc.).
Collection mechanism should easily be extensible by
adding more plugins.
M7. Interface. The MF should provide a REST inter-
face that allows access to the current monitoring data
in a uniform and easy way, by abstracting the com-
plexity of underlying monitoring systems. A standard
unified interface for common management and mon-
itoring tasks can make different virtualization tech-
nologies and Cloud providers interoperable. A REST
interface is a good choice due to ease of implemen-
tation, low overhead and good scalability due to its
session-less architecture.
3.2 Analytics Engine (AE) Requirement
Collecting monitoring data is essential but not suffi-
cient per se to explain the observed performance of
services. In the next phase, we need to analyze and
verify data in light of Service Level Agreement (SLA)
between a customer and a provider. Ideally, the anal-
ysis goes beyond simply detecting violation of agreed
terms and predicts potential violations.
General requirements for an Analytics Engine
(AE) are detailed below.
A1. Data Source. AE must be able to fetch moni-
toring data recorded in the database. Further, it must
be able to query the Cloud middlewares (e.g., that of
OpenStack and OpenShift) and application APIs to
know the current status of the services.
A2. Proactive. AE must support the proactive man-
agement of resources. Proactive management needs
short term and medium term predictions for the evo-
lution of most relevant metrics.
A3. Alerts. Certain QoS metrics need to be processed
in real time and alerts should be triggered when these
QoS metrics are violated or approach certain thresh-
old values.
A4. Event Correlation. Detecting the root cause of
QoS faults and taking effective counter measures re-
quires monitoring information spanning multiple tiers
of the virtualized platforms. Quick incomprehensive
analysis of monitoring data of individual tiers does
not reveal the root cause(s) of the problem precisely
enough. Therefore, Analytics need to exhaustively
aggregate runtime data from different sources and
consolidate information at a high level of abstraction.
A5: Identification of Influential Metrics. Identifica-
tion of the metrics which strongly influence the QoS
helps in decreasing the monitoring footprint and anal-
ysis complexity.
4 MONITORING AND
ANALYTICS FRAMEWORK
PROTOTYPE
Our initial monitoring prototype focused on require-
ments (M1-M6). We conducted a thorough analysis
of technologies to be used by our framework. In de-
ciding upon technology, our criteria included de-facto
industry standards that are capable of providing a high
degree of flexibility and scalability to our architec-
ture. Figure 3 gives a high level view of our Moni-
toring and Analytics framework. Our framework uses
OpenTSDB(OpenTSDB, 2013) for collecting, aggre-
gating and storing data. OpenTSDB uses the HBase
distributed database system in order to persistently
store incoming data for hosts and applications. HBase
is a highly scaleable database designed to run on a
cluster of computers. HBase scales horizontally as
one adds more machines to the cluster. OpenTSDB
makes data collection linearly scalable by placing the
burden of the collection on the hosts being monitored.
Each host uses tcollector client side collection library
for sending data to OpenTSDB. Tcollector does all
of the connection management work of sending data
to OpenTSDB and de-duplication of repeated values.
We instrumented all OpenStack (OpenStack, 2013)
compute nodes with tcollector framework. Compute
node specific resource utilization metrics are gathered
by collectors those are part of the base package. Our
OpenStack environmentutilizes KVM as the hypervi-
sor and libvirt for Virtualization management. Libvirt
API can provide us monitoring information of hosted
VMs. We wrote a custom collector that retrieves data
non-intrusively for VMs via libvirt API. The system
resources and security containers provided by Open
Shift are gears and nodes. The nodes run the user
applications in contained environments called gears.
A gear is a unit of CPU, memory, and disk-space
on which application components can run. To en-
PracticalAspectsforEffectiveMonitoringofSLAsinCloudComputingandVirtualPlatforms
451
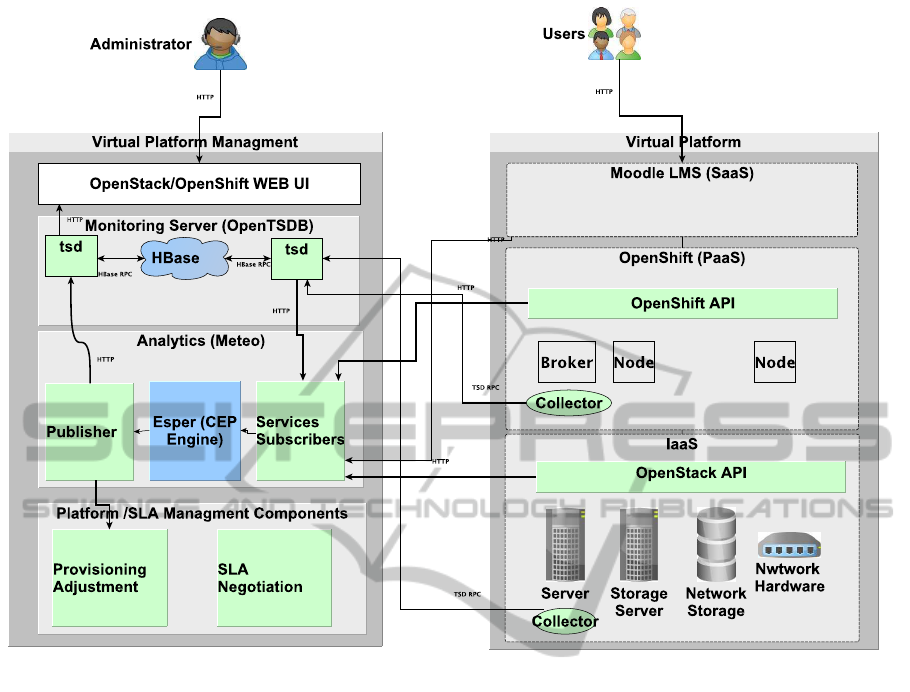
Figure 3: Monitoring and Analysis framework prototype.
able us to share resources, multiple gears run on a
single node. For performance analysis of hosted ap-
plications, we want to track and report utilization of
gears, where as node utilization is already monitored
by OpenStack collector. To track the utilization of
gears, we instrumented all nodes of PaaS with tcollec-
tor. Linux kernel cgroups are used on OpenShift node
hosts to contain application processes and to fairly al-
locate resources. We wrote a custom collector that
retrieves data non-intrusively for gears via cgroups
file system. Additionally, monitoring data can be col-
lected from REST APIs of Cloud Services by Service
Subscribers component.
The Analytics component is based on the ESPER
complex event processing (CEP) framework(ESPER,
2013). Analytics component leverages Esper to fore-
cast the evolution of metrics by using Holt-Winters
forecasting. Analytics component implements the
SLA surveillance function and the proper alarms are
triggered when SLAs get violated. Analytics frame-
work’s listener components retrieve service related
events from different APIs. The analytics publisher
component sends alerts to SLA Management compo-
nent for taking corrective measures.
Custom dashboard interfaces are developed for
GWDG Platform and Compute portals. These dash-
boards allow end users to view particular met-
rics of running VMs and applications recorded by
OpenTSDB. For plotting data, we used Flot - a plot-
ting library for jQuery JavaScript framework.
5 RELATED WORK
Discussion of related work is divided into areas of
Monitoring Systems for Large Scale Cloud Platforms
and Root Cause Analysis.
Ganglia (Massie, 2004) is a scalable distributed
monitoring system for high performance computing
systems. Nagios(Nagios, 2013) is an open source
solution to monitor hosts and services (for example
HTTP, FTP, etc.) It can monitor more or less ev-
erything for which a sensor exists and is extensible
through a plug-in mechanism. MonALISA(Stratan
et al., 2009) provides a distributed monitoring ser-
vice based on a scalable dynamic distributed architec-
ture. These systems are designed mainly for monitor-
CLOSER2013-3rdInternationalConferenceonCloudComputingandServicesScience
452

ing distributed systems and Grids, but do not address
the requirements of Cloud monitoring, e.g., elasticity.
Elasticity is a fundamentalproperty of Cloud comput-
ing and is not considered as a requirement by these
systems. As a result these system can not cope with
dynamic changes of monitored entities. Moreover,
none of these systems provides built-in advanced an-
alytics e.g. complex event processing (CEP), stream
processing or machine learning algorithms. Open
source Cloud platforms like OpenNebula, OpenStack,
Cloud Foundry and OpenShift Origin offer only very
basic monitoring, which is not very useful for root
cause analysis of performance anomalies. Katsaros
et al., presents service-oriented approach for collect-
ing and storing monitoring data from a physical and
virtual infrastructure. The proposed solution extends
Nagios with a RESTful interface (Katsaros et al.,
2011). Rak et al., presents a brief overview of the
mOSAIC API, that can be used to build up a cus-
tom monitoring system for a given Cloud application
(Rak et al., 2011). Aceto et al., provides specific anal-
ysis on definitions, issues and future directions for
Cloud monitoring (Aceto et al., 2012). Hasselmeyer
and D’Heureuse proposes a monitoring infrastructure
that was designed with scalability, multi-tenancy, dy-
namism and simplicity as major design goals (Has-
selmeyer and D’Heureuse, 2010). Most of the above
mentioned monitoring techniques address one spe-
cific functional tier at a time. This makes them inad-
equate in real world domains, where changes in one
tier effect others.
Root cause analysis is known throughout the lit-
erature. Commercial service management systems
like HP OpenView (OpenView, 2013) or IBM Tivoli
(Tivoli, 2013) can help in root cause analysis. These
tools use expert systems with rules and machine learn-
ing techniques. Magpie (Barham et al., 2003) uses
machine learning to build a probabilistic model of re-
quest behavior moving through the distributed sys-
tem to analyze system performance. InteMon (Hoke
et al., 2006) is an intelligent monitoring system tar-
geting large data centers. It tries to spot correlations
and redundancies by using the concept of hidden vari-
ables. Gruschke et al., introduces an approach for
event correlation that uses a dependency graph to rep-
resent correlation knowledge (Gruschke and Others,
1998). Hanemann introduced a hybrid event Correla-
tion Engine that uses a rule-based and case-based rea-
soner for service fault diagnosis (Hanemann, 2007).
These root cause analysis techniques do not consider
the Virtualization technologies, therefore would fail
to address the challenges of root cause analysis in
Virtualized cloud systems. However, there are few
recent research efforts exploring root cause analysis
issues in virtualized systems like clouds. CloudPD
(Sharma et al., 2012) is a fault detection system for
shared utility Cloud. It uses a layered online learn-
ing approach and pre-computed fault signatures to di-
agnose anomalies. It uses an end-to-end feedback
loop that allows problem remediation to be integrated
with cloud steady state management systems. Peer-
Watch (Kang et al., 2010) utilizes a statistical tech-
nique, canonical correlation analysis (CCA), to model
the correlation between multiple application instances
to detect and localize faults. DAPA(Kang et al.,
2012) is an initial prototype of the application per-
formance diagnostic framework, that is able to lo-
calize the most suspicious attributes of the virtual
machines and physical hosts that are related to the
SLA violations. It utilizes Least Angle Regression
(LARS) and k-means clustering algorithm for their
prototype. PREPARE (Tan et al., 2012) incorporates
Tree-Augmented Naive (TAN) Bayesian network for
anomaly prediction, learning-based cause inference
and predictive prevention actuation to minimize the
performance anomaly penalty.
Root cause analysis work in context of Cloud
Computing is at an early stage. Most existing Cloud
monitoring and Analytics techniques address tier-
specific issues. These techniques can not deal with
real-world scenarios, where changes in one tier often
affect other tiers.
6 CONCLUSIONS AND FUTURE
WORKS
In this paper, we presented two real-world application
scenarios for deriving requirements and presented the
prototype of our Monitoring and Analytics frame-
work. The architecture is designed with Cloud-scale
scalability and flexibility as major design goals.
We believe that the architecture provides all the
desired features for SLA-aware root cause analysis in
a Cloud environment. The Analytics component of
the framework is under active development. On the
research track, our focus is on time series forecasting,
feature selection algorithms (O’Hara and Sillanp¨a¨a,
2009), and fault localization techniques. In near fu-
ture, we plan to evaluate our algorithms by deploying
them in our prototype.
REFERENCES
Aceto, G., Botta, A., Donato, W. D., and Pescap`e, A.
(2012). Cloud Monitoring: definitions, issues and fu-
ture directions. In IEEE CLOUDNET 2012.
PracticalAspectsforEffectiveMonitoringofSLAsinCloudComputingandVirtualPlatforms
453

Agarwal, M., Appleby, K., Gupta, M., and Kar, G. (2004).
Problem determination using dependency graphs and
run-time behavior models. Utility Computing, pages
171–182.
Appleby, K., Goldszmidt, G., and Steinder, M. (2001).
Yemanja-a layered event correlation engine for multi-
domain server farms. In Integrated Network Man-
agement Proceedings, 2001 IEEE/IFIP International
Symposium on, volume 00, pages 329–344. IEEE.
Barham, P., Isaacs, R., and Mortier, R. (2003). Magpie:
Online modelling and performance-aware systems. In
In Proceedings of the Ninth Workshop on Hot Topics
in Operating Systems.
Chen, M., Kiciman, E., and Fratkin, E. (2002). Pinpoint:
Problem determination in large, dynamic internet ser-
vices. In In Proc. 2002 Intl. Conf. on Dependable Sys-
tems and Networks.
Ejarque, J., Fit´o, J. O., Katsaros, G., Luis, J., and Martinez,
P. (2011). OPTIMIS Deliverable Requirements Anal-
ysis ( M16 ). Technical report, NTUA, ATOS, SCAI,
SAP, BT, CITY, LUH, 451G, FLEXIANT, ULEEDS.
ESPER (2013). Home page of esper. http://esper.
codehaus.org/index.html. [Online; accessed 26-
March-2013].
Gruschke, B. and Others (1998). Integrated event manage-
ment: Event correlation using dependency graphs. In
Proceedings of the 9th IFIP/IEEE International Work-
shop on Distributed Systems: Operations & Manage-
ment (DSOM 98), pages 130–141.
Hanemann, A. (2007). Automated IT Service Fault Diag-
nosis Based on Event Correlation Techniques. PhD
thesis.
Hasselmeyer, P. and D’Heureuse, N. (2010). Towards holis-
tic multi-tenant monitoring for virtual data centers.
2010 IEEE/IFIP Network Operations and Manage-
ment Symposium Workshops, pages 350–356.
Hoke, E., Sun, J., Strunk, J., and Ganger, G. (2006). Inte-
Mon: continuous mining of sensor data in large-scale
self-infrastructures. ACM SIGOPS Operating Systems
Review, 40(3):38–44.
Jeune, G. L., Garc´ıa, E., Perib´a˜nez, J. M., and Mu˜noz,
H. (2012). 4CaaSt Scientific and Technical Report
D5.1.1. Technical report, Seventh Framework Pro-
gramme.
Kang, H., Chen, H., and Jiang, G. (2010). PeerWatch: a
fault detection and diagnosis tool for virtualized con-
solidation systems. In Proceedings of the 7th inter-
national conference on Autonomic computing, pages
119–128.
Kang, H., Zhu, X., and Wong, J. (2012). DAPA: diagnos-
ing application performance anomalies for virtualized
infrastructures. 2nd USENIX workshop on Hot-ICE.
Katsaros, G., K¨ubert, R., and Gallizo, G. (2011). Building a
Service-Oriented Monitoring Framework with REST
and Nagios. 2011 IEEE International Conference on
Services Computing, 567:426–431.
Massie, M. (2004). The ganglia distributed monitoring sys-
tem: design, implementation, and experience. Parallel
Computing, 30(7):817–840.
Molenkamp, G. (2002). Diagnosing quality of service faults
in distributed applications. Performance, Computing,
and Communications Conference, 2002. 21st IEEE
International.
Nagios (2013). Home page of nagios. http://
www.nagios.org/. [Online; accessed 26-March-2013].
O’Hara, R. B. and Sillanp¨a¨a, M. J. (2009). A review of
Bayesian variable selection methods: what, how and
which. Bayesian Analysis, 4(1):85–117.
OpenShift (2013). Home page of openshift. https://
www.openshift.com/. [Online; accessed 26-March-
2013].
OpenStack (2013). Home page of openstack. http://
www.openstack.org/. [Online; accessed 26-March-
2013].
OpenTSDB (2013). Home page of opentsdb. http://
opentsdb.net/. [Online; accessed 26-March-2013].
OpenView (2013). Hp openview — wikipedia, the free
encyclopedia. http://en.wikipedia.org/w/index.php?
title=HP OpenView&oldid=547020972. [Online; ac-
cessed 26-March-2013].
Rak, M., Venticinque, S., Mhr, T., Echevarria, G., and Es-
nal, G. (2011). Cloud Application Monitoring: The
mOSAIC Approach. 2011 IEEE Third International
Conference on Cloud Computing Technology and Sci-
ence, pages 758–763.
Sharma, B., Jayachandran, P., Verma, A., and Das, C.
(2012). CloudPD: Problem Determination and Diag-
nosis in Shared Dynamic Clouds. cse.psu.edu, pages
1–30.
Stratan, I. L., Newman, H., Voicu, R., Cirstoiu, C., Grigo-
ras, C., Dobre, C., Muraru, A., Costan, A., Dediu, M.,
and C. (2009). MONALISA: An Agent based , Dy-
namic Service System to Monitor , Control and Op-
timize Grid based Applications The Distributed Ser-
vices. Computer Physics Communications, 180:2472–
2498.
Tan, Y., Nguyen, H., and Shen, Z. (2012). PREPARE: Pre-
dictive Performance Anomaly Prevention for Virtual-
ized Cloud Systems. In Distributed Computing Sys-
tems (ICDCS), 2012 IEEE 32nd International Confer-
ence on, number Vcl.
Tivoli (2013). Home page of ibm tivoli. http://
www.tivoli.com/. [Online; accessed 26-March-2013].
Yaqub, E., Wieder, P., Kotsokalis, C., Mazza, V., Pasquale,
L., Rueda, J. L., G´omez, S. G., and Chimeno, A. E.
(2011). A generic platform for conducting sla negoti-
ations. In Service Level Agreements for Cloud Com-
puting, pages 187–206. Springer.
Yaqub, E., Yahyapour, R., Wieder, P., and Lu, K. (2012).
A protocol development framework for sla negotia-
tions in cloud and service computing. In Service
Level Agreements for Cloud Computing, pages 1–15.
Springer.
CLOSER2013-3rdInternationalConferenceonCloudComputingandServicesScience
454
