
Numerical Simulation of Odorous Dispersion Hydraulics
and Aeration Device in WWTP’s
Hatem Dhaouadi
1
and Hatem Mhiri
2
1
Science Faculty, Monastir University, Bvd de l’Environnement, Monastir, Tunisia
2
National Engineering School, Monastir University, Ibn El Jazzar Street, 5000 Monastir, Tunisia
Keywords: CFD, Odour Dispersion, Airlift Hydraulics, Aeration.
Abstract: Most of the WWTP use biological processes which are intrinsically dynamic because of the large variations
in the wastewater flow rate, pollutants concentration and composition. These variations are to a large degree
not possible to control and the use of simulator may be helpful. CFD, one of the most used numerical tool, is
employed in this study to prospect three particular technical aspects of WWTP, namely odors dispersion,
hydraulics of a high rate airlift algal pond and mass transfer performances of surface aerators. Fluent
®
software is used and the validation of the developed models is made using a real scale WWTP data. This
experimental validation is supported by the monitoring of the main odour pollution parameter (gaseous H
2
S
concentration) through different zones around El-Frina WWTP. CFD models are also used to examine the
behavior of gas and liquid phase dynamic throughout the high rate airlift algal pond and results are
compared to those obtained with measurements made at Sidi Bouali WWTP. Concerning the aeration
system capacity, gas liquid mass transfer study of surface aerators has been conducted on a lab scale
Rushton blades.
1 INTRODUCTION
Computational Fluid Dynamics (CFD) is more and
more used in the environmental system analysis. We
will present here three different applications of CFD
utilisation in the field of wastewater treatment plant
(wwtp) management.
The first case, the atmospheric dispersion of
odours issued from an urban biological wwtp. The
second study deals with the surface aerator from gas
liquid mass transfer point of view and finally, the
CFD contribution to the hydrodynamic study of a
real scale high rate airlift algal pond. In the three
cases, a powerful software is used, Fluent
®
.
Concerning the first case, the study of wwtp
odours atmospheric dispersion and on the basis of
olfactometric measurements, the sludge drying beds
are identified to be the principal emission source of
hydrogen sulphide, the main odorous component
(Maïzi et al., 2010). This study has been applied to
El Frina WWTP (Monastir, Tunisia).
Concerning the second case related to the study
of surface aerators from the gas liquid mass transfer
point of view, a lab scale Rhuston turbine blades are
used to validate the developed model before going
on with a real scale aerator. The only measured
parameter is the dissolved oxygen concentration.
The variables are the blades immersion rate and the
turbine radial speed. Experiences are made with
different liquid viscosities and surface tension.
Several immersion rates and blades speed has been
investigated and the dissolved oxygen is measured
using the gassing off method with nitrogen. An exact
analytical solution is used to evaluate the K
l
a
coefficient. The volumetric mass transfer coefficient
is then correlated to the gas holdup in the reactor for
aeration capacity calculations, which allows the
model validation (Achouri et al., 2013). Finally and
concerning the last case, a real scale (Sidi Bouali,
Tunisia) high rate airlift algal pond is studied from
the hydrodynamic point of view. The novelty in Sidi
Bouali WWTP is that the used device for fluid
motion in the algal pond is an airlift. Hydraulic
control in such system is primordial because it
directly affects the algae to bacteria growth rate.
Here, the velocity contour curves allow the
diagnostic of stagnant zones especially at the pond
extremity and the phase holdup contours shows
clearly how efficient is the airlift porous aerators and
their influence towards the global liquid velocity
fixing the algal / bacterial mass growth rate.
377
Dhaouadi H. and Mhiri H..
Numerical Simulation of Odorous Dispersion Hydraulics and Aeration Device in WWTP’s.
DOI: 10.5220/0004508003770381
In Proceedings of the 3rd International Conference on Simulation and Modeling Methodologies, Technologies and Applications (SIMULTECH-2013),
pages 377-381
ISBN: 978-989-8565-69-3
Copyright
c
2013 SCITEPRESS (Science and Technology Publications, Lda.)
2 MATERIAL AND METHODS
In what follows will be detailed the mathematical
modelling and the numerical resolution using a
commercial software, FLUENT
®
for the odours
atmospheric dispersion only. The same methodology
is adopted for the two other case of study, namely
the gas liquid mass transfer in the case of the surface
aerators and the hydrodynamic study of an airlift
algal pond used for a real scale municipal
wastewater treatment plant.
2.1 Mathematical Modelling
Atmospheric dispersion consists of two processes:
transport and diffusion. Equations governing this
problem are obtained using the Favre decomposition
and are given in the following table.
The introduction of fluctuating terms makes this
equation system open. Its closure requires the use of
a turbulence model that allows getting an equal
equation’s number to the unknown number. For this
survey, a first order closing model was adopted.
With the use of the latter, transport equations for the
turbulent kinetic energy (k) and its dissipation rate
(), are given in the table below, where R is the
dissipation rate production term, C
1
, C
2
, C
3
are
empiric coefficients having the values of 1.42, 1.68
and 1, respectively (Fluent User Guide, 2006).
Mass balance
0
j
j
u
x
Momentum
balance
()
ji
ij
ij
jij
uu
p
uu
xxx
Concentration
balance
'' ''
()
m
m
j
m
j
jjj
uC
C
DuC
xxx
Energy balance
Pr
j
T
x x
j
pt
jjt
uT
C
x
(k)
Pr
t
i
ijkj
k
ku P G
xx x
()
132
²
Pr
t
i
ij j
uCPCGCR
xx xk k
(k): Turbulent kinetic energy balance
(): Dissipation rate balance
In the present work, all simulations are carried
out using a finite volume method FLUENT to model
3D steady turbulent atmospheric dispersion of
odorous compounds. In the present finite volume
method, the solution domain is subdivided into a
finite number of continuous control volumes.
2.2 Numerical Solver
The FLUENT software offers several CFD models:
the Reynolds Average Navier–Stokes (RANS)
models which include the standard renormalisation
group (RNG) and real (RSM) model. After testing
each of these, respectively, the RNG k– model was
selected because odour emission velocity at the
source outlet is feeble, besides RNG k– model
generated the least cells number, compared to other
models. Its calculating time per iteration was
obviously small compared to the calculating time per
iteration of the RSM model.
The RNG k– model is based on two transport
equations for the turbulent kinetic energy k and its
dissipation rate which uses a cross-diffusion term
in the equation to ensure the appropriate equations
model behaviour in both the near-wall and far-field
zones (Fluent user guide, 2006).
The FLUENT 6.2 steady three-dimensional
segregated solver was used to solve the RNG k–
model using the implicit scheme. The upwind
second and first orders of discretisation schemes
were used to convert the governing equations into
algebraic equations for their numerical solution. The
Standard scheme was used to solve for pressure
while the upwind first and second orders were used
to solve for odorous compounds dispersion,
momentum, turbulent dissipation rate, turbulent
kinetic energy and energy. The SIMPLE method
was used to calculate for pressure-velocity coupling.
Several wind speeds were used to study the
influence of aerodynamic aspects on odorous
compounds dispersion in the vicinity of the WWTP
of Monastir and to estimate the distribution of the
contaminants concentrations released by that source
in the atmosphere, and consequently characterizing
the propagation of their odours in the neighbouring
buildings.
2.3 Meshing
Previous runs proved that the contribution of drying
beds is by far great compared to the odours intensity
released by the other devices in the WWTP of
Monastir, and this is due to their important size. In
fact the pollutant plume emitted by the drying beds
was by far great compared to the plume emitted by
the other devices. Therefore, the study was limited
to odorous compounds emitted by the drying beds,
in order to reduce the calculation time and the
SIMULTECH2013-3rdInternationalConferenceonSimulationandModelingMethodologies,Technologiesand
Applications
378
number of cells. Drying beds have a rectangular
shape, their whole length is 200 m and their whole
width is 86 m. Buildings were designed as a brick
shape located at a distance L
1
downwind of 550 m
from the source. The “GAMBIT” software was used
to create the computational volume, since it allows
meshing domains into two or three dimensions with
different geometric shapes. The flow topology
requires a very fine meshing in a big part of the
domain. In order to follow with precision every mass
and aerodynamic fields variation, particularly in
regions where gradients are important, a non
uniform meshing, greatly contracted in the drying
beds and buildings vicinity, which allows to display
the recirculation and the vortices created, was
adopted. Meshes are made extremely contracted in
the neighbouring of the drying beds and around
buildings.
2.4 Boundary Conditions
The boundary of the computed domain included
the clean air and odour inlet, the fluid outlet, the
walls of the computational volume and the
buildings. The bottom and the upper surfaces of
the computational domain were modelled as wall
surfaces. The vertical profile of the horizontal
wind velocity and the temperature were inputs, as
well as the turbulence kinetic energy k and its
dissipation rate .
In this paper, the assumptions taken to solve
odorous compounds dispersion are:
- The flow is considered three-dimensional,
turbulent and stationary,
- The wind speed is considered constant and its
direction is parallel to the passage centre line,
- Continuous pollutants emission with constant
concentration,
Temperature gradients are negligible.
Furthermore, the evolution of the ammonia
plume was the same as the H
2
S plume, so that the
study was limited to follow the distribution of H
2
S
concentration.
3 RESULTS
3.1 Odours Dispersion
When a pollutant passes beyond buildings, several
turbulence scales can be identified. Near the
release source, there are diffusion scales that
cause the pollutant dispersion. In the case of
numeric simulations of odorous compounds
dispersion around buildings, this phenomenon is
rarely reported in other papers. The different
parametric studies achieved in the current work
are made in the case of brick buildings as shown
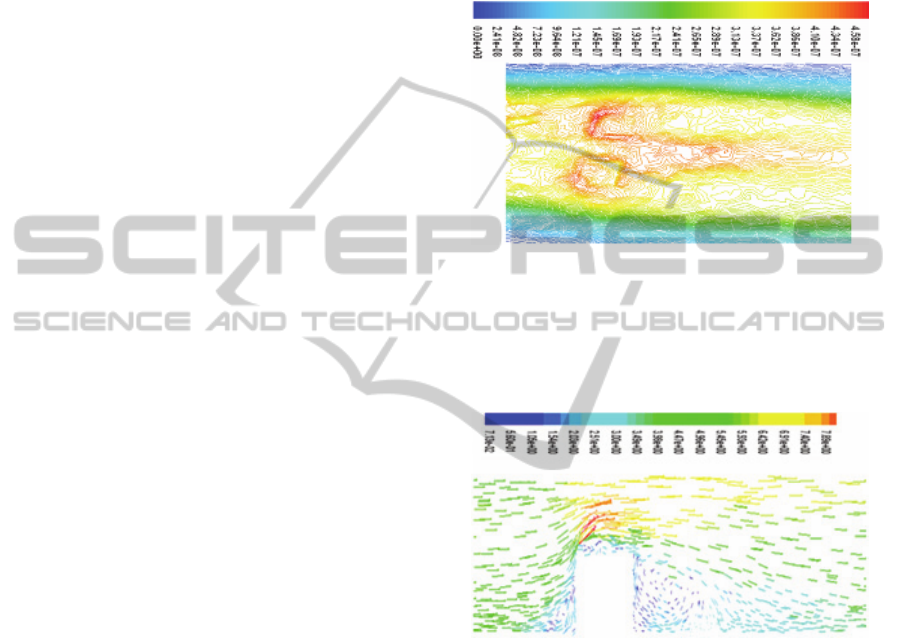
in Fig. 1.
Figure 1: Iso-concentration of hydrogen sulphide on
buildings roofs.
The survey of pollutant mass dispersion
requires a good understanding of the flow
behaviour around an obstacle.
Figure 2: Distribution of longitudinal velocity around
buildings.
The extent of the recirculation zone (Fig. 2),
the boundary layer separation, the reattachment
and the nature of vortices that are separated from
the obstacle, will interact with the pollutant and
thus influence its dispersion since the buildings
have sharp edges, which amplify instability. With
the developed model, many scenarios can be
studied varying the odorant components, wind
speed and building shapes.
3.2 Surface Aerators Mass Transfer
Gas liquid mass transfer study of surface aerators
has been first conducted on a lab scale Rushton
blades. Several immersion rates (Fig. 3) and blades
NumericalSimulationofOdorousDispersionHydraulicsandAerationDeviceinWWTP's
379
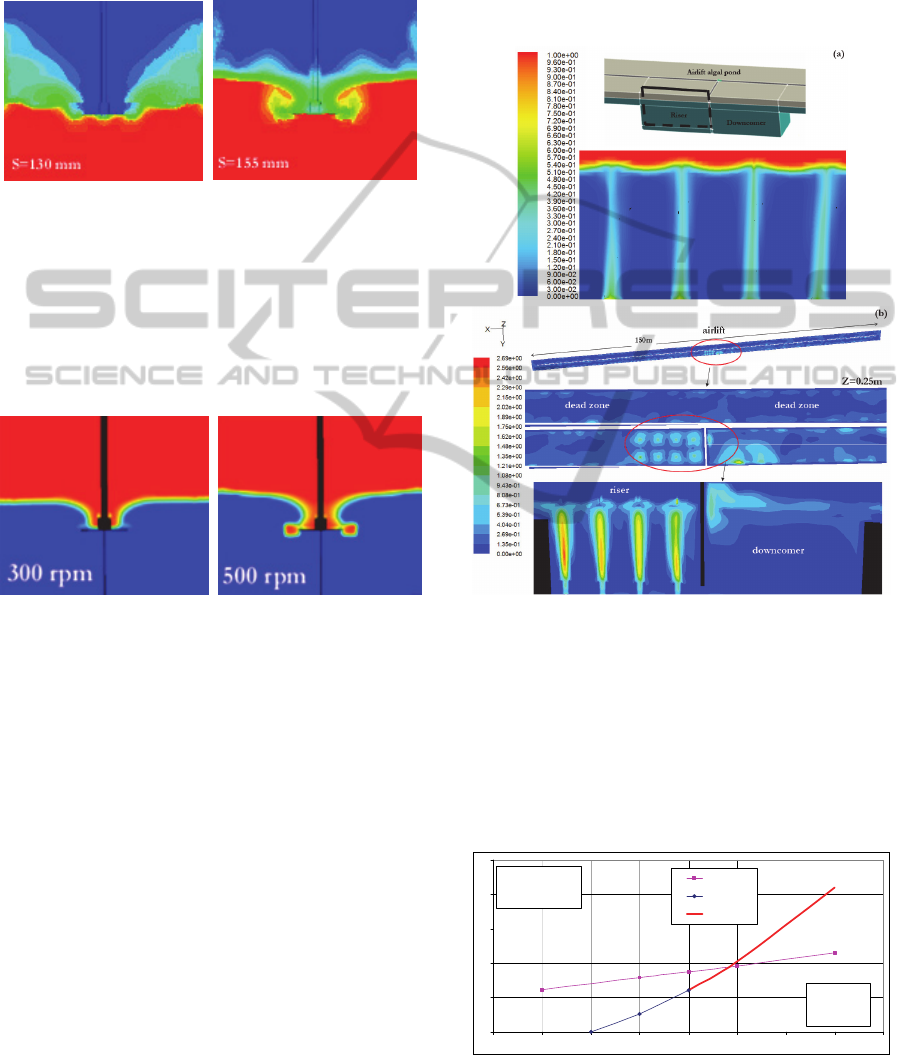
speed (Fig. 4) has been investigated. The dissolved
oxygen (DO) variation is measured using the gassing
off method with nitrogen. An exact analytical
solution is used to evaluate the K
l
a coefficient by
fitting the experimental DO results.
Figure 3: Paddle immersion effect on gas liquid transfer.
The volumetric mass transfer coefficient is then
correlated to the gas holdup, a CFD result, which
allows the model validation. The K
l
a value is
proportional to the aeration capacity, which is the
most crucial energetic parameter in WWTP (50 to
70% of energetic expenses in activated sludge
WWTP are for aeration needs).
Figure 4: Paddle velocity effect on gas liquid transfer.
The determination of the best blade geometry
profile, allowing minimum energy consumption,
with the same aeration capacity (Achouri et al.,
2012), is the main target of this investigation
3.3 Airlift Algal Pond Hydrodynamics
The hydraulic study of the high rate airlift algal pond
is essentially based on the study of the bubble pump
(airlift). The developed model for the real scale
pond, 150*4*0.5m, showed reliable results and
allows the evaluation of all hydraulic parameters, i.e.
the gas holdup (Fig. 5a) and liquid velocity all over
the algal pond.
In the computing domain, meshes are made
extremely contracted in the bubble pump, which
is t
he most interesting study zone. Within this area
the liquid gets the needed energy, resulting from the
injected air isothermal expansion, allowing its
motion across the entire channel.
The current design of algae ponds lacks visual
assessment of hydrodynamic characteristics,
resulting in the appearance of dead zones where the
flow is stagnant and in the presence of non-uniform
velocity throughout the pond (Fig. 5b). Dead zones,
because of their negative impact on algae growth,
have to be avoided (Hadiyanto et al., 2013).
Figure 5: Gas holdup (a) and liquid velocity (b) profile in
the high rate airlift algal pond.
In the figure 6 below are compared the liquid
mean velocity in the channel to the measured liquid
velocity at the surface.
Experimentally, the former is very hard to get
and the latter is far from the real mean velocity
which is the most important parameter in fixing the
growth rate between algal and bacterial species.
air flow rate
(Nm
3
h
-1
)
5
10
15
20
25
30
0 5 10 15 20 25 30 35 40
mean water
velocity (cm s
-1
)
CFD
Exper.
Extrap.
Figure 6: CFD and experimental mean water velocity in
the airlift algal pond.
SIMULTECH2013-3rdInternationalConferenceonSimulationandModelingMethodologies,Technologiesand
Applications
380

Tracer technique is used to get the experimental
measurement of surface liquid velocity while the
CFD result is a mean of more than 300,000 value of
local velocity all over the algal pond.
4 CONCLUSIONS
The CFD contribution to the WWTP management
is well appreciated when the developed models
are validated and compared with experimental
investigations. In our case the model elaboration
is the limiting step in the simulation process while
the experimental validation generally comes to
comfort the obtained results. We do not think that
CFD can contribute to the automation of the
studied process but it can make it clearer and
many scenario can be tested without being obliged
at each step to make experiments. CFD results can
be notably improved in gas liquid system studies
(airlift bubble pump, surface aerators, etc...) by
introducing the population balance module in
local properties calculations and this is one of our
main concerns for the moment. Further CFD
investigations related to the optimisation of
anaerobic digesters mixing are now conducted.
The power consumption and the reduction of
WWTP energetic expenses being our main target.
ACKNOWLEDGEMENTS
The authors would like to thank all the contributors
to this work: Amira Maïzi, Ryma Achouri and Rym
Ben Moussa.
REFERENCES
Achouri, R., Ben Hamza, S., Dhaouadi, H., Mhiri, H.,
Bournot, P., 2013. Volumetric mass transfer
coefficient and hydrodynamic study of a new self-
inducing turbine. Energy Conversion and
Management 71, 69–75.
Achouri, R., Mokni, I., Mhiri, H., Bournot, P., 2012. A 3D
CFD simulation of a self inducing Pitched Blade
Turbine Downflow. Energy Conversion and
Management 64, 633–641.
Fluent User Guide, septembre 2006, Fluent Inc., Lebanon
NH03766.
Maïzi, A., Dhaouadi, H., Bournot, P. Mhiri, H., 2010.
CFD prediction of odorous compound dispersion:
Case study examining a full scale waste water
treatment plant. Biosystems Engineering 106, 68 – 78.
Hadiyanto, H., Elmore, S., Van Gerven, T., Stankiewicz,
A., 2013. Hydrodynamic evaluations in high rate algae
pond (HRAP) design. Chemical Engineering Journal
217, 231–239.
NOTATION
C concentration (kg m
-3
)
Cp calorific capacity (J kg
-1
K
-1
)
D mass diffusivity (m
2
s
-1
)
G
buoyancy production term
K Stevens equation constant
k turbulence kinetic energy (m
2
s
-2
)
P turbulence kinetic energy production
term due to mean velocity gradients
R velocities quotient (v
0
/u
∞
)
T temperature (K)
u, v, w velocity component on x, y and z (m.s
-1
)
"
j
"
i
uu
Reynolds tension
x, y, z longitudinal, vertical and lateral
components (m)
Greek symbols
energy dissipation rate (m
2
s
-3
)
thermal conductivity (w m
-1
K
-1
)
viscosity (m
2
.s
-1
)
Index
Favre mean
─ mean
ambient area
0 at the source outlet
k turbulent kinetic energy
m mixture species
t turbulent
th threshold
ε turbulent dissipation rate
NumericalSimulationofOdorousDispersionHydraulicsandAerationDeviceinWWTP's
381
