
RFID based Data Mining for E-logistics
Yi Wang
1
, Quan Yu
2
and Kesheng Wang
2
1
School of Materials, University of Manchester, Manchster, U.K.
2
Department of Production and Quality Engineering, Norwegian University of Science and Technology,
Trondheim, Norway
Keywords: RFID, Data Mining, Association Rules, E-logistics, System Integration.
Abstract: Radio Frequency Identification (RFID) is a useful ICT technology for E-logistics Enterprises. One of the
standards used for RFID is Electronic Product Code Information Services (EPCIS). However, it is non-
trivial to get effective knowledge from massive data to improve the existed production or logistic system
comparing with convenient data collection. In this paper, we develop an intelligent platform which
combines RFID for data acquisition, Data Mining for knowledge discovery and enterprise applications in
the field of E-logistics. Especially association rule is applied to mine the associations between the
distribution nodes and product quality within a product distribution logistic network on the basis of RFID
datasets. The analysis result is the same as in the problem hypothesis, which concludes that it will be
applicable for such kind of product distribution network analysis.
1 INTRODUCTION
Electronic Logistics (E-logistics) is concerned with
the efficient integration of suppliers, factories,
warehouses and stores, so that products are
distributed to customers in the right quantity and at
the right time. Efficient and reliable supply chain is
important to trade and industry. The ICT enables
significant development of the supply chain. New
ICT can change the business process models and can
give speed to the growth of the e-logistics.
The
integration of ICT have become competitive
necessities in most industries (Patterson et al., 2003).
In recent years, Radio Frequency Identification
(RFID) technology has become a mainstream
application for handling manufactured goods and
materials. As an important driver in today’s
information-based industries and economics, RFID
enables identification from a distance without
requiring close-contact as the bar code technology.
RFID tags support a larger set of unique IDs than
bar codes and can incorporate additional data such
as manufacturer, product type, and even measure
environmental factors such as temperature.
Furthermore, RFID systems can discern many
different tags located in the same general area
without manual assistance.
RFID technology has been applied to many areas
such as supply chain, logistics, libraries and
agriculture (Laniel et al., 2008); (Amador et al.,
2009); (Abad et al., 2009); (Koutsoumanis et al.,
2005); (Emond and Nicometo, 2006). Combining
with Data Mining approaches, research fields cover
such as object tracking (Cabanes et al., 2008),
customer purchasing behaviour analysis (El-Sobky
and AbdelAzeim, 2011), supply chain management
(Ho et al., 2010) and outlier detection (Masciari,
2011).
In this paper, we develop an intelligent platform
which combines RFID for data acquisition, Data
Mining for knowledge discovery and enterprise
applications in the field of E-logistics and supply
chain management. We propose a RFID based
logistic network. The RFID data is acquired
following to the EPCIS standard, which is fabricated
but reasonable. Combining with Data Mining
approaches – in this paper the association rule is
applied, the relevance between the network nodes
and product quality are managed to be deduced by
analysing the product flow and the quality.
The paper is organized as the following: Section
1 introduces the features and applications of e-
logstics and the importance of integrating RFID
technology and Data Mining approaches. Section 2
gives a glimpse of an RFID system briefly. Section 3
introduces the definition and application of Data
371
Wang Y., Yu Q. and Wang K..
RFID based Data Mining for E-logistics.
DOI: 10.5220/0004508303710378
In Proceedings of the 4th International Conference on Data Communication Networking, 10th International Conference on e-Business and 4th
International Conference on Optical Communication Systems (ICE-B-2013), pages 371-378
ISBN: 978-989-8565-72-3
Copyright
c
2013 SCITEPRESS (Science and Technology Publications, Lda.)

Mining. Section 4 proposes an platform of
intelligent integrated RFID system, which consists
of 6 levels, and describes each level respectively.
Section 5 gives a detailed introduction to a typical
Data Mining approach - Association Rules. Section
6 describes a detailed implementation of the
intelligent RFID based integrated system. Section 7
comes to the conclusion of the feasibility of the
intelligent RFID system.
2 RFID IN E-LOGISTIC
2.1 RFID System
Radio-frequency identification (RFID) is one of
numerous technologies grouped under the term of
Automatic Identification (Auto ID), such as bar
code, magnetic inks, optical character recognition,
voice recognition, touch memory, smart cards,
biometrics etc. Auto ID technologies are a new way
of controlling information and material flow,
especially suitable for large production networks
(Elisabeth et al., 2006). RFID is a wireless non-
contact radio system, which transfers data from a tag
attached to an object, for the purposes of
identification and tracking. It is a means of
identifying a person or object using a radio
frequency transmission. The technology can be used
to identify, track, sort or detect a wide variety of
objects (Lewis, 2004). RFID system can be
classified by the working frequency, i.e. Low
Frequency (LF), High Frequency (HF), Ultra High
Frequency (UHF) and Microwave. Different
frequency works for various media, e.g. UHF is not
applicable to metal but HF is metal friendly. Thus,
the working frequency has to be used on the basis of
tracked objects.
Hardware of RFID system includes RFID tag,
RFID reader and RFID antenna. RFID tag is an
electronic device that can store and transmit data to a
reader in a contactless manner using radio waves,
which can be read-only or read-write. Tag memory
can be factory or field programmed, partitionable,
and optionally permanently locked, which enables
the users save the customized information in the tag
and read it everywhere, or kill the tag when it will
not be used anymore. Bytes left unlocked can be
rewritten over more than 100,000 times, which
achieves a long useful life. Moreover, the tags can
be classified by power methods i.e. passive tags
without power, semi-passive tags with battery and
active tags with battery, processor and i/o ports. The
power supply increases the cost of the tag but
enhance the readable performance. Furthermore, a
middleware is required as a platform for managing
acquired RFID data and routing it between tag
readers and other enterprise systems. Recently,
RFID become more and more interesting technology
in many fields such as agriculture, manufacturing
and supply chain management.
2.2 The Role of RFID in E-Logistics
Applying RFID technology can lead to large gains in
the overall supply chain effectiveness (Agrawal et
al., 2009); (Dutta et al., 2007) conclude that RFID
integration through E-business architectures
provides more benefits than technology integration
in current business processes. The roles of RFID in
E-logistics include warehouse management,
counterfeiting and efficient response to changing
demand. (Kärkkäinen, 2003) E-logistics
measurement such as store compliance, trend rates,
and recovery rates and return inventory turnover can
be collected with RFID technology (Payaro, 2004).
Since 2006, Airbus has applied RFID to save
millions of euros for cutting process cycle times,
eliminating paperwork, and reducing inventory
(Wasserman, 2007). Zaharudin et al. (2006) indicate
that RFID can reduce the bullwhip effect through
information sharing between all supply chains.
Saygin et al. (2007) suggests that RFID can reduce
the bullwhip effect by a better visibility obtained
through real-time information of product’s locations.
3 DATA MINING (DM)
3.1 Definition
DM is an integration of analysis and modeling
technologies developed over the last twenty years.
DM is often defined as the process of extracting
valid, previous unknown, comprehensible
information from large data bases in order to
improve and optimize business decision-making
process. (Wang, 2007)
Many traditional reporting and query tools and
statistical analysis systems use the term "Data
Mining" in their product descriptions. It leads to the
question, “What is a DM and what isn't?” The
ultimate objective of DM is knowledge discovery
and DM methodology is a technique to extracts
predictive information and knowledge from
databases. With such a broad definition, however, an
On-line Analytical Processing (OLAP) product or a
statistical package could qualify as a DM tool, so
ICE-B2013-InternationalConferenceone-Business
372

some have narrowed the definition. In my option, a
DM method should unearth knowledge
automatically. By this definition DM is data-driven,
whereas by contrast, traditional statistical, OLAP,
reporting and query tools are user-driven. It is best
to define them as Business Intelligence (BI) tools
rather than DM tools.
Using the narrowed definition of DM mentioned
above, we would like to follow that DM techniques
are at the core of DM process, and can have different
functions (tasks) depending on the intended results
of the process. In general, DM functions can be
divided into two broad categories: discovery DM
and predictive DM.
(1). Discovery Data Mining
Discovery Data Mining is applied to a range of
techniques, which find patterns inside a dataset
without any prior knowledge of what patterns exist.
The following examples of functions of discovery
Data Mining: (1). Clustering; (2). Link analysis; and
(3). Frequency analysis; etc.
(2). Predictive Data Mining
Predictive Data Mining is applied to a range of
techniques that find relationships between a specific
variable (called the target variable) and the other
variables in your data. The following are examples
of functions of predictive Data Mining: (1).
Classification; (2). Value predication; and (3).
Association rules; etc.
3.2 Techniques
This paper will focus on the Associations mining
techniques. However, a variety of techniques are
available to enable the above functions. Each
technique contains numerous algorithms, for
example, there are more than 100 different models
of Artificial Neural Networks. With systems
increasing complexity, it is clear that the DM
techniques should be used concurrently rather than
separately. (Wang and Wang, 2012) A hybrid DM
system in which several techniques with different
functions can be integrated to achieve a desired
result are often more effective and efficient than a
single one. For example, in order to identify the
attributes that are significant in a manufacturing
process, clustering can be used first to segment the
process database into a given predefined number of
categorical classes and then classification can be
used to determine to which group a new data
belongs.
3.3 Procedures
The generic DM procedure from IBM viewpoint
(Baragoi et al., 2001) involves seven steps as the
following:
1. Defining the business issue in a precise
statement,
2. Defining the data model and data requirements,
3. Sourcing data from all available repositories and
preparing the data
4. Evaluating the data quality,
5. Choosing the mining function and techniques,
6. Interpreting the results and detecting new
information, and
7. Deploying the results and the new knowledge
into your business.
To understand how DM can overcome a variety
of problems in manufacturing, we consider some
activities in a manufacturing company.
4 INTEGRATED RFID SYSTEMS
A RFID system is used to trace and track objects
with RFID tags. However, it is far from sufficient to
only acquire the RFID data. It will be more valuable
to combine an RFID system with Data Mining
approaches and construct an intelligent integrated
RFID system, with the ability to convert data into
knowledge and assist managers to make decisions.
The E-business system is designed on the basis of
RFID system and introduced in the following sub-
sections.
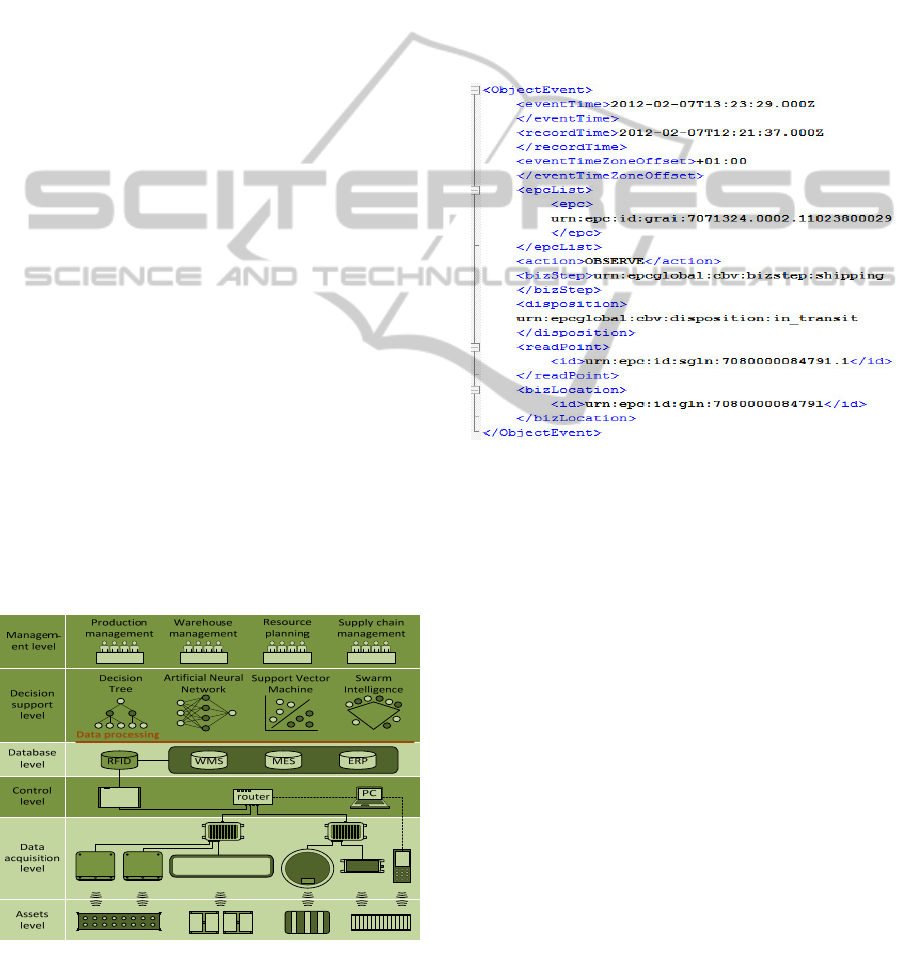
4.1 System Models
The integrated e-business system developed in
Knowledge Discovery Laboratory at NTNU is
architecturally based on RFID system, decision
support system and enterprise applications as shown
in Figure 1. The intelligent integrated system
consists of 6 levels:
1. Assets level,
2. Data acquisition level,
3. Control level,
4. Database level,
5. Decision support level, and
6. Business Management Level
4.1.1 Assets Level
On the basis of production and logistic system, the
assets level of the intelligent integrated RFID system
contains products (from materials to finished goods),
RFIDbasedDataMiningforE-logistics
373
conveyor belts, machines, pallets, packages and
shelves etc.
4.1.2 Data Acquisition Level
The hardware of a RFID system consists of RFID
tags, antennas, readers and middleware.
4.1.3 Control Level
A router or switch is used to build up the connection
between the devices. A PC is used to configure the
equipment at the data acquisition level. During the
deployment of the RFID system, the RFID tags are
attached to the objects, which are carried by the
products or pallets and pass through the conveyor
belt, then are packed and stored on the shelves.
RFID antennas with various properties are installed
respectively at different positions to construct a
network of read points. When the object with a
RFID tag passes through a read point, it will be
detected by the antenna automatically.
4.1.4 Database Model
Thus, as the system runs, the middleware organizes
the RFID tag information and forwards it to RFID
database. Moreover, the integration of RFID
database with other advanced database (e.g. WMS
database, MES database and ERP database) is also
performed by the middleware.
4.1.5 Decision Support Level
It is vital in the integrated e-business system.
The function of decision support level has beed
described in section 3 in detail.
Figure 1: Structure of the intelligent integrated RFID
systems.
4.2 EPCIS Standard
Electronic Product Code (EPC) provides a unique,
serialized identifier for any kind of object, which is
defined in the EPCglobal Tag Data Standard
(EPCglobal Inc
TM
, 2007). Electronic Product Code
Information Services (EPCIS) is an EPCglobal
standard for sharing EPC related information
between trading partners. EPCIS provides important
new capabilities to improve efficiency, security, and
visibility in the global supply chain, and
complements lower level EPCglobal tag, reader, and
middleware standards.
Figure 2: A section of an XML dataset following the
EPCIS.
EPCIS supports a detailed representation of the
location and state of material as it moves between
organizational boundaries. It provides important
business information including the time, location,
disposition and business step of each event during an
item life, which means 4W – What (product), Where
(location), When (time) and Why (business step and
status). The information is stored in an XML
database.
By gathering datasets during an item in a supply
chain and sorting on the basis of EPC and time
information, the product flow is able to be extracted
for data mining.
5 ASSOCIATION RULES
Association rule is one of the data mining
approaches for analysing associations among the
items (Han et al., 2012). According to Mild and
Reutterer (2003), Boztuğ and Silberhorn (2006) and
ICE-B2013-InternationalConferenceone-Business
374
Boztuğ & Reutterer (2008), there are two types of
association approach; exploratory and explanatory.
The exploratory approach aims to uncover and
summarise the interrelationships within categories or
between items often purchased together (Boztuğ and
Reutterer, 2008). Under exploratory approaches,
Julander (1992) and Dickinson et al. (1992) used
pairwise association measures to identify
relationships between item pairs while Agrawal and
Srikant (1994), Buechter and Wirth (1998) and
Hildermand et al. (1999) discovered association
rules between subsets of categories purchased
together using data mining technique.
Exploratory approach presents previously
undiscovered category relationships in a more
aggregate manner, whereas explanatory approach is
more targeted, with known variables to be analysed
(Mild and Reutterer, 2003). Explanatory approach
aims to study the effect of marketing mix and
demographic variables on choice across multiple
categories (Mild and Reutterer, 2003); (Hoch et al.,
1995).
Let
12
,,,
m
III I
be a set of items. Let D be
a set of transactions where each transaction T is a set
of items such that
TI
. An association rule is an
implication of the form
A
B
, where
A
I
,
BI
and
AB
. The rule is evaluated with
support value and confidence value. Two measures
are usually applied. The support s is the percentage
of transactions in D that contain
A
B
, which is
taken to be the probability
P
AB
.
⟹
∪
∪
The confidence c is the percentage of transactions in
D containing A that also contains B, which is taken
to be conditional probability
P
BA
, the
relationship between c and s is shown below
s
upport A B
confindence A B P B A
support A
In general, association rule mining consists of two
steps:
Find all frequent itemsets, which will occur at
least as frequently as a predetermined minimum
support
Generate strong association rules from the
frequent itemsets, which must satisfy minimum
support and minimum confidence.
6 IMPLEMENTATION
By analyzing the product flow, potential factors
could be referred, which are related to the
qualification; meanwhile, possible solutions are also
expected to improve the existed logistic network.
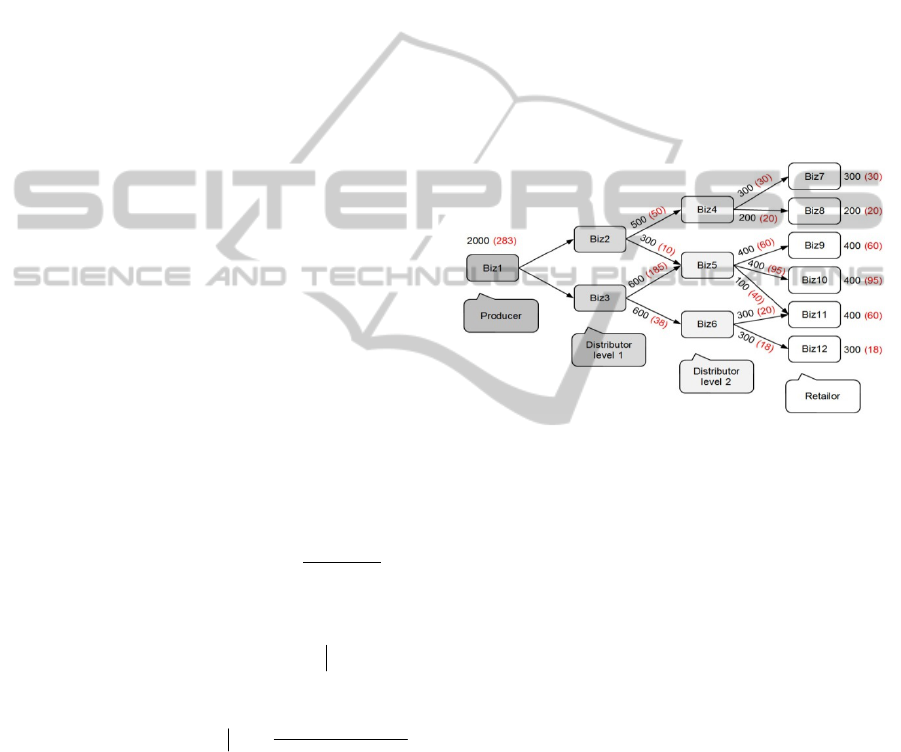
6.1 Problem Description
In this paper, a flowchart-like structure is supposed
to simulate a product distribution network. Products
are distributed to retailers through the designed
network, such as milk is delivered to supermarkets
from the factory. The supposed distribution network
includes 4 layers and 12 nodes totally as shown
below.
Figure 3: The supposed distribution logistic network.
The 4 layers are respectively the Producer layer, the
Distributor level 1, the Distributer level 2 and the
Retailer layer. Each layer consists of nodes
represented with Biz, which are corresponding to the
“business location” in EPCIS. The numbers
represent the amount of distributed products in each
distribution; moreover, the numbers in parentheses
mean the amount of unqualified products included in
corresponding branch. In the model design, most
unqualified products are delivered through the path
which consists of the nodes of Biz1, Biz3, Biz5 and
Biz10. The object of the hypothesis is to find the
most related nodes in the network if given the
product qualification and RFID data of products.
Two reading-points are set at each business
location in the middle layers, where one is for the
products in while another is for the product out. The
time duration is also designed to be independent for
each branch in the supposed network, where T
_in
means the arrival time of product to the
corresponding business location while T
_out
means
the departure time of the products. In the terminal
Retailer layer, only arrival time is considered
because we suppose the products are inspected to be
RFIDbasedDataMiningforE-logistics
375
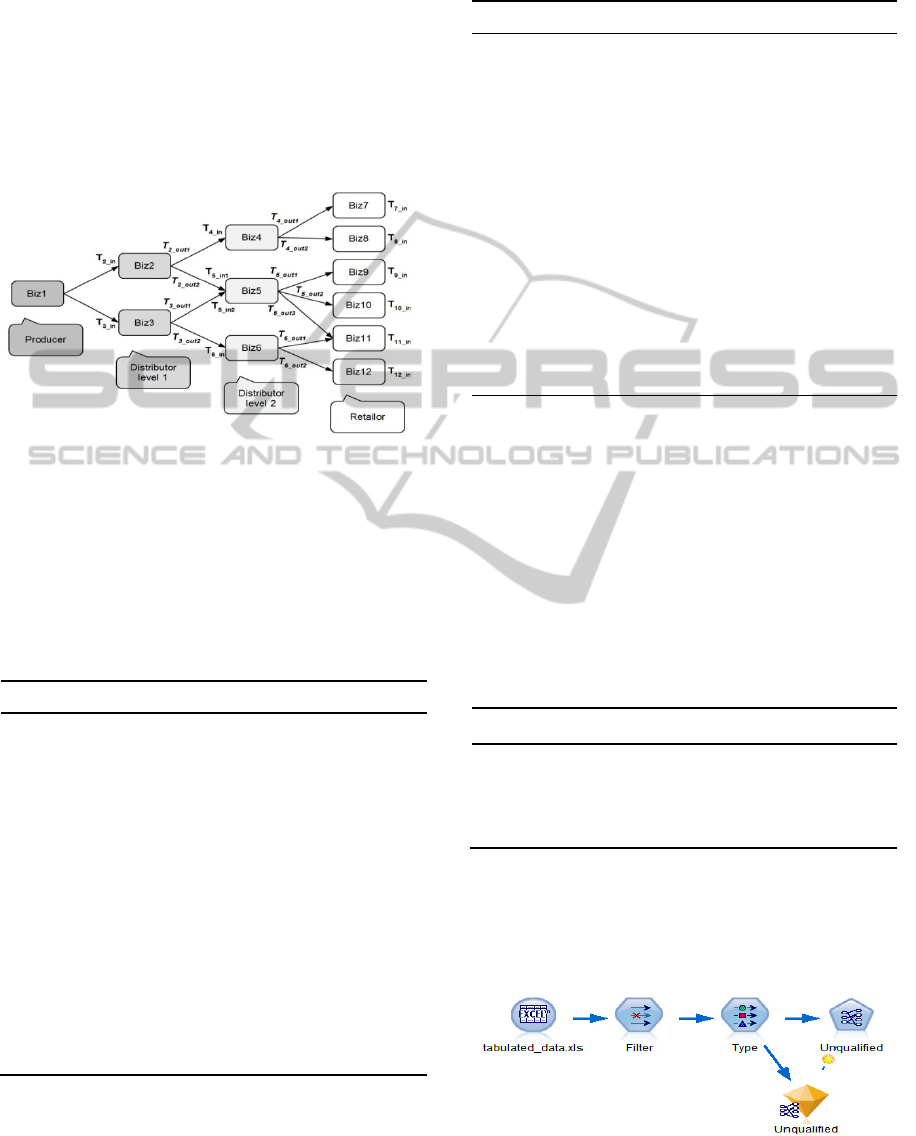
bad after the deliveries to the retailers.
Regarding this problem, known parameters
consist of the quality of the products when they are
delivered to the retailers and RFID datasets recorded
at each read point. The RFID datasets are fabricated
for the products according to EPCIS standard on the
basis of the supposed network. For simplicity, only
four keywords of the EPCIS tag are kept, including
EventTime, EpcList, ReadPoint and BizLocation as
shown in table 1.
Figure 4: A time-based logistic network as an
experimental case.
Supposing that all the RFID datasets are collected
from the read points and put together, the delivery
path of products are able to be derived according to
the parameters of EpcList .
Table 1: The fabricated RFID datasets at one of the
readpoints.
EventTime EpcList ReadPoint BizLocation
19.03.2012
09:04
7071371.0001.00000001 7080000000419.1 7080000000419
19.03.2012
09:04
7071371.0001.00000006 7080000000419.1 7080000000419
19.03.2012
09:03
7071371.0001.00000007 7080000000419.1 7080000000419
19.03.2012
09:04
7071371.0001.00000009 7080000000419.1 7080000000419
19.03.2012
09:04
7071371.0001.00000010 7080000000419.1 7080000000419
19.03.2012
09:01
7071371.0001.00000011 7080000000419.1 7080000000419
19.03.2012
09:04
7071371.0001.00000014 7080000000419.1 7080000000419
19.03.2012
09:01
7071371.0001.00000019 7080000000419.1 7080000000419
19.03.2012
09:01
7071371.0001.00000020 7080000000419.1 7080000000419
EventTime, constructing a vector with the form of
[EPC, (l
1
, t
1
), (l
2
, t
2
),…, (l
k
, t
k
)], where l
k
means the
location k and t
k
means the time spent on k. The
datasets are organized as shown in Table 2.
Table 2: RFID Datasets are organized according to EPCIS
keywords.
EpcList 7071371.0001.00000001 7071371.0001.00000002 …
EventTime
19.03.2012 08:02 19.03.2012 08:30
…
BizLocation
7080000000418 7080000000418
EventTime
19.03.2012 09:04 19.03.2012 09:30
BizLocation
7080000000419 7080000000420
EventTime
19.03.2012 13:01 19.03.2012 14:34
BizLocation
7080000000419 7080000000420
EventTime
19.03.2012 14:32 19.03.2012 16:03
BizLocation
7080000000422 7080000000423
EventTime
19.03.2012 17:01 19.03.2012 18:00
BizLocation
7080000000422 7080000000423
EventTime
19.03.2012 18:03 19.03.2012 19:30
BizLocation
7080000000426 7080000000429
6.2 Data Preparation and Analysis
As the first step of flow analysis, only the location is
considered while the time domain is ignored in this
paper. We do the association rule analysis in IBM
SPSS Modeler® to find the relevance between the
product quality and the business locations, and also
the most relevant path in the network. The datasets
are organized according to the requirement for the
data import of the software, as shown in Table 3.
Table 3: Data preparation for association rule analysis.
EPC biz1 biz2 biz3 biz4 biz5 biz6 biz7 biz8 biz9 biz10 biz11 biz12 Q
Code 1 T T F F T F F F T F F F F
Code 2 T F T F F T F F F F F T F
Code 3 T F T F T F F F F T F F T
Where T (True) means Event occurs and F (False)
means not.
The association rule analysis is performed using
the Apriori algorithm in IBM SPSS Modeler®. The
model is setup as Figure 5.
Figure 5: Model setup in IBM SPSS Modeler®.
ICE-B2013-InternationalConferenceone-Business
376

After the calculation, the relevance between the
nodes and the quality is represented by the
confidence and rule support, which is listed in Table
4. By sorting the rule support value and confidence
value, the importance of the nodes are able to be
deduced.
First, we filter the result using a threshold of
Rule support value. Supposing that it is set to be 9,
only the first 4 rules are included. Then the
confidence value is considered, a high value means a
strong relevance. Thus, Rule 3 and Rule 4 are the
strongest rules with the highest confidence value.
Meanwhile, regarding the model design, products of
biz3 are all delivered from biz1, so rule 3 is the same
as Rule 4. Then the nodes most relevant to the
quality defect are founded which includes biz5, biz3
and biz1. On the other hand, the longest rule is the
Rule 12 which includes 4 nodes, the same as in the
design model. The association rule data mining
successfully acquired most relevant nodes and the
most relevant path are both deduced the same as the
design.
Table 4: Association rules generated.
Rule
ID
Antecedent Confidence %
Rule
Support %
1 biz5 21.78 9.80
2 biz5, biz1 21.78 9.80
3 biz5, biz3 30.83 9.25
4
biz5, biz3 and
biz1
30.83 9.25
5 biz10 24.00 4.80
6 biz10 and biz5 24.00 4.80
7 biz10 and biz3 24.00 4.80
8 biz10 and biz1 24.00 4.80
9
biz10, biz5 and
biz3
24.00 4.80
10
biz10, biz5 and
biz1
24.00 4.80
11
biz10, biz3 and
biz1
24.00 4.80
12
biz10, biz5, biz3
and biz1
24.00 4.80
7 CONCLUSIONS
In this paper, we develop an intelligent integrated
platform for e-business, which consists of 6 levels:
1. Assets level, 2. Data acquisition level, 3. Control
level, 4. Database level, 5. Decision support level,
and 6. Business Management Level. The main focus
of this paper is on (1) RFID system that is used for
data acquisition automatically and (2) Data Mining
(knowledge discovery) model that is applied for
optimizing decision support processes.
An E-logistic network for product distribution is
proposed. The RFID data is acquired following to
the EPCIS standard, which is fabricated but
reasonable. The RFID datasets are generated
following EPCIS standard. The product flow is
acquired via analyzing the whole datasets. Given the
quality of the products, association rule is applied to
mining the associations between the distribution
nodes and the product quality. After the support and
confidence is calculated, the most relevant nodes
and path have been deduced, as the description in
the problem design. It concludes that association
rule mining is applicable to find potential quality
related factors within existed logistic network
combining with RFID technology. The further
research will be done for flow analysis for a real
company.
REFERENCES
Agrawal, R.N. Sengupta, K. Shanker, 2009. Impact of
information sharing and lead time on bullwhip effect
and on-hand inventory, European Journal of
Operational Research, 192, pp. 576–593
Abad, E., Palacio, F., Nuin, M., Zárate, A. González de,
Juarros, A., Gómez, J.M and Marco, S., 2009. RFID
smart tag for traceability and cold chain monitoring of
foods: demonstration in an intercontinental fresh fish
logistic chain, Journal of Food Engineering, 93 (4) ,
pp. 394–399.
Amador, C., Emond, J.P. and Nunes M.C.N., 2009.
Application of RFID technologies in the temperature
mapping of the pineapple supply chain, Sensing and
Instrumentation for Food Quality and Safety, 2009 (3),
pp. 26–33.
Baragoin, C., Andersen, C.M., Bent, G., Lee, J. and
Schommer, C., 2001. Mining your own business in
telecoms using DBM intelligent miner for data, IBM
Redbooks, Corinne Baragoin and International
Business Machine Corporation.
Boztuğ, Y. and Silberhorn, N., 2006.
Modellierungsansätze in der Warenkorbanalyse im
Überblick, Journal für Betriebswirtschaft, Vol. 56, No.
2, pp.105-128.
Boztuğ, Y. and Reutterer, T., 2008. A Combined
Approach for Segment-Specific Analysis of Market
Basket Data. European Journal of Operational
Research, Vol. 187, pp. 294-312.
Buechter, O. and Wirth, R., 1998. Discovery of
association rules over ordinal data: A new and faster
RFIDbasedDataMiningforE-logistics
377

algorithm and its application to basket analysis.
Research and Development in Knowledge Discovery
and Data Mining, pp. 36-47.
Cabanes, G., Bennani, Y., Chartagnat, C. and Fresneau,
D., 2008. Topographic connectionist unsupervised
learning for RFID behavior data mining, Secondary
Topographic connectionist unsupervised learning for
RFID behavior data mining, pp. 63-72.
Dutta, A., Lee, H., Whang, S., 2007. RFID and operations
management: technology, value, and incentives,
Production and Operations Management, 16 (5), pp.
646–655.
Dickinson, R., Harris, F. and Sircar, S., 1992.
Merchandise compatibility: An exploratory study of
its measurement and effect on department store
performance. International Review of Retail,
Distribution and Consumer Research, 2 (4) (1992), pp.
351–379
Emond, J. P. and Nicometo, M., 2006. Shelf-life
prediction and FEFO inventory management with
RFID. In: Cool Chain Association Workshop.
Temperature Measurements-When, Where and How?
Knivsta, Sweden.
Elisabeth, I., Zsolt, K., Péter, E. and László, M., 2006. The
RFID Technology and Its Current Applications.
Proceeding of The Modern Information Technology in
the Innovation Process of the Industrial Enterprise-
MITIP, pp.29-36.
El-Sobky, H. and AbdelAzeim, M., 2011. A novel model
for capturing and analyzing customers' preferences for
ceramic tiles, Secondary A novel model for capturing
and analyzing customers' preferences for ceramic
tiles, pp. 460-465.
EPCglobal Inc
TM
, 2007. EPC Information Services
(EPCIS) Version 1.0.1 Specification.
Han, J., Kamber, M. and Pei, J., 2012. Data mining:
concepts and techniques, Amsterdam: Elsevier.
Hilderman, R., Hamilton, H. and B. Barber, 1999.
Ranking the interestingness of summaries from data
mining systems. In Proc. of the 12th International
Florida Artificial Intelligence Research Symposium
(FLAIRS'99), pp.100-106, Orlando, FL, May 1999.
Ho, G. T. S., Choy, K. L. and Poon, T. C., 2010. Providing
decision support functionality in warehouse
management using the RFID-based fuzzy association
rule mining approach, Secondary Providing decision
support functionality in warehouse management using
the RFID-based fuzzy association rule mining
approach, pp. 1-7.
Hoch, S. J. and Kim, B. D., Montgomery, A. L. and Rossi,
P. E. 1995. Determinants of Store-Level Price
Elasticity. Journal of Marketing Research, Vol. 32,
No. 1 (Feb., 1995), pp. 17-29.
Julander, C., 1992. Basket Analysis: A New Way of
Analysing Scanner Data. International Journal of
Retail & Distribution Management 20 (7), pp. 10-18.
Koutsoumanis, K., Taoukis, P. S. and Nychas, G. J. E.,
2005. Development of a safety monitoring and
assurance system for chilled food products,
International Journal of Food microbiology, 100
(1–3), pp. 253–260.
Kärkkäinen, M., 2003. Increasing efficiency in the supply
chain for short shelf life goods using RFID tagging
International Journal of Retail and Distribution
Management, 31 (10) pp. 526–536.
Laniel, M., Emond, J. P., Altunbas, A. E., 2008. RFID
behavior study in enclosed trailer/container for real
time temperature tracking. In: Food Processing
Automation Conference. Providence, Rhode Island,
USA.
Lewis, S., 2004. A Basic Introduction to RFID technology
and Its Use in the Supply Chain. Laran RFID, White
Paper.
Masciari, E., 2011. Trajectory Outlier Detection Using an
Analytical Approach, Secondary Trajectory Outlier
Detection Using an Analytical Approach, pp. 377-384.
Mild, A., and Reutterer, T., 2003. An improved
collaborative filtering approach for predicting cross-
category purchase based on binary market basket data.
Journal of Retailing and Consumer Services, 10, pp.
123–133.
Patterson K. A, Grimm, C. M. and Corsi T. M. (2003).
Adopting new technologies for supply chain
management Transportation Research Part E:
Logistics and Transportation Review, 39 (2), pp. 95–
121
Payaro, A., 2004. The role of ict in reverse logistics: A
hypothesis of rfid implementation to manage the
recovery process. In Proceedings of the 2004
eChallenges conference, Vienna, Austria, 27–29th
October.
Saygin, C., Sarangapani, J., Grasman, S. E., 2007. A
Systems Approach to Viable RFID Implementation in
the Supply Chain. Springer Series in Advanced
Manufacturing.
Wang, K., 2007. Applying data mining to manufacturing:
the nature and implications, Journal of Intelligent
Manufacturing, Vol. 18, No. 4, pp.487-495.
Wang, K, and Wang, Y., 2012. Data Mining for Zero-
Defect Manufacturing, Tapir Academic Press, 2012.
Wasserman, E., 2007. Airbus Grand Plans for RFID.
RFID Journal, (<http://www.rfidjournal.com/
article/articleview/3661/1/80/>. Last viewed
2013,01,25)
Zaharudin, A. A., Wong, C. Y., Agarwal, V., McFarlane,
D., Koh, R., Kang, Y. Y., 2006. The intelligent
product driven supply chain, Tech. Rep. 05, AUTO-ID
LABS.
ICE-B2013-InternationalConferenceone-Business
378
