
An Approach based on Adaptive Decision Tree for Land Cover Change
Prediction in Satellite Images
Ahlem Ferchichi, Wadii Boulila and Imed Riadh Farah
Ecole Nationale des Sciences de l’Informatique, Laboratoire RIADI, Manouba, Tunisia
Keywords:
Remote-sensing, Land-cover Change Prediction, Decision Trees, Data Imperfection, and Artificial Neural
Network.
Abstract:
Decision tree (DT) prediction algorithms have significant potential for remote sensing data prediction. This
paper presents an advanced approach for land-cover change prediction in remote-sensing imagery. Several
methods for decision tree change prediction have been considered: probabilistic DT, belief DT, fuzzy DT, and
possibilistic DT. The aim of this study is to provide an approach based on adaptive DT to predict land cover
changes and to take into account several types of imperfection related to satellite images such as: uncertainty,
imprecision, vagueness, conflict, ambiguity, etc. The proposed approach applies an artificial neural network
(ANN) model to choose the appropriate gain formula to be applied on each DT node. The considered approach
is validated using satellite images representing the Saint-Paul region, commune of Reunion Island. Results
show good performances of the proposed framework in predicting change for the urban zone.
1 INTRODUCTION
The DTs are used in many practical application areas
(Kumar et al., 2011)(Levashenko and Zaitseva, 2012).
The concept of DTs was popularized by Quinlan with
ID3 (Quinlan, 1986). DTs have emerged as an im-
portant tool for addressing many problems related to
remote sensing images (Fried et al., 1999)(Boulila
et al., 2011). Several advantages have encouraged the
use of DTs for land cover prediction (Boulila et al.,
2011). First, DTs are simple to understand and inter-
pret. Second, they perform well with large amounts of
data in a short time. Moreover, a DT prediction gen-
erates rules that are accurate and easily interpretable
with little user intervention. DT is a widely used data
prediction technique for both certain and uncertain
data. Data uncertainty arises in many applications
during the data collection process. In remote sensing,
satellite images are characterized by several imperfec-
tion types.
Many decision tree approaches under imperfec-
tion were proposed in the literature, namely, proba-
bilistic DTs, belief DTs, fuzzy DTs and possibilistic
DTs which were proposed to deal with uncertainty
in data represented, respectively, by means of prob-
ability distributions, basic belief assignments, degree
of membership, and possibility distribution. The dif-
ference between the existing approaches mainly lies
in the type of imperfection related to the problem at
hand (e.g. uncertainty, conflict, imprecision, etc.) and
especially in the way of dealing with that imperfec-
tion when building the tree. The probabilistic DT
is used to classify instances with missing or uncer-
tain attribute values where uncertainty is represented
by a probability (Ozols et al., 2006)(Anuradha et al.,
2012). For example, in the field of remote sensing,
(McIver et al., 2002) use the DTs (C4.5 algorithm)
with prior probabilities to classify land cover. The
second type of DT is the belief DT. It can represent
both imprecision and uncertainty. This method is also
suitable to solve problems where a conflict between
different sources arises. Many studies have been pro-
posed in this context (Trabelsi et al., 2007)(Elouedi
et al., 2001). In the field of remote sensing, (Xuerong
et al., 2010) use the DTs with evidence theory for
satellite image classification. The third type of DT
is the fuzzy DT. It is used to represent the imprecision
and also allows modeling vagueness. Most works in
the literature apply the fuzzy DT for classification and
prediction of imperfect data (Chang et al., 2010)(Lev-
ashenko and Zaitseva, 2012). In the field of remote
sensing, many studies have been developed (Boulila
et al., 2011). Authors in paper (Boulila et al., 2011)
use fuzzy ID3 algorithm with the aim of determining
the fitting of a given state to the different land cover
types (water, urban, forest, etc.). The forth type of
82
Ferchichi A., Boulila W. and Farah R..
An Approach based on Adaptive Decision Tree for Land Cover Change Prediction in Satellite Images.
DOI: 10.5220/0004519700820090
In Proceedings of the International Conference on Knowledge Discovery and Information Retrieval and the International Conference on Knowledge
Management and Information Sharing (KDIR-2013), pages 82-90
ISBN: 978-989-8565-75-4
Copyright
c
2013 SCITEPRESS (Science and Technology Publications, Lda.)
DT is the possibilistic DT. It allows manipulation of
uncertainty, imprecision and ambiguity. Several stud-
ies have been developed for classification and evalu-
ation of imperfect data using possibilistic DT such as
(Hullermeier, 2002)(Amor et al., 2008).
Despite the significant role that DT plays in many
domains, most works in the literature use only one
type of DT whatever the nature of imperfection re-
lated to data is. The main goal of this study is to pro-
pose an adaptive DT for change prediction in satellite
image databases. The adaptive DT integrates several
types of DTs and it adapts the choice of DT to the type
of imperfection related to treated data. This allows
taking into account different types of imperfection re-
lated to satellite images such as uncertainty, impreci-
sion, conflict and ambiguity. The proposed approach
consists of four main processing steps: testing gain
type by neural network, selection of attribute mea-
sure, partitioning strategy and stopping criteria.
2 THE PROPOSED APPROACH
This paper presents an approach for land-cover
change prediction in remote-sensing imagery. This
approach is based on an adaptive DT. The purpose of
adaptive DT is to choose the appropriate DT method
to be applied according to the type of imperfection re-
lated to data. An adaptive DT is a DT with the same
representation of a standard decision tree. However,
on each tree node, we integrate a testing module to
select the type of gain to be applied to choose the se-
lection attribute. The testing module is based on neu-
ral networks. This model takes as input the values
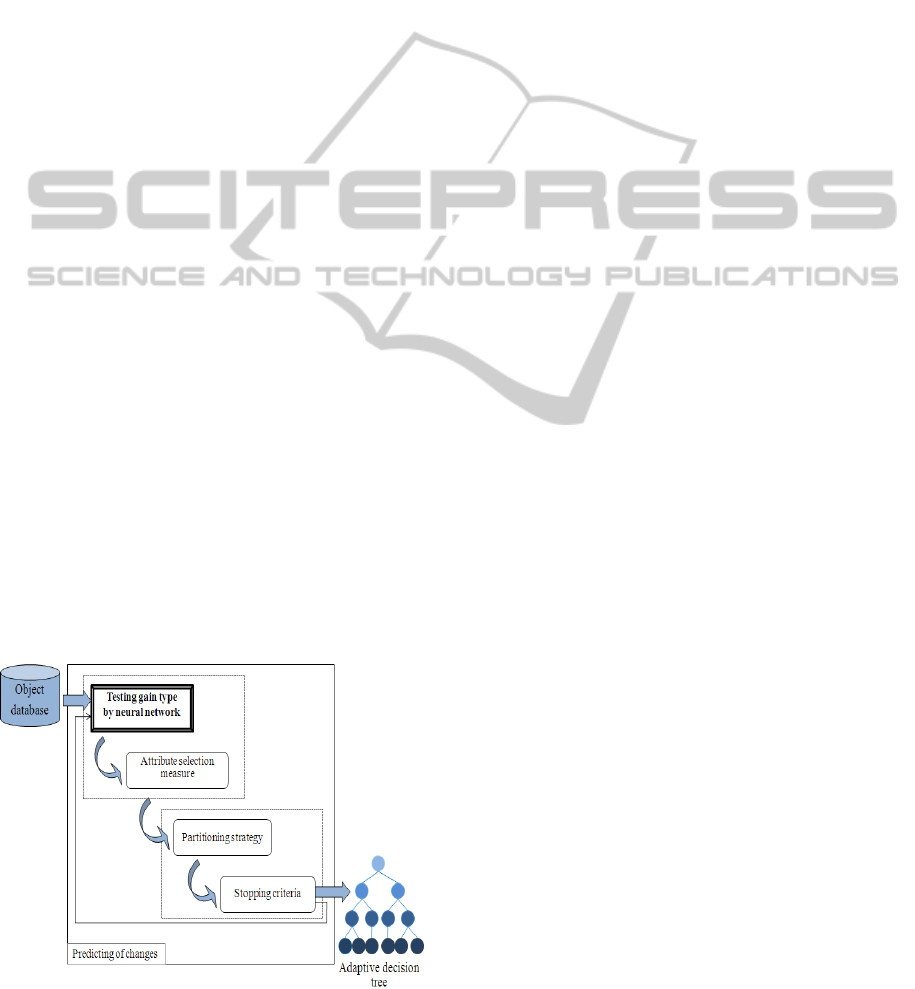
that affect the satellite objects characteristics. Figure
1 illustrates the general architecture of the proposed
approach. It is composed of two modules including
objects database and predicting of changes.
Figure 1: The proposed architecture.
2.1 Object Database
The satellite images were taken by a modeling phase.
This phase consists of three steps: The first step is
to segment the image into regions of homogeneous
pixels. The second step is to select representative
regions. The third step is to classify the objects of
the database according to their degree of similarity
with the query object. The similarity measure is per-
formed between the query state representing the query
object at the date t and all states stored in the base
(these states are all states contained in all models in
the base). Then, all models having a state which is
similar to the query one are considered. Changes re-
lated to satellite image objects are stored in the tem-
poral object database. This database is built during
the off-line mode of the modeling phase. At a given
date t
r
, the set of attribute values of an object defines
the state of this object. In the proposed approach,
each object O
r
is described by a set of states S
r
(t
rn
)
each representing the same objects but at a different
date ( S
r
(t
rn
) denotes the state relative to the object
at the date t
rn
). Interested readers can refer to our
previous works (Boulila et al., 2010)(Boulila et al.,
2011)(Boulila et al., 2012).
So, our approach takes as input this temporal ob-
ject database. It provides as output a set of knowl-
edge describing land cover change. Since the satel-
lite images are tainted by many imperfections types,
the ignorance of these imperfections types will then
be able influence on knowledge found or decisions to
be made. For this, our approach takes into account
the different types of imperfections that are linked to
satellite images and model them at the level of predic-
tion phase.
2.2 Predicting of Changes
2.2.1 Step 1: Testing Gain Type by Neural
Network
The goal of this step is to select the type of gain to
be applied to choose the selection attribute (see step
2 for the types of gain). The choice of the gain na-
ture depends on imperfection type related attributes at
each node. To achieve this task, an ANN is used. The
ANNs have emerged as an important tool to solve this
problem and many other problems related to remote
sensing images (Neagoe et al., 2011). The objective
of testing the gain type or tree type on each node is to
obtain an adaptive tree that take into account several
types of imperfection related to satellite imagery. To
do this, the ANN model is applied on the values that
have influence on the objects characteristics to deter-
AnApproachbasedonAdaptiveDecisionTreeforLandCoverChangePredictioninSatelliteImages
83
mine the different imperfection types on each node.
According to these imperfection types, we will define
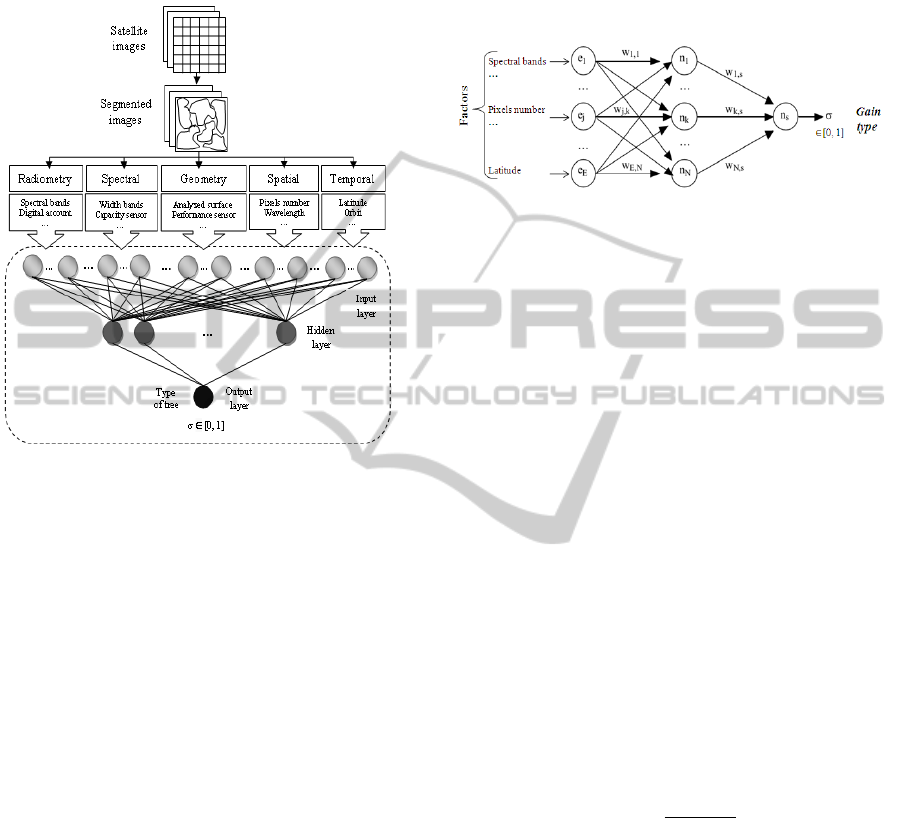
the tree type that we will use. Figure 3 shows the gen-
eral architecture for the choice of DT types.
Figure 2: The proposed architecture of neural network for
choose tree types.
The input data of the neural network are coded and
normalized in vector containing the components ra-
diometric, spectral, geometry, spatial and temporal of
each image. Assume an object,O
P
, is extracted from
a satellite image acquired at date t; this object can
be a lake, vegetation zone, urban area, etc. Details
of object extraction can be found in (Boulila et al.,
2010)(Boulila et al., 2011)(Boulila et al., 2012). Ac-
cording to (Pulvirenti et al., 2011)(Benz et al., 2004),
we determined the factors that have influence on the
characteristics of O
P
.
- The radiometry of the object O
P
depends on:
Spectral bands; Sensor calibration coefficients;
Detectors; Digital account (0-255);
- The spectral characteristic depends on: Sensor ca-
pacity; Width of the interval of each band; Optical
filtering device;
- The geometry depends on: Sensor performance;
Stability of the satellite in its orbit; Analyzed sur-
face;
- The spatial characteristic depends on: Pixels num-
ber; Instantaneous field of view; Wavelength; Al-
titude;
- The temporal characteristic depends on: Satellite
capacity; Latitude; Orbit;
In the proposed approach, we worked with the
multilayer perceptron (MLP) neural networks. The
MLP is a structure consisting of an input layer, one
or more hidden layers, and one output layer. In many
cases (Panda et al., 2004), a hidden layer perceptron
is sufficient to obtain satisfactory results (Fig.4).
Figure 3: MLP: one hidden layer and an output neuron.
The input perceptron is a vector e of dimension
E, and components e
j
where j is an integer of the set
{1, ..., E}. The hidden layer contains N neurons; the
k −th neuron of the hidden layer is designated by n
k
,
where k is an integer of the set {1, ..., N}. The percep-
tron being intended to classify data according to two
categories, the output layer only contains a neuron,
noted n
s
, which provides output σ varies between 0
and 1. Each component of e is connected to N neuron
of the hidden layer and each neuron of this layer is
connected to the output neuron. Connections are af-
fected synaptic weights noted w
j,k
for the connection
of the input component e
j
with the neuron n
k
, and w
k,s
for the connection between the neuron n
k
and output
neuron n
s
. The output s of the neuron n
s
is written as
σ = f (x
s
) with x
s
=
N
∑
k=1
w
k,s
s
k
+ θ
s
(1)
where the constant θ
s
is the bias of neuron n
s
. The
function f (u) is the activation function, which must
be derivable to be able implement learning by back-
propagation of the gradient. The most commonly
used function is the sigmoid function
f (u) =
1
1 + e
(−u)
(2)
The synaptic weights of the neural network are ad-
justed during a learning phase, using a batch of input
vectors A, considered to be representative of the ap-
plication. The set of these vectors, stowed in the form
[e
1
, ...e
i
, ..., e
A
] constitutes a matrix M of E lines and
A columns, called learning matrix of perceptron. An
”epoch” is the presentation, to the neural network, of
the matrix M. An epoch is marked by the integer t be-
longing to the set {1, ..., Q}. At the time t, the neuron
k of the hidden layer provides A outputs s
i
k
(t), where
i is an integer of the set {1, ..., A}. Similarly, the per-
ceptron provides A outputs σ
i
(t). An expert charged
to operate the classification provides A answers h
i
,
KDIR2013-InternationalConferenceonKnowledgeDiscoveryandInformationRetrieval
84

where h
i
belong to the interval [0, 1]. The adjustment
of the synaptic weights takes place by minimization
of square error
4
i
(t) = σ
i
(t) − h
i
(3)
considered as a function of the synaptic weights of
the connections, by a back-propagation algorithm of
gradient (Sawaitul et al., 2012).
2.2.2 Step 2 : Attribute Selection Measure
The first step allows the selection of the type of gain
to be applied at each tree level. Before predicting
changes of an object, a test of the best attribute re-
lated to this object is performed. The latter is pro-
duced by the information gain formula. In the uncer-
tain framework, we use different types of information
gain, such as: probabilistic gain, belief gain, fuzzy
gain, and possibilistic gain. The difference between
these gain resides mainly in the calculation of the en-
tropy. In probabilistic case, the calculation of the en-
tropy is as follows:
entropy(T) = −
n
∑
i=1
p(C
i
). log
2
p(C
i
) (4)
Where T is the training set with uncertain data, p(C
i
)
is the class probability C
i
and log p(C
i
) is the quan-
tity of information that is given when the class is the
expected value of this contents of the information.
Thus, in belief case, the calculation of the entropy
is equal to:
entropy(T) = −
n
∑
i=1
BelP
Θ
{T }(C
i
). log
2
BelP
Θ
{T }(C
i
)
(5)
where BelP
Θ
{T }(C
i
) is the average pignistic proba-
bility function taken over the set of objects T . For
each C
i
∈ Θ, this function equal to:
BelP
Θ
{T }(C
i
) =
1
|T |
∑
I
j
∈T
BelP
Θ
{I
j
}(C
i
) (6)
where BelP
Θ
{I
j
}(C
i
) is the pignistic probability of
each instance I
j
which applies applying the pignistic
transformation to m
Θ
{I
j
}.
In fuzzy case, the entropy of a set of data items,
represented as {t
1
, t
2
, , t
x
}, is given by:
entropy(T ) = −
n
∑
i=1
{
∑
x
h=1
µ(C
i
, t
h
)
|T |
.log
2
∑
x
h=1
µ(C
i
, t
h
)
|T |
}
(7)
Then, in possibilistic case, given an ordered possi-
bility distribution π = {π
(1)
, π
(2)
, ..., π
(n)
} such that
1 = π
(1)
≥ π
(2)
≥ ... ≥ π
(n)
the entropy of π is given
by:
aa
entropy(π) = [
n
∑
i=1
(π
(i)
−π
(i+1)
.log
2
i)]+(1−π
(1)
).log
2
n
(8)
Where π
(n+1)
= 0. Note that the range of entropy is
[0, log
2
n]. entropy(π) = 0 is obtained for the case
of complete knowledge (precise information) and is
reached for the case of total ignorance. For each set
containing n possibility distributions, must induce a
representative possibility distribution of that set π
Rep
.
This possibility distribution is obtained via the arith-
metic mean of π
i
(i = 1..n) and it is given by:
π
AM
(w
q
) =
1
n
n
∑
i=1
π
i
(w
q
) (9)
Then, we should normalize π
AM
to obtain:
π
Rep
(w
q
) =
π
AM
(w
q
)
max
|Ω|
q=1
π
AM
(w
q
)
(10)
Finally, we can measure the discriminate between dif-
ferent sets of possibility distributions using equation
(18).
2.2.3 Step 3: Partitioning Strategy
The partitioning strategy consists in partitioning the
training set according to all possible attribute values
which leads to the generation of one partition per at-
tribute value. In the construction of an ordinary DT,
there is no alternative to partition the training base.
During the construction of a node N, the A
l
attribute
associated to m
j
possible values. Then, the training
set T witch composed of e
i
samples is partitioned into
m
j
subset T
N
j
such as:
∀e
i
∈ T
N
, i f e
i
(A
l
) = v
lk
, then e
i
∈ T
N
k
, 1 ≤ k ≤ m
j
(11)
where v
lk
is a value among the set of possible values
of the attribute A
l
.
and
T
N
=
[
k=1,...,m
j
T
N
k
(12)
and
∀x, k = 1, ..., m
j
, x 6= k, T
N
x
\
T
N
k
(13)
However in the case uncertain, various strategies can
be used depending on the gain type of attribute. Then,
we will divide all elements of the training set in all
subset by giving them a probability distribution, basic
belief assignment, degree of membership or possibil-
ity distribution.
AnApproachbasedonAdaptiveDecisionTreeforLandCoverChangePredictioninSatelliteImages
85

2.2.4 Step 4: Stopping Criteria
They determine the conditions of stopping the parti-
tioning process. The stopping criterion used to decide
whether it is necessary to continue for a training set to
develop the tree. The reasons can be related to a low
number of the example in the considered set or if all
examples of the set have the same class, or at least a
sufficient number relative to the examples number of
the set. The criteria are the same for adaptive decision
tree by adapting the evaluation of these criteria.
The choice of these components (the testing tree
type, the attribute selection measure, the partitioning
strategy, and the stopping criteria) makes the major
difference between DT algorithms. The algorithm
used in our approach for the change prediction is the
C4.5 algorithm (Quinlan, 1993). This type of algo-
rithm has proven its effectiveness in the field of re-
mote sensing (Jiang et al., 2011). It provides a predic-
tive model represented as a DT easily understandable
and interpretable.
2.3 Complexity of Constructing
Adaptive Decision Trees
Finding optimal strategies via an exhaustive enumera-
tion is a highly computational task. For instance, in a
standard decision tree with n objects and m attributes
the complexity is O(n ×m× log(n)). For adaptive de-
cision trees, where the goal is to test the choice of im-
perfection types on each node by neural model which
is O(m
2
). The complexity is:
O(m
2
) + O(n × m × log(n)) = O(m
2
+ (m ×n × log(n)))
(14)
then, the algorithm complexity for constructing a kind
of smallest-scale adaptive decision tree is NP-hard.
Details of NP-hard problems can be found in (Garey
and Johnson, 1979).
3 EXPERIMENTAL RESULTS
The experimental results section is devoted to evalu-
ate the quality of the land cover change prediction of
the proposed approach.
3.1 Study Zone and Data
The study site is the Saint-Paul region, located in the
Indian Ocean, east of Madagascar, about 200 kilo-
meters from the south west of Mauritius, the nearest
island (Fig.5). Saint-Paul is the second-largest com-
mune in the French overseas department of Reunion.
It is located on the extreme west side of Reunion Is-
land.
Figure 4: The studied area.
The satellite images used for the experiments are
coming from the SPOT-5 satellite and acquired on 30
April 2007 and 30 October 2012 (Fig. 7).The second
image is used to test the performance of the proposed
approach in predicting change at the date of October
2012. Generally, we used 483 images SPOT-5 to pre-
dict land cover change.
3.2 Validation of the proposed
Approach
The validation of the proposed approach is divided
into two parts. The first part aims to validate the ANN
module for selection of the DT type. The second part
presents a land-cover change prediction through the
application of the adaptive DT.
3.2.1 First Part: ANN Module
The ANN module uses factors that influence the ra-
diometric, spectral, geometric, spatial, temporal fea-
tures for satellite images. To validate this model, a
variety of network structures has been implemented:
1) the choice of a more hidden layers architecture has
allowed us to infer that a single hidden layer is suf-
ficient, 2) the number of neurons in this single hid-
den layer influences the accuracy of the result despite
its convergence, several tests have revealed that a to-
tal of 15 neurons is sufficient. We could show that
the choice and the structure of multilayer neural net-
work inputs based primarily on the characteristics of
objects that strongly influence on the quality of the
output. To predict the tree type based on the charac-
teristics of images, we assigned the value 0.2 to Prob-
abilistic tree, the 0.4 to Belief tree, 0.6 to Fuzzy tree
and 0.8 to Possibilistic tree. For this study, the neu-
ral networks were simulated in the Neural Network
module of NeurophStudio with NetBeans IDE 7.2.1
(Fig.6).
KDIR2013-InternationalConferenceonKnowledgeDiscoveryandInformationRetrieval
86
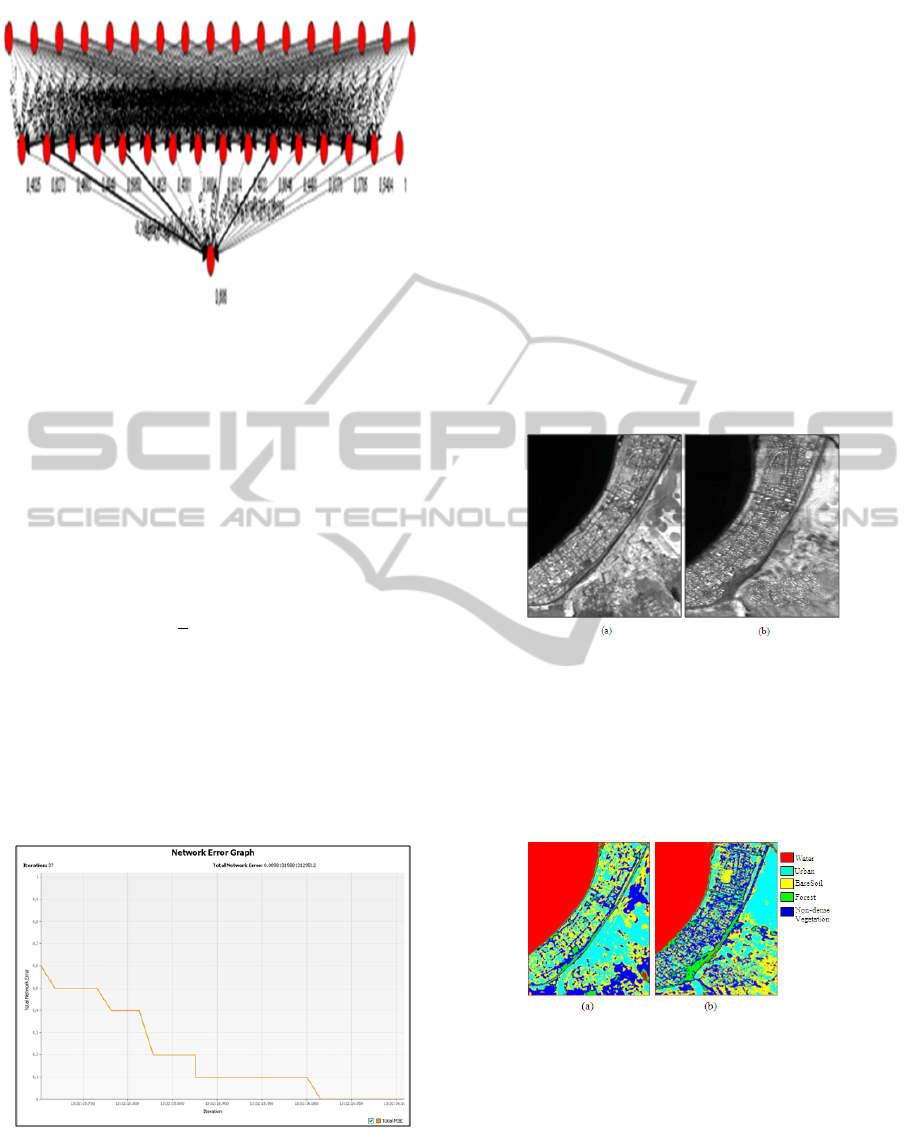
Figure 5: Representative schematic of an artificial neural
network.
The network was tested with different numbers of
learning stages or epochs, different learning rates, and
different numbers of neurons in the hidden layer. The
model runs using 80% of data for training and 20%
for predicting. In addition, generalization techniques,
methods to reduce over-fitting, were analyzed includ-
ing technique such as early stopping by adjusting the
training mean square error (MSE). The MSE is de-
scribed by the following equation:
MSE =
1
2
A
∑
i=1
(σ
i
(t) − h
i
)
2
(15)
h
i
and σ
i
(t) represent the desired output and the out-
put of neuron i in the output layer. Fig.7 depicts that
when iteration times were 37, the error curve had no
more great drop. This denotes that the performance
of the network had been steady. Thus, the training of
the network could be stopped with 37 iteration times,
and it had perfect performance (0.0098131).
Figure 6: Iteration times and prediction error of the ANN
training.
The impact of the contribution of neural networks
for testing tree type on each node from satellite im-
ages by back-propagation was implemented. The pro-
posed algorithm uses the factors affecting image fea-
tures forming an input layer of 17 elements. It was
found that there is no need to design more than 15
neurons in the hidden layer, increasing the number of
neurons significantly improves the results but greatly
increases the calculation time.
3.2.2 Second Part: Land Cover Prediction by
the Adaptive Decision Tree
The second part of the validation section aims to val-
idate the model of the land cover change prediction
of the proposed approach. The urban changes be-
tween the two dates 2007 and 2012 are estimated
based on the proposed approach. Then, these changes
are compared to the real changes computed based on
the two images representing the two dates 2007 and
2012 (Fig.8).
Figure 7: Satellite images: (a)image acquired on 30 Apr
2007 and (b)image acquired on 30 Oct 2012.
Fig. 9 shows the segmented images, acquired on
30 Apr 2007 and 30 October 2012. Five thematic
classes are identified which are the following: (1) ur-
ban; (2) water;(3) forest; (4) bare soil; and (5) non-
dense vegetation areas.
Figure 8: Segmented images: (a) image acquired on 30 Apr
2007, (b) image acquired on 30 Oct 2012.
After image segmentation, the object representing
the ”Urban” area is extracted (Fig. 10) and five fea-
tures (radiometric, geometric, textural, spatial and ac-
quisition context)are calculated. Next, these features
are converted to generate a state representing the ”Ur-
ban” object at the date of 30 Apr 2007.The proposed
approach looks for the most similar states to the query
state and which have a change after five years and
AnApproachbasedonAdaptiveDecisionTreeforLandCoverChangePredictioninSatelliteImages
87

six months. The model of predicting changes for the
query state is performed. It allows the generation of
a change tree for urban site in the Saint-Paul region
between 2007 and 2012. Table 1 presents the pro-
posed changes of the ”Urban” site on October 2012.
Urban site will evolve to water with a percentage of
change equals to 0.54%, to bare soil with a percent-
age of change equals to 8.09 %, to non-dense vegeta-
tion with a percentage of change equals to 17.26%, to
forest with a percentage of change equals to 10.78%
and to urban with a percentage of change equals to
63.33 %. Table 2 shows the real changes on 30 Octo-
ber 2012. The important changes are concerning the
forest and the non-dense vegetation zone.
Figure 9: ”Urban” object extracted: (a) image acquired on
30 Apr 2007, (b) image acquired on 30 Oct 2012.
Table 1: Proposed change for the ”Urban” site at the date
2012.
Land cover type Percentage of change
Water 0.54
Bare soil 8.09
Non-dense vegetation 17.26
Forest 10.78
Urban 63.33
Table 2: Real change detection for the ”Urban” site between
2007 and 2012.
Land cover type Percentage of change
Water 0.69
Bare soil 6.96
Non-dense vegetation 21.95
Forest 9.11
Urban 61.29
Saint-Paul is among regions in the Reunion Island
that presents problems of urban sprawl. In fact, natu-
ral and agricultural areas are being rapidly converted
to urban which affects agricultural activities.
3.3 Evaluation of the proposed
Approach
In order to evaluate the proposed approach, we com-
pared their performance in predicting land cover
changes to the approaches presented in (Mishra et al.,
2011)(Mitra et al., 2002). The evaluation is carried
out through the Kappa coefficient computed from a
visual assessment followed by a statistical analysis
through the calculation of a confusion matrix that es-
tablished between the ground truth and different clas-
sifications. From this matrix, we compute the statis-
tical parameter ”Kappa” which is an indicator of the
overall accuracy (Congalton, 1991). This coefficient
is defined by the following equation:
Kappa =
N
∑
M
i=1
X
ii
−
∑
M
i=1
(X
i+
× X
j+
)
N
2
−
∑
M
i=1
(X
i+
× X
j+
)
(16)
Where
X
i j
: the elements of the confusion matrix; X
i+
: the to-
tal sum of the elements in rows; X
+i
: the total sum of
the elements in columns; X
ii
: the diagonal elements;
N : the total number of pixels of the matrix; M : the
number of classes considered.
The results in Table 3 indicate that the Adaptive
decision tree model produces better prediction results
compared to the benchmark approaches.
Table 3: Interpretation of proposed approach.
Approach Kappa
Proposed approach (adaptive DT) 0.8621
Approach Mishra et al. (Probabilistic DT) 0.8200
Approach Mitra et al. (Fuzzy DT) 0.8222
4 CONCLUSIONS
DT is one of the successful data mining techniques
used in classification or prediction. However, most
works within the literature uses only one method of
DT to process all types of imperfection related to data.
In this study, an adaptive DT method for land
cover change prediction is discussed. The proposed
approach allows modeling several imperfection types
such as uncertainty, imprecision, conflict and ambigu-
ity using neural model. The combination of DT with
different logics offers the potential for mapping and
understanding environmental changes. The applica-
tion of the ANN module allows retrieving the appro-
priate DT method. This allows for a better model-
ing of imperfection related to attributes at each node
of the DT. The application of the proposed approach
is estimate urban changes at the Saint-Paul region in
KDIR2013-InternationalConferenceonKnowledgeDiscoveryandInformationRetrieval
88

the Reunion Island. The same process can be repli-
cated to compute changes for the others land cover
types. The proposed approach presents a useful tool
for disaster prevention and monitoring, planting sta-
tus of agricultural products, and tree distribution of
forests. The evaluation depicts good results of the
proposed approach in predicting urban changes.
Future prospects are primarily research and ex-
traction of other relevant descriptors and indicators
that affect objects features of satellite images and im-
prove the complexity of our algorithm. Another chal-
lenge is to apply the proposed approach on others
sites.
ACKNOWLEDGEMENTS
There are so many people who have provided me with
their support, and it is not easy to find the right words
to express my gratitude.
REFERENCES
Amor, N. B., Benferhat, S., and Elouedi, Z. (2008). Deci-
sion trees as possibilistic classifiers. In International
Journal of Approximate Reasoning.
Anuradha, K., Radha, N. T., and Kumar, T. P. (2012). A
decision tree algorithm for uncertain data. In Interna-
tional Journal of Engineering and Advanced Technol-
ogy.
Benz, U., Hofmann, P., Willhauck, G., Lingenfelder, I., and
Heynen, I. (2004). Multi-resolution, object-oriented
fuzzy analysis of remote sensing data for gis-ready in-
formation. In ISPRS Journal of Photogrammetry and
Remote Sensing.
Boulila, W., Farah, I., Ettabaa, K., Solaiman, B., and
Ghzala, H. B. (2010). Spatio-temporal modeling for
knowledge discovery in satellite image databases. In
Conference en Recherche d’Information et Applica-
tions.
Boulila, W., Farah, I., Ettabaa, K., Solaiman, B., and
Ghzala, H. B. (2011). A data mining based approach
to predict spatiotemporal changes in satellite images.
In International Journal of Applied Earth Observation
and Geoinformation.
Boulila, W., Farah, I., Ettabaa, K., Solaiman, B., and
Ghzala, H. B. (2012). Combining decision fusion and
uncertainty propagation to improve land cover change
prediction in satellite image databases. In Journal of
Multimedia Processing and Technologies.
Chang, P., Fan, C., and Dzan, W. (2010). A cbr-based fuzzy
decision tree approach for database classification. In
International Journal: Expert Systems with Applica-
tions.
Congalton, R. (1991). A review of assessing the accuracy
of classifications of remotely sensed data. In IEEE
Transactions on Systems, Man, and Cybernetics, Part
C: Applications and Reviews.
Elouedi, Z., Mellouli, K., and Smets, P. (2001). Belief de-
cision trees: Theoretical foundations. In International
Journal of Approximate Reasoning.
Fried, M., Brodley, C., and Strahler, A. (1999). Maximiz-
ing land cover classication accuracies produced by de-
cision trees at continental to global scales. In IEEE
Transactions on Geoscience and Remote Sensing.
Garey, M. and Johnson, D. (1979). Computers and in-
tractability: A guide to the theory of np-completeness.
In Printed in the United States of America.
Hullermeier, E. (2002). Possibilistic induction in decision-
tree learning. In ECML ’02 Proceedings of the 13th
European Conference on Machine Learning.
Jiang, L., Wang, W., Yang, X., and N. Xie, Y. C. (2011).
Classification methods of remote sensing image based
on decision tree technologies. In Computer and Com-
puting Technologies in Agriculture IV.
Kumar, U., Kerle, N., Punia, M., and Ramachandra, T.
(2011). Mining land cover infor-mation using mul-
tilayer perceptron and decision tree from modis data.
In Journal of the Indian Society of Remote Sensing.
Levashenko, V. and Zaitseva, E. (2012). Fuzzy decision
trees in medical decision making support system. In
Proceedings of the Federated Conference on Com-
puter Science and Information Systems.
McIver, D., Friedl, M., and Dzan, W. (2002). Using
prior probabilities in decision-tree classification of re-
motely sensed data. In Remote Sensing of Environ-
ment.
Mishra, P., Singh, D., and Yamaguchi, Y. (2011). Land
cover classification of palsar images by knowledge
based decision tree classifier and supervised classifiers
based on sar observables. In Progress In Electromag-
netics Research B.
Mitra, S., Konwar, K., and Pal, S. (2002). Fuzzy decision
tree, linguistic rules and fuzzy knowledge-based net-
work: generation and evaluation. In Remote Sensing
of Environment.
Neagoe, V., Neghina, M., and Datcu, M. (2011). Neural
network techniques for automated land-cover change
detection in multispectral satellite time series imagery.
In International Journal of Mathematical Models and
Methods in Applied Sciences.
Ozols, M., Mancinska, L., Berzina, I., Agadzanjans, R.,
and Rosmanis, A. (2006). Principles of optimal prob-
abilistic decision tree construction. In International
Conference on Foundations of Computer Science. Las
Vegas, Nevada, USA.
Panda, S., Garg, V., and Chaubey, I. (2004). artificial neural
networks application in lake water quality estimation
using satellite imagery. In Journal of Environmental
Informatics.
Pulvirenti, L., Pierdicca, N., and Marzano, F. (2011). Pre-
diction of the error induced by topography in satellite
microwave radiometric observations. In IEEE Trans-
actions on Geoscience and Remote Sensing.
Quinlan, J. (1986). Induction on decision trees. Machine
Learning.
AnApproachbasedonAdaptiveDecisionTreeforLandCoverChangePredictioninSatelliteImages
89

Quinlan, J. (1993). C4.5 : Programs for machine learning.
Morgan Kaufmann, San Mateo, ca edition.
Sawaitul, S., Wagh, K., and Chatur, P. (2012). Classifica-
tion and prediction of future weather by using back
propagation algorithm-an approach. In International
Journal of Emerging Technology and Advanced Engi-
neering.
Trabelsi, S., Elouedi, Z., and Mellouli, K. (2007). Pruning
belief decision tree methods in averaging and conjunc-
tive approaches. In International Journal of Approxi-
mate Reasoning.
Xuerong, L., Qianguo, X., and Lingyan, K. (2010). Re-
mote sensing image classification method based on
evidence theory and decision tree. In Proceedings
of the SPIE: Multispectral, Hyperspectral, and Ultra-
spectral Remote Sensing Technology, Techniques, and
Applications III.
KDIR2013-InternationalConferenceonKnowledgeDiscoveryandInformationRetrieval
90
