
Modelling SCADA and Corporate Network of a Medium Voltage
Power Grid under Cyber Attacks
E. Ciancamerla, M. Minichino and S. Palmieri
ENEA CR Casaccia, s.p. Anguillarese 301, Rome, Italy
Keywords: Critical Infrastructure Protection, Electrical Grid, SCADA, Cyber Attacks, Interdependency Analysis.
Abstract: There is an increasing concern over the cyber security of Critical Infrastructures (CI) due to the increasing
ability of cyber attackers to cause even catastrophic failures. It is mainly due to the pervasiveness of ICT
(Information and Communication Technologies) and to the consequent de isolation of SCADA
(Supervision, Control and Data Acquisition) system, which represents the nervous system of most CIs.
Cyber attacks could block the connection between SCADA Control Centre and its remote devices or insert
fake commands/measurements in the equipment communications. With reference to an actual case study,
constituted by a SCADA system controlling a portion of a medium voltage power grid and a corporate
network, we discuss how cyber threats, vulnerabilities and attacks might degrade the functionalities of
SCADA and corporate network, which, in turn, might lead to outages of the electrical grid. We represent
SCADA and corporate network under malware propagation, Denial of Service and Man In The Middle
attacks and predict their consequent performance degradation. Particularly, we use NetLogo to identify
possible malware propagation in relation to SCADA & corporate security policies adopted from the utility
and NS2 simulator to compute the consequences of the attacks on SCADA and in turn on power grid.
1 INTRODUCTION
SCADA (Supervisory Control And Data
Acquisition) encompasses systems that monitor and
control industrial infrastructure or facility-based
processes, such as utility operations on Power grids.
Successful cyber attacks against SCADA systems
might put industrial production, environment
integrity and human safety at risk (Stamp, 2003),
(Shaw, 2004). SCADA systems include simple
functions such as “on/off,” sensor capability,
communications capability and human-machine
interface (HMI) that connects them to people
operating the system. SCADA more and more often
have connections to Internet Protocol (IP) networks,
including the internet in some cases. Even those
physically and logically disconnected from other
systems may be locally or remotely accessible and
have vulnerabilities to be exploited. SCADA access
and control points are also frequently located in
remote and unmanned areas of the utility system
(NARUC, 2012). Since SCADA systems directly
control physical systems, availability and reliability
come first, whereas in ICT networks a significant
stress is on confidentiality of information. Protection
in industrial control networks must be achieved in
resource constrained environment, in which channel
bandwidth is very narrow and devices have a limited
computational power, whereas in contrast timeliness
of response is fundamental. Since resources are
bounded and at the same time delays are
unacceptable, many security measures that work
well in ICT networks could not be used as is in
SCADA networks. Additional programs like anti
viruses risk slowing down systems excessively
(Kim, 2012). Cryptography, especially public-key
(Fuloria, 2010), could be too heavy, both
computationally and because of the traffic it creates
(AGA, 2006), if it is applied to SCADA legacy
components or to SCADA remote devices which
typically have limited computational power. In fact
SCADA, being born as isolated systems, carry the
burden of a legacy of trust in the network and thus
they lack the tools for monitoring and self-protection
that have long been integrated in ICT networks. For
instance, their logging capabilities are geared
towards disturbances rather than security attacks
(Ahmed, 2012). Contrary to ICT network devices,
SCADA systems are designed to run for years on
end (Byres, 2006) without a reboot. This
123
Ciancamerla E., Minichino M. and Palmieri S..
Modelling SCADA and Corporate Network of a Medium Voltage Power Grid under Cyber Attacks.
DOI: 10.5220/0004523501230134
In Proceedings of the 10th International Conference on Security and Cryptography (SECRYPT-2013), pages 123-134
ISBN: 978-989-8565-73-0
Copyright
c
2013 SCITEPRESS (Science and Technology Publications, Lda.)
complicates the application of software patches and
makes even forensics after an attack problematic
because the system cannot be taken down and
analyzed at wish (Ahmed, 2012).
In this work, we consider an actual reference
scenario identified with the expertise of Israelian
Electric Corporation (IEC) within MICIE EU project
(http://www.micie.eu) first and then extended within
the ongoing CockpitCI (http://www.cockpitci.eu)
EU project. Reference scenario is composed by a
SCADA system, its medium voltage power grid and
a portion of a corporate network, which are
interdependent System of Systems and they act as a
whole. Within such a reference scenario, SCADA
operator executes a procedure, named FISR (Fault
Isolation and System Restoration), to locate, isolate
and reconfigure quickly and safely the power grid on
permanent electrical failures. In power grids,
permanent failures may cause the de-energisation
even of large part of power customers. We discuss
how cyber threats, vulnerabilities and attacks might
result in loss of view and loss of control of the
electrical grid from SCADA Control Centre and
then, as a consequence, in a de-energisation of
power grid customers. We represent SCADA and
corporate network under malware propagation,
Denial of Service (DoS) and Man In The Middle
(MITM) attacks. We use NetLogo
(http://ccl.northwestern.edu/netlogo/) to model and
analyse malware propagation in relation to the
adopted SCADA & corporate network security
policies and NS2 (http://www.isi.edu/nsnam/ns/) to
compute the consequences of the attacks on SCADA
performances and in turn on power grid
functionalities.
This work, with respect to the state of the art, has
two main novelties: a) the representation of different
types of cyber attacks and their propagation on an
actual SCADA & corporate network; b) modelling
process of cyber attacks and their impact on
technological networks is supported by two
heterogeneous tools: NetLogo focused on malware
propagation and NS2 which computes the impact of
cyber attacks on quality of service of SCADA and
its electrical grid.
2 REFERENCE SCENARIO
A reference scenario is needed to limit the extension
of the real world to be included into the models and
to provide a concrete context of operation.
Reference scenario is composed by an actual
SCADA system (based on Wizcon software and
Motorola technology), a 22KV medium voltage
electrical grid (one out of five electrical districts of
Israel) operated by IEC and a portion of IEC
corporate network, which act as a whole.
Topologies, main functionalities, main devices, main
communications among devices of such System of
Systems, including communication protocols, with
special attention on TCP/IP based protocols,
interdependencies, cyber security issues, such as
cyber threats, vulnerabilities, pre-existent cyber
security policies & technical solutions and attack
cases, are described within reference scenario
(http://www.cockpitci.eu).
2.1 MV Electrical Grid
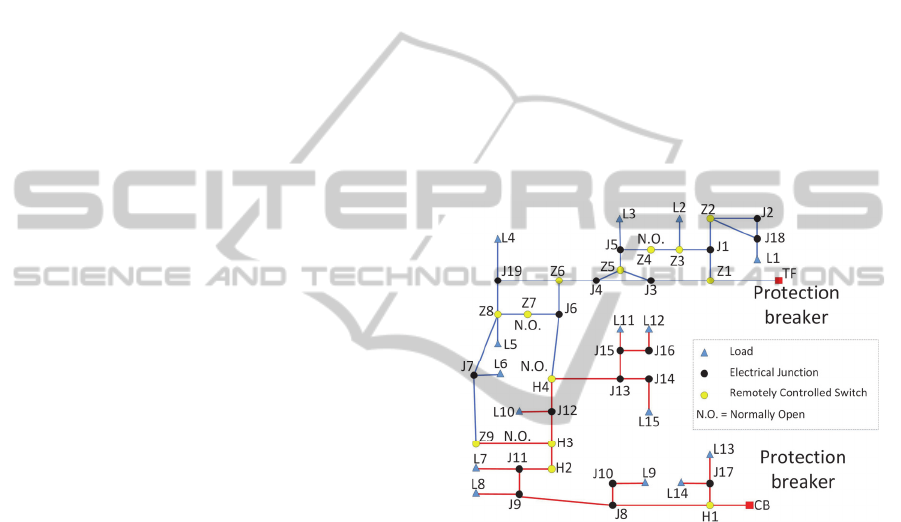
Figure 1 shows the portion of the medium voltage
power grid controlled by SCADA.
Figure 1: MV power grid.
It consists of a portion of a medium voltage
(MV) grid at 22 KV, energized by two substations,
named TF and CB. Each substation feeds different
types of loads/customers (public, commercial,
industrial), throughout electrical sections, connected
one each other by Normally Close Circuit breakers.
TF and CB substations include Protection breakers.
In normal operative conditions, customers are
energized by either TF substation or CB substation,
by means of two sub grids, separated one each other
by two, Normally Open, Tie switches. Tie switches
and Circuit breakers are remotely controlled by
SCADA. SCADA, by means of its Remote Terminal
Units (RTU) which monitor the grid status, acts on
Circuit breakers to connect or isolate grid electrical
sections, and on Tie switches position to feed a
subgrid by the alternate substation in case of
reconfiguration of power grid on permanent
electrical failure in the subgrid.
SECRYPT2013-InternationalConferenceonSecurityandCryptography
124

2.2 SCADA System
Figure 2 includes the picture of SCADA system.
From Wizcon SCADA Control Centre (SCC), the
operator remotely controls in real-time the electrical
grid of figure 1, by means of RTUs.
Particularly, the following devices belong to the
SCADA system:
– MCPT G.W gateway which converts a
proprietary Data Link Communication (DLC)
protocol to the TCP/IP protocol. DLC protocol is
designed for radio channels and allows multiple
logical communication channels per
communication medium. For DLC and TCP/IP
protocols, every transmission is automatically
accompanied by an ACK message, ensuring the
integrity of the transmission.
– Field Interface Unit (FIU MOSCAD), dedicated
to RTU interrogation and routing of data
messages to/from SCC. FIU MOSCAD
comprises a Radio Frequency (RF) Modem
Interface (RF Modem ND), that includes two
VHF radio units (F2, F3), that connect RTUs to
SCC throughout either F2 or F3 channel.
– Store & Forward (S&F) Repeater MOSCAD DN
which communicates upwards with the SCC (via
the RF Modem and FIU) and downwards with
the RTUs using the two RF channels (F1 and
F3).
– RTUs; there are 13 RTUs sites, of which 9
belong to Hanita (TF in figure 1) and 4 to Zuriel
(CB in figure 1).
SCADA system is fully redundant. In case of failure
of the main SCADA unit, the backup SCADA unit is
enabled.
The main communication path between SCC and
the RTUs traverses the main Gateway (MCPT G.W
PRIME) and the main FIU (MOSCAD ND). In case
of failure on the main path, data are rerouted on the
backup path that traverses the backup Gateway
(MCPT G.W SECOND), the backup FIU
(MOSCAD DN), the corporate network (from Point
of Presence ND to Local eXchange DN-VHF),
MOSCAD DN S&F Repeater and then reaches the
RTUs. In case the primary RF channel is not
available for any reason, the system switches to the
alternate RF channel.
2.3 Corporate Network
The portion of corporate network of reference
scenario is also shown in figure 2. It is composed by
three hierarchical layers.
– A Backbone layer, where Point of Presence
(PoP) devices are connected one each other in a
meshed topology (NA, NM and ND devices in
figure 2). Its application is transport, so its
primary concern is capacity. PoP is a
multiservice optical platform that integrates
several technologies including Synchronous
Digital Hierarchy, Synchronous Optical Network
(SDH/SONET) and Dense Wavelength Division
Multiplexing (DWDM) in a single platform.
– A Local eXchange layer (LeX) , the closest one
to customers at the edge of the Transit eXchange
layer, represents the point of access at lower
bandwidth of corporate network. In this layer, IP
traffic, with its inherently bursty, asymmetric,
and unpredictable nature, is predominant,
especially with real-time applications. In figure
2, the following LeX devices: CB, ML, TF, MT,
BL, DN-VHF.
– Between these two layers, lies the Transit
eXchange layer (TeX) that grants scalable traffic
in multi-ring topology. A TeX device is based on
SDH/SONET technology that aggregates data
flows at different bit rate and re transmit them
over long distances. It relies on optical rings
constituted by ADM (Add Drop Multiplexer) and
optical cables. ADMs perform signal
multiplation (they gather many tributary signals
and multiplex them into one signal at higher
rate), transmission over optical fibers and
protection (by rerouting over the SDH ring in
case of a single failure). In figure 2, the
following TeX devices: CR, CR area center, NA
area center.
3 SCADA CYBER SECURITY
Cyber vulnerabilities and attack vectors of SCADA
challenge, day by day, the reliability, resiliency and
safety of the electric grid. For such a reason, a cyber
security protection of SCADA & corporate network
cannot be neglected by electrical grid utilities.
3.1 Vulnerability and Attack Vectors
Vulnerabilities involve computer, communication
(SCADA & corporate networks) and in turn
electrical grids. Attacks can be targeted at specific
systems, subsystems, and multiple locations
simultaneously. Attacks can come from many
places, including indirectly through corporate
network. Possible vulnerabilities and attack vectors
ModellingSCADAandCorporateNetworkofaMediumVoltagePowerGridunderCyberAttacks
125
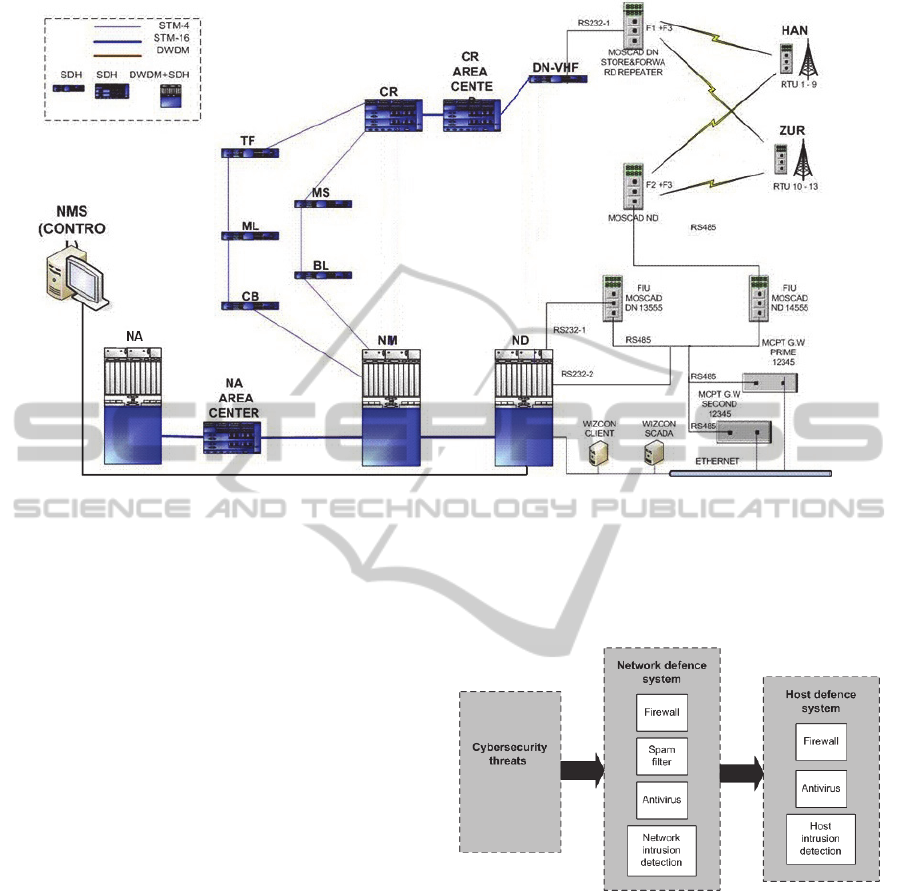
Figure 2: SCADA system and a portion of corporate network.
include backdoors and holes in network perimeter,
protocol vulnerabilities, database attacks,
communication hijacking / MITM / DoS attacks. As
deterrent for attackers, security policies are adopted
such as system hardening and intrusion detection
systems.
Once a vulnerability has been exploited specific
adverse actions can performed:
Denial of Service. Since the adversary has
already penetrated the SCADA network, DoS
implies DoS on an individual machine/device, a
group of devices or an entire sub network, inside
a SCADA network. DoS attacks are considered
the easiest type of attack to launch.
Addition of software infected with malware
which will disrupt the performance of the
network and/or the machines on the network.
Changes to the software or modifications to the
configuration settings (some reverse engineering
may be needed).
Spoofing system operators and/or devices on the
control network. This is the most difficult action
to execute but would provide the adversary with
the most capabilities.
Changes to instructions, commands (same
difficulty as above): Protocol manipulation,
vulnerability exploitation and MITM attacks are
among the most popular ways to manipulate
insecure protocols, such as those found in control
systems.
3.2 Cyber Security Protection
Fig. 3 illustrates a typical cyber security protection
system (Dua, 2011).
Figure 3: A typical cyber security protection system.
The system protects the cyber-infrastructure and
combats threats at two levels: 1) at network level:
“network based defence systems” and 2) at host
level: “host based defence systems”. Network based
defence systems control the network traffic by
network firewall, antivirus, spam filters and network
intrusion detection techniques, where as the host
based defence systems control the data flow in a
workstation by host firewall, antivirus and host
intrusion detection techniques.
Numerous intrusion detection mechanisms are
employed to investigate the behaviour of the cyber-
infrastructure by analysing the input data. This is
SECRYPT2013-InternationalConferenceonSecurityandCryptography
126

considered as the principal component of the
intrusion detection system.
So a cyber-attack with a certain probability can
be identified by cyber security protection systems
and then, after a threat assessment, can be deployed
and a decision can be taken accordingly.
4 MODELS
We represent SCADA & corporate network under
the occurrence of three different kinds of cyber
attacks:
1. Malware injected in a specific device of
corporate network, which spreads throughout
corporate network and SCADA devices up to
disconnect the communication between SCADA
Control Centre and its RTUs and results in a
degradation of the quality of electrical power to
grid customers.
2. DoS attacks, in which a malicious agent exploits
the weakness of network protocols to flood a
specific SCADA & corporate network device,
with the aim to saturate the bandwidth of the
carrier used for the communication among
SCADA Control Center and its RTUs.
3. MITM attacks, where an attacker intercepts the
traffic between two SCADA/corporate network
devices and then injects new
commands/information that override the original
ones.
4.1 Malware Propagation
Malware injection model is based on SIR
(Susceptible, Infected, Resistant) mathematical
formalism, for disease spread over individuals
(Tassier, 2005). Each individual could be in one of
the three states: Susceptible, Infected or Resistant.
There isn’t the possibility that an individual could
belong to more than one of the states. The passage
between each state is governed by several variables.
In our work, to represent SCADA and corporate
network we got a SIR net, described by a graph. We
said that each device is a node, and there is an arc if
two nodes can communicate each other (the arcs are
symmetric). The virus infection of the original SIR
formalism, in our case is the malware. A node can
move from S , the susceptible group, to I , the
infected group, when it comes in contact with an
infected node. What qualifies a contact depends on
the virus. Each infected node contacts the neighbour
nodes in each step of time. Each contact may not
result in transmission of the virus, only a percent of
the contacts result in transmission.
For each j node (j=1,…,N) , we define dj as the
number of the neighbours of the node j of which the
fraction α may result infected; so, we assume that
the virus spread itself, every step of time, on a
fraction βj = α • dj of nodes. We justify such an
assumption thinking to deal with a stealth virus. A
stealth virus doesn’t infect too much nodes every
time, because otherwise, it could be more easily
detected for instance looking at the increased traffic
value. Moreover, we assume that each node has
different probability to contract the virus: γj . The
virus doesn’t disappear after a certain period of time,
but just after periodically running the antivirus or
after maintenance operation, kj is the rate of the
antivirus scan. Depending on the virus, there is the
possibility that the antivirus can find it and know
how to remove it, φj is that probability.
At each point of time, we have three groups of
nodes and a specific numbers of nodes in a group.
Particularly, St, It and Rt are, respectively, the
number of susceptible, infected and recovered nodes
in the network at time t. Given N , the network size,
correspondingly, we define the three groups as
fractions of the total population N in lower case:
st = St/N (the susceptible fraction of the nodes of
the network at time t)
it = It/N (the infected fraction of the nodes of the
network at time t)
rt = Rt/N (the recovered fraction of the nodes of
the network at time t)
Each node is in one of the three groups. Thus:
St + It + Rt = N (1)
and
st + it + rt = 1 (2)
At the time t + 1:
S(t+1)= S(t) – s • β • γ • I(t) (3)
R(t+1)= R(t) + k • φ • I(t) (4)
I(t+1)= I(t)+ s • β • γ • I(t) - k • φ • I(t) (5)
We have used NetLogo to create SCADA &
corporate network model, to set SIR variables and to
represent the occurrence of a cyber attack on a
corporate network device (Network Management
System). NetLogo is an agent-based modelling tool
for simulating natural and social phenomena. It is
particularly well suited for modelling complex
systems developing over time. In our model,
malware spreads throughout the corporate network
ModellingSCADAandCorporateNetworkofaMediumVoltagePowerGridunderCyberAttacks
127
and SCADA devices up to disconnect the
communication between SCADA Control Centre
and RTUs. We assume that the security polices of
SCADA and corporate network are dependent upon
the criticality of their devices. The rationale is that
the corporate network devices with a larger
bandwidth will be more protected and thus more
expensive to be destroyed from an attacker. SCADA
devices are not as critical as the ICT devices of
corporate network. Thus, the latter will be more
protected than the former. Accordingly, attacking
the latter kind of nodes will be more expensive than
attacking other less important (and thus less
protected) nodes. On the other side, corporate
network devices are more vulnerable than SCADA
devices because corporate network devices are more
“public”. The antivirus policy on corporate network
devices is more efficient that the antivirus policy on
SCADA devices. Within corporate network, the
antivirus policy of Point of Presence devices is more
efficient than the antivirus policy of Transmission
Exchange devices, in turn more efficient than
antivirus policy of Local Exchange devices. Within
SCADA system, the computers of SCADA Control
Centre are more protected than the other SCADA
devices.
In SIR model of SCADA and corporate network
of figure 2, we use the following variables:
Alfa: it is a measure of how much neighbours the
virus sends the infection. Its range is [0, 100] %.
Antivir-check: it indicates how many time units
occur to perform an antivirus check (or everything
that can help to find a malware). Its range is [1, 365]
days.
Virus-spread-timer: the virus (malware) can spread
itself along the network at various rates. We assume
that an infected node may infect just a fraction of its
neighbours (an exception is the Wizcon Ethernet bus
of figure 2, that just transmits the infection). Its
range is [1, 365] days.
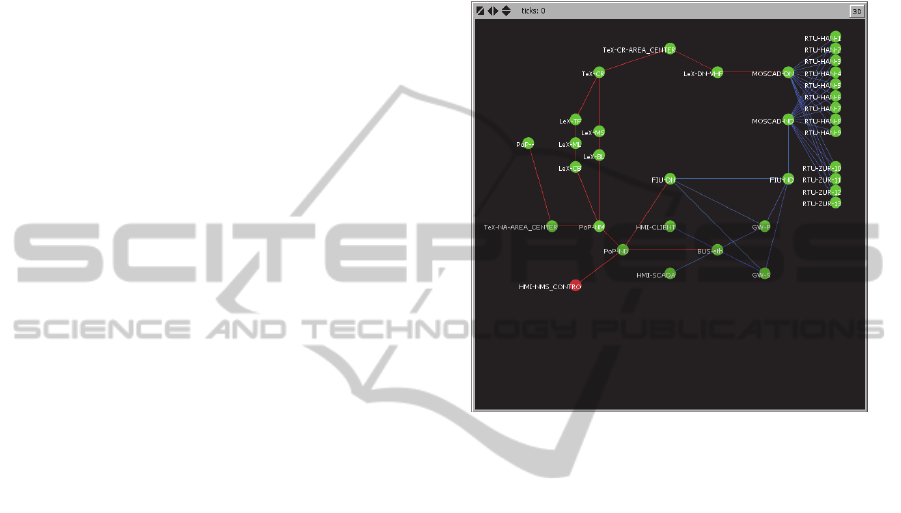
Figure 4 shows the screenshot, at time t = 0 , of SIR
model of SCADA and corporate network of figure 2.
The infection starts on Network Management
System device of the corporate network (figure 2),
named HMI-NMS_CONTRO in figure 4.
Along the infection spreading, each node of SIR
model can be in one of the three states:
Susceptible (S): the node is healthy (in green
colour) and it can be infected by a malware;
Infected (I): the node is infected (in red colour):
at some rate it can infect neighbour nodes;
Recovered (R): the antivirus scan got success in
removing the infection (in gray colour).
The links among corporate network nodes are
depicted in red colour while the links among
SCADA nodes are depicted in blue colour. Ticks, up
on the left of figure 4, shows the simulation time.
An other output of the simulation (not included
in figure 4) is the percentage of nodes in the
different states.
Figure 4: The infection starts on NMS device of corporate
network.
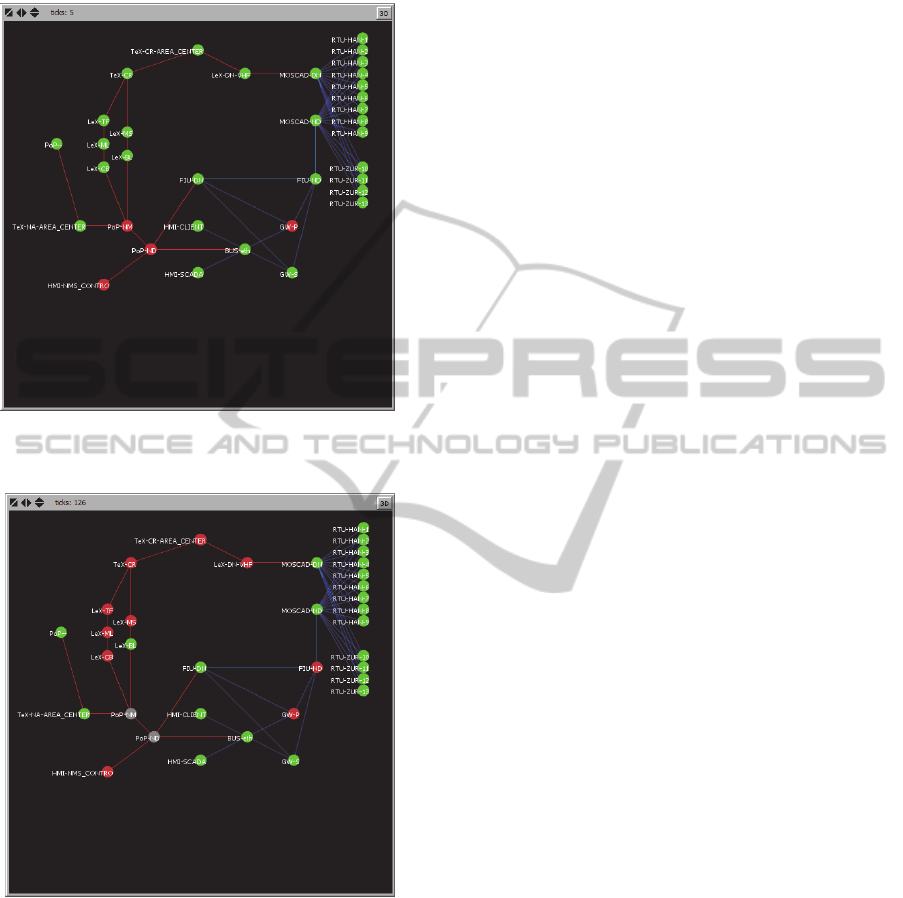
According to the modelling assumptions on the
infection spreading, the virus propagates throughout
PoP-ND and PoP-NM devices (respectively at time
step=1 and at time step=2) and in turn on the GW-P
device (at time step =4) of the primary SCADA
Control Centre-RTUs connection, figure 5.
The virus does not spread throughout the
redundant computers of SCADA Control Centre due
to their strict cyber security policy. Then the virus
spreads on LeX-CB and FIU-ND (time step= 5). The
infection of FIU-ND node gets out of service the
primary connection between SCADA Control Centre
and Remote Terminal Units. The strict antivirus
policy on the PoPs of the ICT network discovers and
cleans the malware (time step=11 and 22
respectively) on PoP-NM and PoP-ND respectively.
At such a stage, the SCADA operator, has still a full
observability and operability of the electrical grid of
figure 1, by means of the secondary communication
between SCADA Control Centre and RTUs.
At the time step = 52, the virus also infects TeX-
CR node. At this stage (Figure 6), SCADA operator
completely looses the observability and operability
of the electrical grid of figure 1. If a permanent
electrical failure occurs on the grid, SCADA
SECRYPT2013-InternationalConferenceonSecurityandCryptography
128
operator cannot act remotely the Fault Isolation and
System Restoration Service.
Figure 5: The infection spreads on corporate network and
SCADA devices.
Figure 6: SCADA operator looses grid Observability.
More details of SIR model of SCADA &
corporate network are in (Ciancamerla, 2012).
4.2 DoS and MITM Attacks
DoS and MITM attacks are specified in terms of
attack parameters, attack initiation sources, attack
targets. Particularly, attack initiation sources fully
cover SCADA & corporate devices and even
external devices connected by means of internet.
Attack targets have been chosen to cause a
maximum number of damaged SCADA devices as a
consequence of a successful attack on a single
device.
Different indicators of expected consequences of
a DoS or MITM attack are under consideration. Any
attack may result in loss of view and loss of control
of RTUs (and thus of the electrical grid) from
SCADA Control Center. In our models we measure
the following numeric indicators of SCADA
performances on attack occurrence:
LoV, Loss of View, if the SCADA Control
Center can't receive packets from the RTUs;
LoC, Loss of Control, if the RTUs can't receive
packets from the SCADA Control Center;
DPR (Dropped Packets Rate), a global vision of
how many packets are missing on the network;
TTBP, Transmission Time Between two Packets;
RTT, Packet Round Trip Time, composed by
TCP transmission time plus ACK transmission
time;
Packets Routing.
SCADA performances have been analysed along
four different phases around the attack:
1. Nominal conditions, before the attack;
2. Anomalous conditions, during the attack;
3. Tail of anomalous conditions, after the attack;
4. Return to nominal conditions, as before the
attack.
In our models, DoS and MITM attacks occur after
the outage of the primary path between SCC and
RTUs.
4.2.1 DoS Attacks
DoS attacks have been performed with the aim to
saturate the bandwidth of the carrier used for the
communication between SCC and its RTU.
The MOSCAD front end of figure 2 has been
chosen, as attack target, according to the criteria of
causing a maximum number of damaged SCADA
devices as a consequence of a successful attack. In
fact, MOSCAD front end outage has immediate
consequences on the Loss of Control and on the
Loss of View of all the RTUs. Particularly,
MOSCAD-DN has been chosen, as attack target,
when the attack come from the corporate network
and the SCADA is working on the alternate path
(otherwise the attack has no effects) and MOSCAD-
ND when the attack come from an external devices
connected to SCADA by means of Internet.
Four different attack initiation sources, named
ModellingSCADAandCorporateNetworkofaMediumVoltagePowerGridunderCyberAttacks
129

attack cases, have been chosen:
1. DoS attack from the TeX-CR;
2. DoS attack from the LeX-BL;
3. DoS attack from the PoP;
4. DoS attack from an external source.
The main parameters of the DoS attacks have been
specified in terms of packet size, interval between
packet transmission, number of packets sent during
the attack, the protocol of the flood attack. Table 1
shows the value of such parameters for all the DoS
attack cases.
Table 1: DoS attack parameters.
Packet size 10 B
Interval 10 µs
N. of packets sent during the attack 4 600 000 000
Flood attack protocol UDP protocol with CBR
4.2.2 MITM Attacks
The main characteristics of the MITM attacks are as
following:
the attacker intercepts the traffic;
once the traffic is intercepted, the attacker injects
new commands/information that override the
original ones. The injection occurs by means of
packets between the SCADA Control Center and
the RTU victim, with the same format of the
normal SCADA packets, but with an higher
frequency. The rationale is that a higher
frequency of MITM packets facilitates the
override of normal SCADA packets;
the attacker doesn't modify the payload of
normal SCADA packets;
the attacker connects to SCADA devices or
corporate network devices through a Ethernet
cable at the same speed of the Ethernet of the
reference scenario;
when the attacker intercepts the VHF
communication, (s)he uses a VHF antenna, the
propagation time between MOSCAD and MITM
and from MITM and RTU is halved.
Also here, MOSCAD front end of figure 2 has been
chosen, as attack target. Particularly, MOSCAD-DN
when the attack come from corporate network and
SCADA is working on the alternate path (otherwise
the attack has no effects); MOSCAD-ND when the
attack come from an external devices connected to
SCADA system by means of Internet.
The following sources of MITM attacks have
been chosen:
6. Between TeX-CR and TeX-CR Area Center
7. Between Ethernet bus and the two gateways, in
the SCADA Control Center
8. Between MOSCAD-DN and RTU
9. Throughout Internet (e.g. via VPN)
To evaluate attack consequences on SCADA
performances, we have considered the following
numeric indicators of MITM attack:
LoV, SCADA Control Center receives false
information/data from MITM attacker. The
consequent false observability of Power grid
from SCADA Control Center may induce a triki
behaviour of SCADA operator.
LoC, the RTU receives false commands from
MITM attacker instead of SCADA Control
Center.
Change of Packets routing
It has been also expected a light variation of :
TTBP
RTT
5 SIMULATION RESULTS
To compute SCADA performances and in turn the
quality of electrical power to customers, as
consequences of each cyber attack, we have used
NS2 simulator to build, run and predict related
indicators under attacks. NS2 is one of the most
widely used open source network simulators; it is
driven by discrete events and allows to simulate
packet based local/wide area networks and
wired/wireless networks as well.
The NS2 model of SCADA & corporate network
under the above cyber attacks, has been
implemented according to the schema of figure 2
and cyber attacks as specified above.
Communications between SCC and its RTUs have
been implemented with reference to (IEC 60870-5),
as well as the packet traffic on the network. IEC
60870-5 is a standard developed in a hierarchical
manner and published in a number of sub-paths
which completely define an open protocol for
SCADA communications. The protocol is defined in
terms of the Open Systems Interconnection (OSI)
model, using a minimum sub-set of the layers:
physical, data link, and application layers. Detailed
definition of message structure at the data link level,
and a set of application level data structures are
included to develop interoperable systems.
SECRYPT2013-InternationalConferenceonSecurityandCryptography
130
5.1 Impact of Cyber Attacks on
SCADA Performances
Table 2 summarizes the main parameters of DoS
attacks on SCADA system and their impact on
SCADA performances. Particularly, the first four
lines specify the attack parameters: source,
destination, start and end time of the attack.
Table 2: Simulated DoS attacks on SCADA system.
Attack
source
PoP TeX-CR LeX-BL Internet
Attack target MoscadDN MoscadDN MoscadDN MoscadND
Start time
[sec]
55 55 55 55
Stop time
[sec]
101 101 101 101
LoV NA NA NA 0/17
LoC 57/57 57/57 57/57 59/76
RTT
Max/Min
[sec]
Inf / inf Inf / inf Inf / inf Inf/ 1792
DPR 57/57 57/57 57/57 59/93
Simulat.
time [sec]
200 200 200 200
Comput.
time [min]
21 15 17 15
Figure 7: Arrival times (TCP, ACK and RTT) of SCADA
packets to RTU-1 when a DoS attack comes from LeX-
BL.
The following four lines report the consequences
of the attacks, as measured by the NS2 model: Loss
of View (LoV), Loss of Control (LoC), maximum
and minimum values of the Round Trip Time (RTT)
during the attack, missing packets (DPR). Also,
simulation time and computation time are reported
in the last two lines. Computation time grows up
from 15 minutes to 21 minutes. That is due to the
variation of attack source; the more hops a
communication involves, the longer is the needed
time to complete the communication between
devices; also, if the packets are dropped near the
source of the attack, such packets no longer need to
be transmitted.
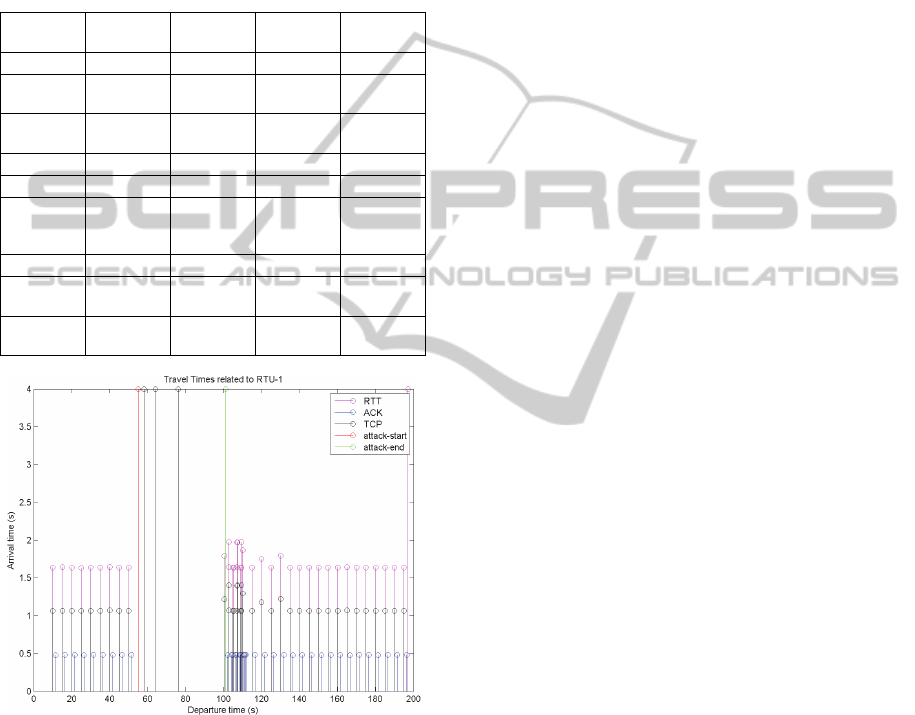
Figure 7 shows, as an example, the “travel times”
of SCADA packets to the RTU-1, under the four
phases of a DoS attack coming from LeX-BL.
The messages exchanged between SCADA
Control Center and RTU-1 are distinguished by
colour. Particularly, black represents commands
from SCC to RTU-1; blue: ACK from the RTU-1 to
the SCC; red: the start time of the flood attack (55
s); green: the end time of the flood attack (101 s);
magenta: RTT of the exchanged packets. In figure,
the arrival times of packets which take an infinite
time to arrive to destination are shown with a
saturated arrival time of 4 sec that is the upper
border of the figure.
In figure, the four attack phases can be
distinguished:
1. Before the attack: SCADA packets flow from
SCC to RTU-1 and came back normally. RTT,
TCP and ACK travel times are regular.
2. During the attack: the flood starts to increase the
occupancy of all the buffers of the devices
flooded by the attack, up to saturate them (buffer
size: 10 packets). The timeliness of SCADA
packets which traverse such devices to reach
RTU-1 increases. The travel time of the ACK
does not change because the links are full-duplex
and the attack floods in the opposite direction.
When a packet is dropped, TCP message interval
time increases (more or less twice the nominal
value), increasing in turn the RTT.
3. Soon after the attack: there is a tail. SCADA
messages go in de-synchronization. That is due
to the fact that the saturated buffer is emptied at a
rate that is different from the nominal packet
transmission rate; along the tail, packets are
transmitted at lower intervals than the nominal
ones. Lower intervals depend upon several
reasons including the elaboration time of each
device. The arrival time to destination is
unpredictable due to the fact that the buffer
devices start to empty and there some flood
packets that have still to be sent.
4. Return to nominal conditions: flood problems
end and the operative conditions come back to
nominal ones.
Table 3 shows, as an example, the computational
time and all the traversed devices in communication
between SCC and RTU-2, along the four phases of a
ModellingSCADAandCorporateNetworkofaMediumVoltagePowerGridunderCyberAttacks
131

MITM attack , which occurs between MOSCAD-
ND and RTU-2. For each row of the table, the first
bullet shows the route taken by SCADA packets
from SCC (n. 27) to RTU-2 (n. 5); the second bullet
shows the opposite route from RTU-2 to SCC. The
MITM node (n. 38) is highlighted by the bold and
underlined font.
Table 3: MITM attack between MOSCAD-ND and RTU-
2.
Computational time: 4 sec
Traversed devices before the
attack
27 34 29 1 3 5
5 3 1 29 34 27
Traversed devices during the
attack
27 34 29 1 3 38 5
5 38 3 1 29 34 27
Traversed devices after the
attack
27 34 29 1 3 5
5 3 1 29 34 27
The relationship between numbers and devices of
the SCADA and corporate network of table 3 is
shown in table 4, where MITM node (n.38) is not
included.
Table 4: relationship between numbers and devices of the
SCADA and corporate network involved in MITM attack.
Device Number
FIU-ND 1
MOSCAD-ND 3
RTU-HAN-2 5
WIZCON SCADA 27
GATEWAY PRIME 29
BUS Ethernet 34
These very simple results show that in case of
MITM occurrence in the network is the change of
packets routing.
Figure 8 shows the arrival times (TCP, ACK and
RTT) of the communication from SCC to RTU-2
under a MITM attack which occurs between TeX-
CR-AREA-Center and TeX-CR. The attacker enters
in the network with a cable with higher delay values
(the ones of Ethernet cable) then the delay values of
optical fiber links. That causes a sensible delay that
is measurable by means of an average increased
value of RTT along the attack. Near the start of the
attack, there is a major increasing of RTTs, that is a
consequence of NS-2's TCP protocol version. In
fact, because of TCP protocol, SCC waits for the
ACK for a certain time: the one computed according
to the previous communications. If the ACK is not
received, and it is the case, SCC resends a packet
with the same identifier assuming that the previous
packet has been lost. Instead, the first packet has not
been lost but just delayed for the presence of the
MITM node, which after a while send the first
packet to RTU-2. As a consequence RTU-2 receives
two TCP packets with the same identifier and
consequently transmits two ACK towards SCC with
the same identifier. When ACK are received, the
protocol tunes the ACK waiting time to a new value.
Figure 8: Arrival times (TCP, ACK and RTT) from SCC
to RTU-2 under a MITM attack.
Some differences between DoS and MITM
attacks related to LoC & LoV indicators, the
presence of the attack tail after the end of the attack;
packets route modification; packets transmission
time/frequency variation along attack phases and its
end, have been observed:
a) In case of DoS it is relevant the LoC or the LoV
dependently on the flow direction of the attack;
in MITM there are no evidence of LoC or LoV.
b) In case of DoS there is a tail, its length depends
on the scheduling; in case of MITM there is no
tail.
c) In DoS seems that there is no route modification,
if there is, it has no effect; in MITM there is a
Packets routing modification. The modification
of the route contains the position of the MITM
attacker that is a new node respect to the set of
nodes that constitute SCADA plus corporate
network devices.
d) In DoS there is packets transmission
time/frequency variation due to the congestion
and the consequent activation of the AIMD
mechanism. AIMD (Additive
Increase/Multiplicative Decrease) algorithm is a
feedback control algorithm for TCP Congestion
Avoidance. AIMD combines linear growth of the
congestion window with an exponential
reduction when a congestion takes place.
SECRYPT2013-InternationalConferenceonSecurityandCryptography
132

5.2 Impact of Cyber Attacks on
Electrical Grid Customers
Degradation of performance of SCADA have been
analysed on the occurrence of Malware propagation,
DoS and MITM attacks till up to result in Loss of
View and the Loss of Control of the electrical grid
from SCC. In a situation in which a permanent
electrical failure of the power grid occurs and
SCADA operator cannot act remotely or can act
with delay as a consequences of any of the above
cyber attacks, a large portion of power grid
customers can be de-energized. Particularly, we
have also computed the degradation of FISR
response time, along the different stages of the
infection spreading, on MITM and DoS attacks by
means of NS2 simulator. We also computed the
percentage of grid customers which remain isolated
from the feeding substation (affected customers).
The percentage is computed respect to the total
number of the customers of the grid.
Table 5 summarizes the values of FISR response
time and the percentage of affected power grid
customers. Three different operative conditions
(cases) of SCADA & corporate network have been
considered:
case 1) nominal conditions of the SCADA &
corporate network under initial infection spreading;
case 2) the outage of the primary path between
SCC and RTUs;
case 3) On outage of the primary path between
SCC and RTUs, a successful cyber attack (Malware
or DoS or MITM) gets out of service the back up
connection between SCC and RTUs; in such a case
the operator looses the grid observability and
controllability.
Three different locations of the permanent electrical
failure on the grid have been assumed:
i) Failure in an Initial Section of the Grid (bounded
by the feeding substation and its closest RTU):
the loads of failed sub-grid are energized by the
other substation, up to the manual repair, that
restores the initial configuration of the grid;
ii) Failure in an Intermediate secTion of the Grid
(bounded by two RTUs): the loads into this
section are isolated, the loads bounded by failed
the section and the tie switch are powered by the
other substation, up to the manual repair, that
restores the initial configuration of the grid;
iii) Failure in a Terminal Section of the Grid
(bounded by RTU and loads): the loads of failed
section are isolated, up to the manual repair, that
restores the initial configuration of the grid.
Table 5: FISR response time and % of affected customers.
Failure section Initial Intermediate Terminal
Response
time [sec]
case 1 18.4 34.8 29.1
case 2 18.6 35.2 29.4
case 3 >simul. time > simul. time
>simul.
time
affected
customers
[%]
Before FISR 46.6 26.6 26.6
after FISR 0 0 6.6
The first row of the table reports the location of
the permanent failure that requires the activation of
FISR. Row 2 reports FISR response time in [sec]
distinguished in case 1, case 2 and case 3. In case 3,
SCADA operator completely looses the
observability an/or controllability of the power grid.
The percentage of the affected customers depends
upon the section of the grid in which the failure is
located. Failures in the initial section of the grid
affect a higher percentage of customers. In case of a
failure of the terminal section of the grid, there is a
percentage of customers out of power service till the
manual repair of the failure of the grid has been
completed. The outage duration of the affected
customers, in case 1 and 2, corresponds to the FISR
response time plus the manual repair time, when
needed. Manual repair time is needed in case of
failure in a terminal section of the grid. In case 3,
FISR cannot be actuated remotely by SCC and the
outage duration corresponds to the manual repair of
the permanent failure of the grid.
6 TOWARDS A SCADA
SECURITY TESTBED
Due to the difficulty of performing cyber security
tests on existing SCADA systems (Queiroz, 2009),
research on SCADA security employs hybrid
testbeds to implement specific scenarios that
integrate a set of commercial software used in real
SCADA systems, models of SCADA & corporate
networks devices and actual devices (e.g., PLCs,
routers) on which perform actual cyber attacks. In
this framework, CockpitCI EU project
(www.cockpitci.eu) aims to early detect and react to
cyber anomalies of a utility, to be demonstrated on a
power distribution grid. To demonstrate CockpitCI
results an hybrid testbed is under construction.
SCADA and corporate network models, indicators
and results, discussed here, intend ideally to feed
such a testbed.
ModellingSCADAandCorporateNetworkofaMediumVoltagePowerGridunderCyberAttacks
133

7 CONCLUSIONS
Here, with reference to an actual case study,
provided by IEC, and constituted by a SCADA, its
power grid and a corporate network, we have
discussed how cyber threats, vulnerabilities and
attacks might change the performances of SCADA
and corporate network devices, which, in turn, might
lead to outages of the electrical grid. We have
represented SCADA and corporate network under
malware propagation, Denial of Service and Man in
the Middle cyber attacks, and predicted their
consequent performance indicators. Particularly, we
use NetLogo to represent possible malware
propagation, in relation to the adopted utility
SCADA & corporate network security policies and
NS2 simulator to compute the consequences of the
attacks on SCADA and in turn on medium voltage
power grid.
REFERENCES
Stamp J., Dillinger J., Young W., and DePoy J. 2003
Common vulnerabilities in critical infrastructure
control systems. Technical report, Sandia National
Laboratories, SAND2003-1772C.
Shaw W.2004. SCADA system vulnerabilities to cyber
attack. In Electric Energy Online.
http://www.electricenergyonline.com/
NARUC. 2012 Cybersecurity for state regulators.
Kim HJ.2012. Security and vulnerability of SCADA
systems over IP-based wireless sensor networks.
International Journal of Distributed Sensor Networks,
Volume 2012 (2012), Article ID 268478, 10 pages,
2012. doi:10.1155/2012/268478.
Fuloria S., Anderson R., McGrath K., Hansen K., and
Alvarez F. 2010. The protection of substation
communications. SCADA Security
Scientific Symposium, Jan 2010, http://www.cl.cam.ac.uk/
American Gas Association 2006. Cryptographic protection
of SCADA communications part 1: Background,
policies and test plan. AGA Report no.12, Part. 1,
http://scadahacker.com/library/Documents/Standards/
Ahmed I., Obermeier S., Naedele M. and Richard G. 2012.
Scada systems: Challenges for forensic investigators.
IEEE Computer, 12/2012, pp 42-49 45(12).
Byres E., Lissimore D., and Kube N. 2006. Who turned
out the lights? - security testing for SCADA and
control systems. In CanSecWest,, Vancouver, British
Columbia, April, 2006.
Tassier T. 2005. SIR model of epidemic. Epidemics and
Development Policy, Fordham University NY. 2005
Dua S. and Du X. 2011. Data Mining and Machine
Learning in Cybersecurity, Boca Raton:CRC Press.
Ciancamerla E., Minichino M, Palmieri S. 2012. On
prediction of QoS of SCADA accounting cyber attacks
Probabilistic Safety Assessment and Management
Conference (PSAM11) and the Annual European
Safety and Reliability Conference (ESREL 2012)
IEC 60870-5-101 Telecontrol equipment and systems -
Part 5-101: Transmission protocols - Companion
standard for basic telecontrol tasks
Queiroz C., Mahmood A., Hu J., Tari Z. and Yu X. 2009,
Building a SCADA security testbed,Proceedings of the
Third International Conference on Network and
System Security, pp. 357–19364, 2009.
SECRYPT2013-InternationalConferenceonSecurityandCryptography
134
