Applying Bayesian Parameter Estimation to A/B Tests
in e-Business Applications
Examining the Impact of Green Marketing Signals
in Sponsored Search Advertising
Tobias Blask
Institute of Electronic Business Processes, Leuphana University of Lueneburg, Lueneburg, Germany
Keywords:
Bayesian Statistics, Bayesian Parameter Estimation, Sponsored Search, Paid Search Advertising, A/B Testing.
Abstract:
We develop and perform a non reactive A/B-test setting that enables us to evaluate the influence of green
marketing signals on the customer’s decision to take a specific online-shop into account in the process of
buying a specific product by clicking on an ad on a search engine results page (SERP). We analyze campaign
performance data generated by a European e-commerce retailer, apply a Bayesian parameter estimation to
compare specific advertisements and discuss the implications of the results.
1 INTRODUCTION
Internet search engines like Google, Yahoo! or Bing
play an undisputed key role in the modern informa-
tion society. On the one hand they serve the informa-
tion needs of their users, on the other hand they repre-
sent an important source of customer acquisition for
companies in a broad variety of industries and sizes
(Jansen and Mullen, 2008; Alby and Funk, 2011).
They also provide the search engine companies with
significant amounts of their revenues through Spon-
sored Search Advertising. While still growing rapidly
Sponsored Search Advertising already dominates the
online media-spendings of companies that advertise
on the internet. In this form of advertising, devel-
oped in 1998 by Overture, advertisers provide search
engines with text-advertisements and a list of key-
words, which can consist of one or more terms, they
want these ads to be displayed. The advertiser usu-
ally also provides attributes to each of these key-
words, but at the very least the amount of money he
is willing to pay for a click on an ad for this spe-
cific keyword (CPC
max
)(Jansen et al., 2009). Every
time a user types in a query the search engine gener-
ates individual personalized result pages, depending
on the users’ location, his search history and other
factors. If ads are available that could probably sat-
isfy the need of the user, the search engine displays
these ads alongside the organic results. If more than
one advertiser is willing to pay for the display of an
ad the search engine auctions the position of these
ads among all interested players typically based on
a Generalized Second Price Auction (GSP) (Jansen,
2011; Varian, 2009). In each auction only the adver-
tiser that wins the auction by getting a click on an ad
is charged by the search engine. The effective Cost-
Per-Click (CPC
ef f
) is basically the maximum bid of
the advertiser with the subsequent highest bid plus a
small additional fee. In practice search engine com-
panies use a more robust mechanism to maximize
their profits by rewarding keyword/ad combinations
that have a high relevance to users (often referred to
as the quality score). Although detailed calculations
are not disclosed, the key metric is claimed to be the
historic Click-Through-Rate (CTR) where available,
otherwise an expected click probability for the spe-
cific advertiser-ad-keyword combination is used.
Figure 1: Two variations of an ad, similar to the ones that
were used in the A/B test: Carbon Neutral delivery vs. Fast
and Reliable delivery.
In the present paper we concentrate on the advertisers’
perspective and the direct impact of green signals in
312
Blask T..
Applying Bayesian Parameter Estimation to A/B Tests in e-Business Applications - Examining the Impact of Green Marketing Signals in Sponsored
Search Advertising.
DOI: 10.5220/0004523603120319
In Proceedings of the 4th International Conference on Data Communication Networking, 10th International Conference on e-Business and 4th
International Conference on Optical Communication Systems (ICE-B-2013), pages 312-319
ISBN: 978-989-8565-72-3
Copyright
c
2013 SCITEPRESS (Science and Technology Publications, Lda.)

text advertisements. We evaluate the probability that
a user will click on a given Sponsored Search text ad-
vertisement containing the promise of Carbon Neutral
delivery vs. another one offering generic information
on reliable fast delivery and conduct a Bayesian pa-
rameter estimation approach to analyze the data.
2 LITERATURE REVIEW
There are two streams in literature which are impor-
tant for the present research. The first is green mar-
keting. The second studies the various influences on
Sponsored Search advertising effectiveness.
2.1 Green Marketing
Green marketing has been a widely recognized trend
for international firms over the last years. One can
clearly identify strong efforts in the development of
sustainable brand images in a number of branches.
One trend Leonidou et al identify in their review of
developments in green advertising research and prac-
tice from 1988 to 2007 is a strategy shift from com-
municating environmental aspects within the produc-
tion process to the communication of sustainable con-
sumption by the customers themselves. An other im-
portant expansion of this field is observed in the in-
tensification of efforts by B2C businesses in com-
municating green messages in their advertising ac-
tivities. (Leonidou et al., 2011) The use of ecola-
bels is a well known tactic is to provide the poten-
tial consumer with independent confirmation of the
green efforts of the respective advertiser. In fact Rex
and Baumann state that there is still lack of empiri-
cal knowledge about the consumers reception in this
area. (Rex and Baumann, 2007) Recent studies indi-
cate that a number of consumers may be willing to
pay higher prices for products they identify as en-
vironmental friendly. (Haytko and Matulich, 2008)
What is still unanswered is the whether these green
signals still have an impact direct buying decisions in
situations in E-Commerce situations. Recent research
indicates that this is not the case but lacks a sufficient
amount of data to draw conclusions about the final
size of the measured effect so that the authors rec-
ommend further research when more data is available
(Blask, 2013).
2.2 Sponsored Search Advertising
In published research, Online Marketing and Spon-
sored Search especially has become an established
topic with a variety of high quality publications in
Computer- and Information Science as well as in the
fields of Operations Research and Marketing. Since
2004, Sponsored Search has become a continuously
more and more important topic in the Online Market-
ing research area (Evans, 2008; Evans, 2009; Jansen
and Mullen, 2008). Yao and Mela (Yao and Mela,
2009) contribute a first comprehensive literature re-
view of Sponsored Search Advertising from the per-
spective of three stakeholders: (a) search engine com-
panies, (b) advertisers, and (c) users.
The search engine auctions the positions of the ads
on the Search Engine Result Page (SERP) between all
advertisers that placed a bid (CPC
max
) for the given
keyword. The ad position is the result of the com-
binedCPC
max
and so called quality scores of the play-
ers. The CPC
ef f
depends on the advertisers bid and
the ones provided by the other advertisers in the auc-
tion and the quality score of the ad / query combina-
tion.
Many publications in this area have an empirical
basis. Basically quantitative research is conducted
with three types of datasets: (a) Search engine query
data (b) aggregated media and e-Commerce statistics
and (c) individual user journeys. Search engine query
data is the rarest form of available data for researchers
who are not directly affiliated to the search engines as
it can only be collected by the search engine compa-
nies themselves. Although every search engine com-
pany generates masses of this type of data, there are
only few datasets available for academic use. One
of those is the well known AOL dataset. It consists
of about 20 million completely non-censored web
queries collected from about 650,000 users over a
three month period, arranged by anonymous individ-
ual IDs. This dataset has been extensively examined
since 2006 (Pass et al., 2006; Adar, 2007; Strohmaier
et al., 2007; Strohmaier et al., 2008; Brenes and
Gayo-Avello, 2009).
Aggregated media and e-Commerce statistics are
generated by the advertisers themselves during their
ad campaigns. One way this kind of data is produced
is by the campaigning tool itself (e.g. Google Ad-
Words) or the advertiser’s respective software solu-
tion. The data is usually aggregated on campaign, ad-
group and keyword-level and contains variables like
the total number of clicks, impressions, CTR, CPC,
and CVR as can be seen in table 1.
The third sort of available data enables researchers
to understand individual user behavior. User jour-
ney conversion datasets include information about
all measured touch-points that an individual user has
with a specific advertiser. These datasets make the de-
velopment of attribution-models possible where every
conversion success can be allocated to the ad-contacts
ApplyingBayesianParameterEstimationtoA/BTestsine-BusinessApplications-ExaminingtheImpactofGreen
MarketingSignalsinSponsoredSearchAdvertising
313

Table 1: Typical dataset from Google AdWords (ad level).
Keyword Clicks Impr. CTR Avg.
CPC
Cost Avg.
Position
Conv. Cost /
conversion
Conv.
rate
ad 1 132 2,198 6% 1.32 174.08 2 16 11 12%
ad 2 421 2,893 15% 2.32 976.72 3 21 46.51 5%
... ... ... ... ... ... ... ... ... ...
Table 2: Estimated parameters of the A/B Test results.
Parameter mean median mode HDIlow HDIhigh pcgtZero
mu1 0.132138406 0.132018013 0.131569530 0.11165869 0.15294856 NA
mu2 0.125833478 0.125631688 0.126106871 0.10429358 0.14779868 NA
muDiff 0.006304928 0.006340036 0.006486033 -0.02312652 0.03597397 66.45467
sigma1 0.060327010 0.059410333 0.057196013 0.04050337 0.08129424 NA
sigma2 0.066338944 0.065606745 0.064239271 0.04496894 0.08889838 NA
sigmaDiff -0.006011934 -0.005907207 -0.005017510 -0.03192138 0.02088154 32.31035
nu 2.559232839 2.410642280 2.174679973 1.28929893 4.12144979 NA
nuLog10 0.389457520 0.382132769 0.375861907 0.15221850 0.63937996 NA
effSz 0.101884502 0.101000518 0.102799453 -0.37368096 0.56259172 66.45467
a user has had. Like the other types of data too, user
journey data is always subject to several types of bias,
such as caused by media discontinuities.
2.3 Click Probability
Click probabilities have been widely studied since
the early beginning of the advertising format Spon-
sored Search. However, due the lack of possibilities
to observe the user behaviour while using a search en-
gines, a complete coverage of all factors influencing
the CTR is no easy task.
Evidence suggests that one of the most influencing
factors is the ad position within the Sponsored Search
results, which depends among other facts on the ad-
vertisers CPC
max
and the so called quality score. The
quality score, used by search engines to determine the
quality of an advertisement, is based primarily on the
historical CTR. A large number of studies has shown
the correlation between decreasing position and a de-
creasing CTR and vice versa (Richardson et al., 2007;
Agarwal et al., ). It should be emphasized, that the
highest positions leads to high CTRs but not manda-
torily to the highest conversion rates. From an adver-
tiser’s perspective, a topic of interest is to predict the
future CTR of sponsored ads. As argued before, the
position has a major influence on the CTR, called the
position bias. In the course of research, several mod-
els have been developed to explain the influence of
the position bias on the CTR.
Crasswell, Zoeter and Taylor (Craswell et al.,
2008) present several models for predicting the CTR:
(a) baseline model, (b) mixture model, (c) examina-
tion model, and (d) cascade model . The findings were
originally based on organicsearch results but, they are
applicable to Sponsored Search results as well (Agar-
wal et al., ). The underlying assumption of the (a)
baseline model is that a user screens every search re-
sult and decides afterwards, which one fits the best
to the query. As a consequence, the click probabil-
ities for each individual search result are identically,
independently of its position. The (b) mixture model
extends the baseline model and divides user behavior
into two groups. One group behaves as described in
the baseline model, the other group clicks randomly
on one of the first search results. The (c) examina-
tion model refers to findings from eye tracking studies
which state that with declining position, the probabil-
ity of a click declines as well (Joachims et al., 2005;
Joachims et al., 2007). The (d) cascade model is, ow-
ing to the high degree of explanation by click data,
one of the most applied explanation approaches. The
basic assumption is that the user scans each search re-
sult, beginning from the top to the bottom, comparing
the relevance of each ad with the relevance of the ad
before. The user continuous scanning the results until
the perceived ad relevance reaches a certain level and
the user clicks.
As mentioned above one challenge is to predict
the CTR of keywords or keyword combinations for
potential future Sponsored Search ads. One solu-
tion that has been proposed is aggregating historical
data from similar keywords (Regelson and Fain, ).
Here, the CTR is represented as a function of po-
sition, independent of a bid. In doing so, the de-
veloped models do not focus on a certain advertiser.
The same clustering approach can be applied in op-
timizing the search engines’ profit (Dave and Varma,
2010). There are also models taking the quality score
into account (Gluhovsky, 2010; Dembczynski et al.,
ICE-B2013-InternationalConferenceone-Business
314
0.0 0.2 0.4 0.6
0 4 8
Data Group 1 w. Post. Pred.
y
p
(
y
)
N
1
52
0.0 0.2 0.4 0.6
0 4 8
Data Group 2 w. Post. Pred.
y
p
(
y
)
N
2
57
Normality
log10(!)
0.0 0.2 0.4 0.6 0.8 1.0
mode 0.376
95% HDI
0.152 0.639
Group 1 Mean
"
1
0.08 0.10 0.12 0.14 0.16 0.18
mean 0.132
95% HDI
0.112 0.153
Group 2 Mean
"
2
0.08 0.10 0.12 0.14 0.16 0.18
mean 0.126
95% HDI
0.104 0.148
Difference of Means
"
1
# "
2
-0.06 -0.02 0.02 0.04 0.06 0.08
mean 0.0063
33.5% < 0 < 66.5%
100% in ROPE
95% HDI
-0.0231 0.036
Group 1 Std. Dev.
$
1
0.04 0.06 0.08 0.10 0.12
mode 0.0572
95% HDI
0.0405 0.0813
Group 2 Std. Dev.
$
2
0.04 0.06 0.08 0.10 0.12
mode 0.0642
95% HDI
0.045 0.0889
Difference of Std. Dev.s
$
1
# $
2
-0.08 -0.04 0.00 0.02 0.04 0.06
mode -0.00502
67.7% < 0 < 32.3%
100% in ROPE
95% HDI
-0.0319 0.0209
Effect Size
%"
1
# "
2
&
%$
1
2
' $
2
2
& 2
-0.5 0.0 0.5 1.0
mode 0.103
33.5% < 0 < 66.5%
30% in ROPE
95% HDI
-0.374 0.563
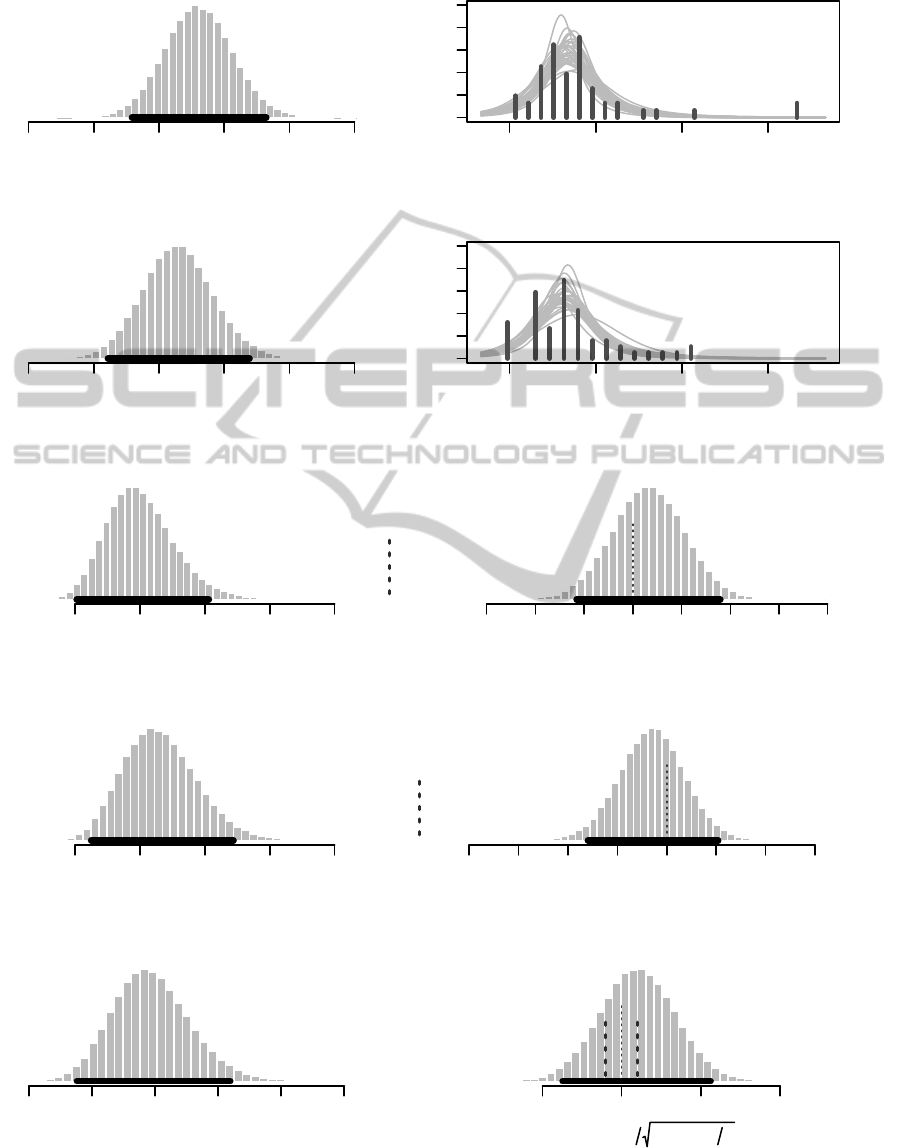
Figure 2: Group 1 = CTR for ads advertising Carbon Neutral delivery, group 2 = CTR for ads advertising Fast and Reliable
delivery.
ApplyingBayesianParameterEstimationtoA/BTestsine-BusinessApplications-ExaminingtheImpactofGreen
MarketingSignalsinSponsoredSearchAdvertising
315

1
0.10 0.14 0.04 0.08
0.10 0.13 0.16
0.10 0.14
0.075
2
0.093 0.12
!
1
0.04 0.08
0.04 0.08
0.058 0.18 0.27
!
2
0.10 0.13 0.16
0.10
0.20
0.04 0.08
0.52
0.53
0.2 0.6 1.0
0.2 0.6 1.0
log10"#$
Figure 3: Posteriors for Bayesian Parameter Estimation.
2008). A model developed by Zhu et al. (Zhu et al.,
2010) called General Click Model focuses on theCTR
prediction of long-tail queries, based on a Bayesian
network. Dealing with the position bias mentioned
before, Zhong et al. (Zhong et al., 2010) incorpo-
rate post-click user behaviour data from the respective
landing page of the clicked ad into the click model to
refine the estimation of the perceived user relevance
after clicking on a specific ad. A similar approach,
using Dynamic Bayesian networks can be found in
Chappelle and Zhang (Chapelle and Zhang, 2009).
Several models based on historical click data suffer
from limitations in terms of lacking consideration of
a possible user learning effect. Taking Gauzente’s re-
sults as an example, it has been shown that past user
satisfaction with Sponsored Search results influences
the current click behaviour (Gauzente, 2009). Besides
the incorporation of position data and the perceived
relevance of presented ads, the CTR of an advertiser
is also affected by the relationship between organic
and Sponsored Search results. Listing the results of
one company at the same time in sponsored and or-
ganic search results leads to a higher CTR and vice
versa (Yang and Ghose, 2010; Blask et al., 2011).
3 CASE STUDY
This study covers a test period over several days in
which a single element in selected Sponsored Search
text advertisements hast been alternated for a num-
ber of queries that users type into the Google search
engine to eventually buy products in the advertiser’s
online shop as can be seen in fig. 1. The advertis-
ers’ products can be classified as B2C Fast Moving
Consumer Goods. The selected keywords include (a)
variations of the retailer brand, (b) the brand names of
product manufacturers as well as (c) several clear-cut
descriptions of selected products in the online-shop.
The data was generated directly by Google Adwords
as part of the normal campaign evolution of the ad-
vertiser.
The test has been carried out in early 2013. The
resulting dataset contains a large number of Spon-
sored Search key performance indicators (KPI) for
the given period as exemplified in table 1. The con-
tent of the unfiltered dataset as well as the exact dates
of the test period cannot be revealed to ensure con-
fidentiality for the advertiser and are of no impor-
tance for what follows from here. To ensure that
ICE-B2013-InternationalConferenceone-Business
316

only the impact of the specific text alternation is ana-
lyzed and to exclude other factors that would blur the
results, especially the strong position effects we de-
scribe above, we only analyze the advertisements that
were displayed above the organic search results and
that were part of the described A/B test. The updated
dataset, which is only a small fraction of the adver-
tisers’ regular Sponsored Search campaign, includes
a total of 109 advertisements of which 52 advertise
”Carbon Neutral delivery” while the other 57 adver-
tise ”Fast and Reliable delivery” in the third row of
the advertisement as illustrated in fig 1. It contains
a total number of 4,370 clicks. What is used for the
analysis is the aggregated CTR for each ad over the
whole test period.
Analytic Approach. Traditionally one makes prob-
abilistic assumptions about the magnitude of the dif-
ference between two observed groups by using null
hypothesis significance testing (NHST). We, how-
ever, apply a Bayesian approach to answer the ques-
tion whether there is a positive, negative or zero im-
pact of sustainability information in ad texts in Spon-
sored Search advertising by comparing two groups
of users that took part in an A/B test. Even though
the applied method possibly influences the behavior
of the involved users and could therefore be catego-
rized as reactive in terms of social sciences, it shares
common criteria with non-reactive methods since in-
dividual users have no knowledge of the investigation
of their behavior.
4 CONCLUSIONS
AND OUTLOOK
We describe the data using mean and standard devia-
tion parameters for t-distributions representing both
groups individually and add a normality parameter
that is common for both groups. The prior alloca-
tion of credibility across the parameters is vague, so
that the prior has minimal influence on the estima-
tion, to let the data dominate the inference. Taking the
data into account the Bayesian estimation reallocates
credibility to parameter values that represent the ob-
served data best. The resulting distribution is a joint
distribution across the five parameters, thereby reveal-
ing combinations of the five parameter values that are
credible, given the data (Kruschke, 2012). The two
histograms in the top right in fig. 2 are representations
of empirical data and display the two observed groups
(group 1 = ”Carbon Neutral delivery”,group 2 = ”Fast
and Reliable delivery”), with curves of representative
examples of posterior predictive t-distributions. In the
left column you will find marginals of the posterior
distributions of credible values of means of group 1
and 2 as well as the same for the respective standard
deviations and a distribution of credible values for
the the combined normality parameter. Lower right
shows posterior distribution of differences in means
and effect size. Fig. 3 displays pairwise plots of the
parameters for the given study.
Taking a first look at the data we find a slightly
higher empirical mean CTR over all ads on ads
that advertise ”Fast and Reliable delivery” (14.39%)
than on the ”Carbon Neutral delivery” ads (15.94%).
These values are not to be confused with those in the
top left histograms in fig. 2 which represent the sim-
ulated mean parameters of t-distributions to fit the
empirical distribution. So, in the data we observe
a 1.55% higher empirical mean CTR for ”green”
ads which would eventually make us accept the hy-
potheses that ads with green marketing signals have a
higher click probability than their counterparts in the
A/B test. What is the central question is whether this
result is significant and if it enables us to derive infer-
ences about the ”real” long-term distribution.
To answer this question a large number of param-
eter combinations for t- distributions that are credible
given the data is generated by Markov Chain Monte
Carlo simulation (MCMC). One gets a good insight
by comparing the distribution of credible values for µ
1
which has a mean of 0.132 and a 95% Highest Density
Interval (HDI) from 0.112 to 0.153 with µ
2
which has
a mean of 0.126 with a 95% HDI from 0.104 to 0.148
as can be seen in tab. 2. The exact difference µ
1
− µ
2
is 0.0063 on average as can be found in the plot in
the middle of the right column of fig. 2. One can see
that 66.5% of the 95% HDI for µ
1
− µ
2
is positive.
What is even more relevant for the analysis is that all
computed values within the 95% HDI fall into the Re-
gion of Practical Equivalence (ROPE) which spreads
from -0.1 to 0.1. So, these results imply that there
is a 66.5% chance that the ”real” mean of group 1 is
grater than the ”real” mean of group 2. Nevertheless
the difference of means is so small that there is a high
probability that the groups are not credibly different
from each other in this aspect. Comparing the distri-
bution of credible values for σ
1
and σ
2
one can see
that these groups do not credibly differ too. This can
be seen in the respective histogram in fig. 2 where all
computed values for σ
1
− σ
2
are found in the ROPE
with 67.7% being negative and 32.3% being positive.
This suggests that there is a 67.7% probability that the
standard deviation for group 2 is grater than for group
1.
The lower right panel of fig. 2 shows the distri-
bution of credible effect sizes, given the data. For
each combination of means and standard deviations,
ApplyingBayesianParameterEstimationtoA/BTestsine-BusinessApplications-ExaminingtheImpactofGreen
MarketingSignalsinSponsoredSearchAdvertising
317

the effect size is computed. The histogram of 100,000
credible effect sizes has a mode of 0.103 and the zero
included in the 95% HDI. 66.5% of all computed out-
comes are positive while 27.8% are negative.
What can we derive from that? What is true is that
there is some probability that there is absolutely no
effect caused by the different signals in the advertise-
ments as we do not observe strongly significant un-
ambiguous results. If any effect is presumed, it will
have a higher probability of being positive for ”green
signals” in Sponsored Search ads, given the observed
data. How can this outcome be explained? One argu-
ment could be that ad texts do not influence users on
SERPs at all. Although we know about various other
effects, like the strong position bias described above,
that do affect the user there are too many indications
that ad texts do have influence on click decisions to
let this be true.
In fact, these results need to be interpreted with
caution. One possible explanation for this is that
users might not be as green in their decisions as mar-
keters would like them to be. In this case the promise
of ”Fast and Reliable delivery” seams to lead to a
slightly lower motivation to click on an ad than the
green signals the advertiser sends out to his potential
customers. This A/B test should be repeated over a
number of various branches before one can derive im-
plications for the whole e-Commerce industry. What
is an even more interesting outcome of this paper is
that more future research should be conducted on the
general impact of texts in Sponsored Search ads con-
sidering a variety of branches and containing more di-
versity in texts to make sophisticated assumptions on
the impact of text-details on click probabilities.
REFERENCES
Adar, E. (2007). User 4xxxxx9: Anonymizing query logs.
In Query Logs Workshop, WWW, volume 7. Citeseer.
Agarwal, A., Hosanagar, K., and Smith, M. D. Location,
Location, Location: An Analysis of Profitability of
Position in Online Advertising Markets. Journal of
Marketing Research, (Forthcoming).
Alby, T. and Funk, B. (2011). Search Engine Marketing in
Small and Medium Companies: Status Quo and Per-
spectives. In Cruz-Cunha, M. and Varaj˜ao, J., editors,
E-Business Managerial Aspects, Solutions and Case
Studies, pages 206–221. igi-global.
Blask, T. (2013). Investigating the Promotional Effect of
Green Signals in Sponsored Search Advertising us-
ing Bayesian Parameter Estimation. In Proceedings
of the International Conference on Information Tech-
nologies in Environmental Engeneering (ITEE 2013).
Blask, T., Funk, B., and Schulte, R. (2011). Should Com-
panies Bid on their Own Brand in Sponsored Search?
In Proceedings of the International Conference on e-
Business (ICE-B 2011), pages 14–21, Seville, Spain.
Citeseer.
Brenes, D. J. and Gayo-Avello, D. (2009). Stratified
analysis of AOL query log. Information Sciences,
179(12):1844–1858.
Chapelle, O. and Zhang, Y. (2009). A dynamic bayesian
network click model for web search ranking. In
Proceedings of the 18th international conference on
World wide web - WWW ’09, page 10, New York, New
York, USA. ACM Press.
Craswell, N., Zoeter, O., Taylor, M., and Ramsey,
B. (2008). An experimental comparison of click
position-bias models. In Proceedings of the interna-
tional conference on Web search and web data mining
- WSDM ’08, page 8, New York, New York, USA.
ACM Press.
Dave, K. S. and Varma, V. (2010). Learning the click-
through rate for rare/new ads from similar ads. In
Proceeding of the 33rd international ACM SIGIR con-
ference on Research and development in information
retrieval - SIGIR ’10, number July, page 897, New
York, New York, USA. ACM Press.
Dembczynski, K., Kotlowski, W., and Weiss, D. (2008).
Predicting ads click-through rate with decision rules.
In World Wide Web, volume 2008.
Evans, D. S. (2008). The Economics of the Online Ad-
vertising Industry. Review of Network Economics,
7(3):pp359–391.
Evans, D. S. (2009). The Online Advertising Industry: Eco-
nomics, Evolution, and Privacy. Journal of Economic
Perspectives, 23(3):37–60.
Gauzente, C. (2009). Information search and paid results
proposition and test of a hierarchy-of-effect model.
Electronic Markets, 19(2-3):163–177.
Gluhovsky, I. (2010). Forecasting Click-Through Rates
Based on Sponsored Search Advertiser Bids and In-
termediate Variable Regression. October, 10(3):1–28.
Haytko, D. and Matulich, E. (2008). Green advertising
and environmentally responsible consumer behaviors:
Linkages examined. Journal of Management and
Marketing Research, 1:2–11.
Jansen, B. and Mullen, T. (2008). Sponsored search: an
overview of the concept, history, and technology. In-
ternational Journal of Electronic Business, 6(2):114–
131.
Jansen, B. J., Flaherty, T. B., Baeza-Yates, R., Hunter, L.,
Kitts, B., and Murphy, J. (2009). The Components and
Impact of Sponsored Search. Computer, 42(5):98–
101.
Jansen, J. (2011). The Serious Game of Bidding on Key-
words. In Understanding Sponsored Search Core El-
ements of Keyword Advertising, chapter 8, pages 176–
201. Cambridge University Press.
Joachims, T., Granka, L., Pan, B., Hembrooke, H., and
Gay, G. (2005). Accurately interpreting clickthrough
data as implicit feedback. In Proceedings of the 28th
annual international ACM SIGIR conference on Re-
search and development in information retrieval - SI-
GIR ’05, page 154, New York, New York, USA. ACM
Press.
ICE-B2013-InternationalConferenceone-Business
318

Joachims, T., Granka, L., Pan, B., Hembrooke, H., Radlin-
ski, F., and Gay, G. (2007). Evaluating the accuracy
of implicit feedback from clicks and query reformula-
tions in Web search. ACM Transactions on Informa-
tion Systems, 25(2):1–26.
Kruschke, J. K. (2012). Bayesian Estimation Supersedes the
t Test. Journal of experimental psychology. General.
Leonidou, L. C., Leonidou, C. N., Palihawadana, D., and
Hultman, M. (2011). Evaluating the green advertis-
ing practices of international firms: a trend analysis.
International Marketing Review, 28(1):6–33.
Pass, G., Chowdhury, A., and Torgeson, C. (2006). A pic-
ture of search. In Proceedings of the 1st international
conference on Scalable information systems - InfoS-
cale ’06, pages 1–es, New York, New York, USA.
ACM Press.
Regelson, M. and Fain, D. C. Predicting Click-Through
Rate Using Keyword Clusters. In ACM, editor,
EC’06.
Rex, E. and Baumann, H. (2007). Beyond ecolabels: what
green marketing can learn from conventional market-
ing. Journal of Cleaner Production, 15(6):567–576.
Richardson, M., Dominowska, E., and Ragno, R. (2007).
Predicting clicks: estimating the click-through rate for
new ads. In Proceedings of the 16th international con-
ference on World Wide Web, pages 521–530. ACM
New York, NY, USA.
Strohmaier, M., Lux, M., Granitzer, M., Scheir, P., Liaskos,
S., and Yu, E. (2007). How do users express goals
on the web?-An exploration of intentional structures
in web search. LECTURE NOTES IN COMPUTER
SCIENCE, 4832:67.
Strohmaier, M., Prettenhofer, P., and Kr¨oll, M. (2008). Ac-
quiring Explicit User Goals from Search Query Logs.
In 2008 IEEE/WIC/ACM International Conference on
Web Intelligence and Intelligent Agent Technology,
volume 8, pages 602–605. Ieee.
Varian, H. (2009). Online ad auctions. American Economic
Review, 99(2):430–434.
Yang, S. and Ghose, A. (2010). Analyzing the Relationship
Between Organic and Sponsored Search Advertising:
Positive, Negative, or Zero Interdependence? Market-
ing Science, 30(1):1–22.
Yao, S. and Mela, C. F. (2009). Sponsored Search Auc-
tions: Research Opportunities in Marketing. Founda-
tions and Trends in Marketing, 3(2):75–126.
Zhong, F., Wang, D., Wang, G., Chen, W., Zhang, Y., Chen,
Z., and Wang, H. (2010). Incorporating post-click
behaviors into a click model. Annual ACM Confer-
ence on Research and Development in Information
Retrieval, pages 355–362.
Zhu, Z., Chen, W., Minka, T., Zhu, C., and Chen, Z. (2010).
A novel click model and its applications to online
advertising. In Proceedings of the third ACM inter-
national conference on Web search and data mining,
pages 321–330. ACM.
ApplyingBayesianParameterEstimationtoA/BTestsine-BusinessApplications-ExaminingtheImpactofGreen
MarketingSignalsinSponsoredSearchAdvertising
319
