
Towards Cryptographic Function Distinguishers
with Evolutionary Circuits
Petr
ˇ
Svenda, Martin Ukrop and Vashek Maty´aˇs
Masaryk University, Botanicka 68a, Brno, Czech Republic
Keywords:
eStream, Genetic Programming, Random Distinguisher, Randomness Statistical Testing, Software Circuit.
Abstract:
Cryptanalysis of a cryptographic function usually requires advanced cryptanalytical skills and extensive
amount of human labour. However, some automation is possible, e.g., by using randomness testing suites
like STS NIST (Rukhin, 2010) or Dieharder (Brown, 2004). These can be applied to test statistical proper-
ties of cryptographic function outputs. Yet such testing suites are limited only to predefined patterns testing
particular statistical defects. We propose more open approach based on a combination of software circuits
and evolutionary algorithms to search for unwanted statistical properties like next bit predictability, random
data non-distinguishability or strict avalanche criterion. Software circuit that acts as a testing function is au-
tomatically evolved by a stochastic optimization algorithm and uses information leaked during cryptographic
function evaluation. We tested this general approach on problem of finding a distinguisher (Englund et al.,
2007) of outputs produced by several candidate algorithms for eStream competition from truly random se-
quences. We obtained similar results (with some exceptions) as those produced by STS NIST and Dieharder
tests w.r.t. the number of rounds of the inspected algorithm. This paper focuses on providing solid assessment
of the proposed approach w.r.t. STS NIST and Dieharder when applied over multiple different algorithms
rather than obtaining best possible result for a particular one. Additionally, proposed approach is able to
provide random distinguisher even when presented with very short sequence like 16 bytes only.
1 INTRODUCTION
The main motivation for this work is to provide a tool
with the crucial ability to automatically probe for un-
wanted properties of cryptographic functions that sig-
nalize flaws in the function design. Although proper
and repeated cryptanalysis by a human cryptanalyst
(often assisted by automated tools) is by far the most
successful approach to assert function overall secu-
rity, one may want to automatically test for known sta-
tistical defects present in output produced by a func-
tion. Additionally, output testing for a given imple-
mentation of a particular cryptographic function is re-
quired to detect implementation errors.
Typical cryptanalytical approach against a new
cryptographic function is usually based on application
of various statistical testing tools (e.g., STS NIST,
Dieharder) as the first step. Then follows applica-
tion of established cryptanalytical procedures (algo-
rithmic attacks, differential cryptanalysis, etc.) com-
bined with an in-depth knowledge of the inspected
function. The first step can be at least partly auto-
mated and (relatively) easy to apply, but will detect
only the most visible defects in the function design or
apply only to a limited number of algorithm rounds.
The second approach usually yields much stronger in-
sight and detects more significant defects, but usually
requires extensive human cryptanalytical labour. Ad-
ditionally, general statistical testing tools are limited
to a predefined set of statistical tests. That on one
hand makes the follow-up analytical work easier if
the function fails a certain test, yet on the other hand
severely limits the potential to detect other defects.
We propose a novel approach based on combi-
nation of an automatically generated algorithm in
form of a hardware-like circuit designed by evolu-
tionary algorithms (more specifically, by genetic pro-
gramming). Evolutionary algorithms were previously
used to probe specific problems of a particular func-
tion (e.g., DES, TEA, XTEA), yet for their really
useful application, the identification of specific sub-
problems like deviation of χ
2
Goodness of Fit tests
applied to statistic of least significant bits (Castro and
Vi˜nuela, 2005) was required. Our approach may di-
rectly provide a distinguisher without prior identifica-
tion of such sub-problems as well as be used when
135
Svenda P., Ukrop M. and Matyas V..
Towards Cryptographic Function Distinguishers with Evolutionary Circuits.
DOI: 10.5220/0004524001350146
In Proceedings of the 10th International Conference on Security and Cryptography (SECRYPT-2013), pages 135-146
ISBN: 978-989-8565-73-0
Copyright
c
2013 SCITEPRESS (Science and Technology Publications, Lda.)

such a property was identified, providing a higher de-
gree of freedom when searching for a distinguisher.
We designed and tested an automated process that
can be used in a similar manner as general statistical
testing suites, but additionally provides the possibil-
ity to construct (again automatically) new tests. We
represent the “tests” as a hardware-like circuit emu-
lated in software that execute over given inputs and
computes outputs. Evolutionary algorithms (EAs)
are used to design the circuit layout (“wires” and
“gates”). Although such an automated tool will not
(at least for the moment) outperform a skilled cryp-
tographer, still it brings two major advantages:
• It can be applied automatically against multiple
different cryptographic functions with no addi-
tional human labour – working implementation of
the inspected function is sufficient. Cryptographic
function competitions like AES (AES, 1997),
SHA-3 (SHA-3, 2007) or eStream (ECRYPT,
2004) are providing a particular advantage be-
cause candidate functions have to comply with
a standard programming interface (API), further
easing tests of numerous functions.
• It may discover and use other information leakage
“side channels” of the function than those usu-
ally assumed by cryptographers. The proposed
approach does not require pre-selection of partic-
ular parts of the function or input/output bits or to
define statistics used – this decision is left to the
evolutionary algorithm. Note that the proposed
approach may lead to even better results if a crypt-
analyst targets only a specific part of the inspected
function.
We implemented the proposed approach (more details
given in Section 3) and tested our idea on random
distinguishers of output from several eStream candi-
date functions (see Section 4). To assess the success
and usefulness of this method, we focused on func-
tions with inner structure containing repeated rounds.
By gradually increasing the number of rounds used
in a function, one can identify the maximum num-
ber of rounds where the approach still provides re-
sults (i.e., distinguisher with better probability than
random guessing). Results are very similar to those
obtained from STS NIST and Dieharder test suites
w.r.t. the number of rounds of the inspected function.
2 PREVIOUS WORK
Numerous works tackled the problem of distinguisher
construction between data produced by cryptographic
functions and truly random data, both with reduced
and full number of rounds. Usually, statistical testing
with battery of tests (e.g., STS NIST (Rukhin, 2010)
or Dieharder (Brown, 2004)) or additional custom tai-
lored statistical tests are performed. The STS NIST
battery was used to evaluate fifteen AES (round 2)
candidates, demonstrating some deviation from ran-
domness in six candidates (Soto, 1999). In (Turan
et al., 2006), detailed examination of eStream Phase
2 candidates (full and reduced round tests) with STS
NIST battery and structural randomness tests was per-
formed, finding six ciphers deviating from expected
values. More recently, the same battery, but only a
subset of the tests, was applied to the SHA-3 candi-
dates (in the second round of competition, 14 in to-
tal) for a reduced number of rounds as well as only
to compression function of algorithm (Doganaksoy
et al., 2010). Additionally, custom-built statistical
tests based on strict avalanche criterion and others
were used, resulting in estimation of relative secu-
rity margins of candidates w.r.t. the number of rounds.
(Sulak et al., 2010) proposed a method to test statis-
tical properties of short sequences typically obtained
by block ciphers or hash algorithms for which some
from STS NIST can not be applied due to insufficient
length. Probabilities expressed by p-values are calcu-
lated for each short subinterval and improved method
based on recalculation of expected probabilities is
provided. Example results applied to selected block
and hash functions are presented. 256-bit versions of
SHA-3 finalists were subjected to statistical tests us-
ing a GPU-accelerated evaluation (Kaminsky, 2012).
Both algorithms and selected tests from STS NIST
battery were implemented for the nVidia CUDA plat-
form. Because of massive parallelization, superpoly
tests introduced by (Dinur and Shamir, 2009) were
possible to be performed, detecting some deviations
in all but the Grøstl algorithm.
Stochastic algorithms were also applied in cryp-
tography to some extent, focusing initially mostly on
simple transposition and substitution ciphers or prob-
lems like efficient knapsack algorithm. A nice re-
view of usage of genetic algorithms in cryptography
up to year 2004 can be found in (Delman, 2004), a
more recent review of evolutionary methods used in
cryptography is provided by (Picek and Golub, 2011).
TEA algorithm (Wheeler and Needham, 1995) with
a reduced number of rounds is a frequent target for
cryptoanalysis with genetic algorithms. In (Castro
and Vi˜nuela, 2005), a successful randomness distin-
guisher for XTEA limited to 4 rounds is generated
with genetic algorithms. The distinguisher gener-
ates a bit mask with high Hamming weight which
when applied to function input, resulting in devi-
ated χ
2
Goodness of Fit test of the output. Addi-
SECRYPT2013-InternationalConferenceonSecurityandCryptography
136

tionally, a special behaviour of the TEA algorithm
with full number of rounds was observed when XOR-
ing instead of adding the mask. However no distin-
guisher for full number of rounds was found. Subse-
quent work (Hu, 2010) improves an earlier attack with
quantum-inspired genetic algorithms, finding more
efficient distinguishers for a reduced round TEA algo-
rithm and succeeding for the 5-round TEA. In (Gar-
rett et al., 2007) a comparison of genetic techniques
is presented, with several suggestions which genetic
techniques and parameters should be used to obtain
better results. We adopted the genetic programming
(Banzhaf et al., 1997) technique with steady-state re-
placement (Liu et al., 2008). An important difference
of our approach from previous work is the production
of a program (in the form of a software circuit) that
provides different results depending on given inputs.
Previous work produced a fixed result, e.g., bit mask
in (Castro and Vi˜nuela, 2005; Hu, 2010) that is di-
rectly applied to all inputs.
Structure of a software circuit resembles artificial
neural networks (NN) to some extent. Notable dif-
ferences are in the learning mechanism and in a high
number of layers used in our software circuit (NN
usually use only three). Recently, deep belief neu-
ral networks (DBNN) were proposed (Hinton et al.,
2006) with the learning algorithm based on restricted
Boltzmann machines that also use 5 or even more
layers. Still, a software circuit uses mutation and
crossover to converge towards an optimum instead of
back propagation in case of classical NN or lay-by-
layer learning algorithm for DBNN. Also, different
functions may be computed inside every node in case
of software circuit instead of weighted sum of DBNN.
3 SOFTWARE CIRCUIT
DESIGNED BY EVOLUTION
Software circuit is a software representation of a
hardware-like circuit with nodes (“gates”) responsible
for computation of simple functions (e.g., AND, OR).
Nodes are positioned in layers where outputs from the
previous layer are provided as inputs to the nodes in
the following layer by connectors (“wires”). Input to
the whole circuit is simulated as an output of the first
layer and output of last layer is taken as the output of
whole circuit. Connectors might connect a node to all
nodes from a previous layer, to only some of them, or
to none at all. Connectors in a software circuit may
also cross each other as they are emulated – in con-
trary to real single-layer hardware circuits. A simple
circuit can be seen in Figure 1.
Examples of such a circuit might be a Boolean
circuit where functions computed in nodes are lim-
ited to logical functions or artificial neural networks
where nodes compute the weighted sum of the inputs.
Besides studying complexity problems, these circuits
were used in various applications like construction of
a fully homomorphic scheme (Gentry, 2010) or in de-
sign of efficient image filters (Sekanina et al., 2012).
Circuit evaluation can be performed by a software
emulator that propagatesinput values, computes func-
tions and collects outputs in nodes or possibly directly
in hardware when FPGAs are used (Sekanina et al.,
2012).
IN_0 IN_1 IN_2 IN_3
1_0_NOR 1_1_ROL_5 1_2_AND 1_3_NOP
2_0_ROL_0 2_1_SUM 2_2_ADD 2_3_ROR_6
3_0_SUB 3_1_OR_ 3_2_SUB 3_3_DIV
4_0_BSL_3 4_1_DIV 4_2_NAN 4_3_ADD
0_OUT 1_OUT 2_OUT 3_OUT
Figure 1: Software circuit with input nodes (IN x), inner
nodes, output nodes (x
OUT) and connectors. Note that not
all input or output nodes need to be used as well not all inner
nodes need to output any value.
3.1 How to Design Circuit Layout
Circuit design can be laid out by an experienced
human designer, automatically synthetized from the
source code or even automatically initialized and then
improved by an optimization algorithm. We use the
last approach and combine a software circuit evalu-
ated on a CPU (or also on GPUs) with evolutionary
algorithms (EAs). The main goal is to find a circuit
that will reveal an unwanted defect in the inspected
cryptographic functions. For example, if a circuit is
able to correctly predict the n
th
bit of a key stream
generated by a stream cipher just by observing pre-
vious (n − 1) bits, then this circuit serves as a next-
bit predictor (Yao, 1982), breaking the security of the
given stream cipher. When a circuit is able to distin-
guish output of the tested function from a truly ran-
dom sequence, it serves as a random distinguisher
(Englund et al., 2007) providing a warning sign of
function weakness.
Note that a circuit need not provide correct an-
swers for all inputs – it is sufficient if a correct answer
is provided with a probability significantly better than
random guessing.
When combined with evolutionary algorithms, the
whole process of circuit design consists of the follow-
TowardsCryptographicFunctionDistinguisherswithEvolutionaryCircuits
137

ing steps:
1. Several software circuits are randomly initialized
(randomly selected functions in nodes, randomly
assigned existence of connectors between nodes)
forming population of candidate individuals. Ev-
ery individual is represented by one circuit. Note
that such a random circuit will most probably not
provide any meaningful output for given inputs
and can even have disconnected layers (no output
at all).
2. If necessary, generate new test vectors used later
by a so-called fitness function for evaluation (see
Section 3.2 for discussion).
3. Every individual (circuit) in the population is em-
ulated and obtained outputs are evaluated. The
fitness function assigns a rating based on each in-
dividual success in given task (e.g., what fraction
of inputs were correctly recognized as being out-
put of a stream cipher rather than a completely
random sequence, see Section 3.2 for details).
4. Based on the evaluation provided by the fitness
function, a potentially improved population is
generated by mutation and crossover operators
from individuals taken from the previous gener-
ation. Design of every individual (circuit) may
be changed by changing operations computed in
nodes or adding/removing connectors between
nodes in subsequent layers.
5. Repeat from step 2. Usually hundreds of thou-
sands or more repeats are performed, therefore
the evaluation of a single circuit in step 3 must be
fast enough (currently, we are in the milliseconds
range).
3.2 How to Define Problems to be
Solved by Circuit
Evolutionary algorithms need to be supplied with a
metric of success (so-called fitness function) that is
applied to measure quality of a candidate individual.
Proper definition of fitness function is crucial to ob-
tain a working solution to the defined problem. In this
work, we limit ourselves to randomness distinguisha-
bility as a target goal and devise the metric of success
based on a number of test vectors correctly identified
by the software circuit as the output from the crypto-
graphic function or the stream of random data. Other
goals like next-bit predictor (Yao, 1982) or defector of
strict avalanche criterion (Webster and Tavares, 1986)
can be used.
In this work, we aim to obtain a software circuit
capable of correctly distinguishing between a block
of bytes generated by a cryptographic function (eS-
tream candidate) with an unknown key and truly ran-
dom data. We worked with three scenarios with re-
spect to the frequency of key change:
1. Key is fixed for all generated test sets and vectors.
Even when test sets change, new test vectors are
generated using the same key.
2. Every test set was generated using a different key.
All test vectors in a particular test set are gener-
ated with the same key.
3. Every test vector (16 bytes) was generated using
a different key.
The circuit input is a sequence of bytes produced ei-
ther by the inspected function (first type) or generated
completely randomly (second type). The circuit out-
put is an encoding of the guessed source. Different
encodings are possible: single bit (e.g., 0 meaning
“random data” and 1 meaning “function output”) or
multiple bits (e.g., low versus high Hamming weight
of whole output byte). Results in this work use only
byte’s highest bit for easier interpretation, but Ham-
ming weight seems to be a better choice for later ex-
periments. Additionally, a circuit can be allowed to
make multiple guesses by producing multiple output
bytes. A circuit thus has the possibility to express its
own certainty in the predicted result (e.g., by setting 2
out of 3 outputs to predict random data and remaining
one to predict the function output) as well as to evolve
more than one predictor inside a single circuit.
A circuit is successful if able to distinguish func-
tion outputs from random sequences significantly bet-
ter than by random guessing.
3.3 How to Evaluate Circuit
Performance?
For evaluation of a circuit performance, we use super-
vised learning with test sets containing pairs of inputs
and expected outputs generated by a “teacher” prior
to the evaluation. Since we generated the test sets, we
also know which vectors were generated from func-
tion output and which were taken from random data.
Outputs from a circuit for given inputs are compared
with expected outputs and circuit performance is then
rated as follows:
fitness =
#(correctly
predicted test vectors)
#(total test vectors)
For our experiments, we used the following settings
to maintain a good trade-off between the evaluation
time and statistics (influenced mainly by the number
of test vectors) and the ability to prevent overlearning
(influenced by the test set change frequency).
SECRYPT2013-InternationalConferenceonSecurityandCryptography
138

• Every test set contains 1000 test vectors with ex-
actly half taken from inspected function’s output
and second half taken from random data. Order
of test vectors in the set is not important as test
vectors are handled by circuit completely inde-
pendently.
• Every test vector has length of 16 bytes.
• Test set is periodically changed every 100
th
gen-
eration to prevent overlearning on a given test set.
3.4 Practical Implementation
We represent a software circuit by a two-dimensional
array with values in odd rows interpreted as nodes
and values in even rows as masks defining existing
connectors. The circuit simulator takes this array to-
gether with input values, passes inputs to the first
layer of nodes and propagates values modified by el-
ementary functions in nodes via connectors to the
following layer. After processing all layers of cir-
cuit, values provided by the last layer are returned
as the circuit output. For the start, we used the fol-
lowing elementary operations for nodes: no operation
(NOP), logical functions (AND, OR, XOR, NOR,
NAND), bit manipulating functions (ROTR, ROTL,
BITSELECTOR), arithmetic functions (ADD, SUBS,
MULT, DIV, SUM), read a specified input byte even
from an internal layer (READX) and produce a con-
stant value (CONST). The implementation is avail-
able as an open-source project EACirc (Ukrop and
ˇ
Svenda, 2013).
As optimization requires many evaluations of can-
didate circuits, we use our computation infrastructure
with the BOINC control (Anderson, 2004) to per-
form distributed computation with more than thou-
sand CPU cores. EACirc is implemented to coordi-
nate computation based on logs of population of indi-
viduals and on the internal state, providing possibil-
ity to perform optimization with unlimited number of
generations even when a computation node itself lasts
only a limited time before reboot.
Truly random data used for test vectors were pro-
duced by the Quantum Random Bit Generator Service
(QRBG) (Stevanovi´c et al., 2008).
To ease understanding of our software circuits, we
implemented an automatic removal of nodes and con-
nectors that do not contribute to the resulting fitness
value (pruning) and transformation into the Graphviz
dot format for easy visualization.
To independently replicate results provided by a
circuit emulator and to double check against possible
implementation bugs, EACirc allows to transform the
two-dimensional array with the circuit into the source
code of a plain C program. The resulting C program
can be compiled separately and computes only the
circuit from which it was generated, but completely
avoids the circuit emulator.
4 APPLICATION TO ESTREAM
CANDIDATES
The testing methodology described in Section 3 was
applied against candidate functions from the eStream
competition (ECRYPT, 2004). We considered the
availability of implementations with the same pro-
gramming interface (API) for all candidates, where
one can automatically test (both STS NIST/Dieharder
and software circuit distinguisher) on a large number
of functions with ease. Additionally, one can cherry-
pick only such functions where a well-working cir-
cuit is found for further analysis. In this work, we fo-
cused primarily on the goal to obtain at least the same
results as with STS NIST/Dieharder batteries. Previ-
ous works evaluated statistical properties of candidate
functions with the full number of rounds as well as
with a reduced number of rounds (Turan et al., 2006).
Testing full number of rounds usually provides only
limited information – either the function is very weak
and exhibits weaknesses even in the full number of
roundsor no defect at all is detected, even when an ex-
ploitable serious attack might exist for a limited num-
ber of rounds.
From 34 candidates in the eStream competition,
23 were potentially usable for testing (due to re-
named or updated versions, problems with compi-
lation, etc.). For the start, we limited ourselves to
7 of these (Decim, Grain, FUBUKI, Hermes, LEX,
Salsa20 and TSC) having a structure that allows for
a reduction of complexity by a decreased number of
rounds in a straightforward way.
4.1 Settings Used
For the Dieharder test battery, the following settings
were used:
• 250 MB of data generated from a given function
with 3 different key change frequencies;
• tests correspondingto the original Diehard battery
were used (except for the Diehard sums test);
• each test was run once, length of the data stream
actually used was decided by the test;
• based on the test results, sum over all tests
(pass=1, weak=0.5, fail=0) is displayed.
For the STS NIST, the following settings were used:
TowardsCryptographicFunctionDistinguisherswithEvolutionaryCircuits
139

IN_0IN_1 IN_2 IN_3 IN_4 IN_5
IN_6
IN_7
IN_8
IN_9 IN_10 IN_11
IN_12 IN_13
IN_14
IN_15
1_2_ROL_3 1_3_ROL_5 1_4_NOR 1_5_SUM
2_3_OR_ 2_5_NOP
3_3_OR_
4_0_SUM 4_3_NOP
5_0_NOP 5_1_OR_
0_OUT 1_OUT
IN_0IN_1 IN_2 IN_3IN_4IN_5 IN_6 IN_7
IN_8
IN_9 IN_10 IN_11 IN_12 IN_13 IN_14 IN_15
1_0_XOR1_1_XOR 1_3_NOP1_4_ADD 1_5_ADD 1_7_SUB
2_0_XOR 2_1_OR_ 2_3_NAN 2_4_AND 2_5_OR_
3_0_NAN 3_1_NOP 3_2_OR_ 3_3_MUL 3_5_NOP
4_0_MUL 4_2_NOP 4_3_NAN
5_0_NOR5_1_NOR
0_OUT1_OUT
Figure 2: Two example circuits found by evolution for distinguishing the Grain algorithm (limited to 2 rounds) from truly
random data (only nodes contributing to resulting success rate are shown). Although both circuits encode distinguishers with
the same success rate (strong 99%), their internal complexity is different. The right circuit uses all inputs but number 8 (IN
8),
whereas the left circuit ignores four more inputs. Additionally, the left circuit is performing distinguisher functionality only in
its first three layers, remaining two are only propagating values to output layer. Notice also the SUM function in the 4
th
layer
(4
0 SUM) – it has no other functionality than to pass the output from the 3
rd
layer to the 5
th
(output) layer (equivalent of
NOP) – a simple example of equivalent functionality encoded in multiple ways typical for evolutionary algorithms. Finally,
observe nodes in the 5
th
layer of the right circuit – the same function (NOR) is performed over the same set of inputs from
the 4
th
layer, outputting the same value into 0
OUT and 1 OUT. Such a behaviour was observed in almost all evolved circuits
and is the consequence of circuit outputs interpretation (see Section 3.2).
• same source files with data as for Dieharder were
used;
• each test runs 100 times on 1 000 000 bits;
• some runs had problems (error during test exe-
cution) with tests RandomExcursions and Ran-
domExcursionsVariant. These tests are therefore
not included in the results.
Note that we will not discuss all results in details as
such discussion was already done several times before
(Soto, 1999; Turan et al., 2006; Doganaksoy et al.,
2010). We will focus only on the identification of the
highest round where some defects are still detected
and the significance of such detection – whether al-
most all tests fail or only a minority of them.
For the software circuit, we used the following set-
tings:
• 5 layers, 8 nodes in every internal layer, 16 input
nodes (corresponding to 16 input bytes in every
test vector) and 2 output nodes.
For evolutionary algorithms, we used the following
settings (based on our previous experience):
• Population consists of 20 individuals refreshed by
the steady-state replacement strategy (Liu et al.,
2008) with
2
/3 of individuals replaced every gen-
eration.
• 30000 generations were executed in a single evo-
lution run with 30 separate evolution runs running
in parallel.
• Mutation is applied with probability of 0.05 and
changes function in given node or connector mask
by addition or removalof connector to given node.
• Crossover is applied with probability of 0.5 and
performs single point crossoverwith the first i lay-
ers taken from the first parent and remaining lay-
ers from the second parent.
Around 2.3MB ((30000/100) · 500 · 16B) is re-
quired for evolution with 30000 generations and the
test set changed every 100
th
generation. If 30 runs
were executed in parallel (this was performed to ob-
tain reliable samples), around 68 MB of data pro-
duced by a given function is required. However, all
runs for eStream ended with the same success ra-
tio and were therefore unnecessary in principle (tests
with SHA-3 candidates provided more varying re-
sults).
We like to stress out that STS NIST and Dieharder
make decision on all such data processed together in
single pass. Our circuit will make decision on much
smaller sample of 16 bytes only.
4.2 Results for eStream Candidates
Tables 1–7 summarize results for selected eStream
candidates depending on a number of algorithm
rounds and also on the key change frequency. Visual-
ization of example circuit is shown at Figure 2 . In-
terpretation of values in tables 1–7 is the following:
both statistical tests have several tests in battery – 20
for Diehard, 162 for STS NIST (for STS NIST, two
groupsof tests were omitted as mentionedearlier, oth-
erwise the number of tests would be 188). Dieharder
provides three levels of evaluationfor a particular test:
pass, weak, fail. Values 1, 0.5, 0 were assigned to
these levels respectively and sum over all tests is com-
puted and displayed. For STS NIST, number of all
SECRYPT2013-InternationalConferenceonSecurityandCryptography
140

passed tests is displayed (this is deduced from the dis-
tribution of p-values across all 100 runs with respect
to the significance level of α = 0.01).
For the software circuit (EACirc), the distin-
guisher success rate (fitness value) is computed on a
fresh new test set never seen by a given circuit be-
fore. Two types of values are presented. When a
distinguisher with at least 99% success rate for 50
consecutive test sets was found (very strong distin-
guisher), average number of generations (from 30 in-
dependent runs) necessary to find it is listed. When
no such strong distinguisher is found, the average suc-
cess rate is listed, computed as the average of averages
of maximum fitness after test vector change (denoted
as AAM). The first case provides a distinguisher that
is almost always right. The second case provides a
distinguisher sometimes giving a wrong answer, but
still better than random guessing.
To verify results provided by the proposed ap-
proach, we first let circuits distinguish between two
groups of test vectors, but with both taken from truly
random data. Intuitively, our approach should fail
to find a working distinguisher and should behave as
random guessing. The predicted behaviour was con-
firmed by an experiment with same settings as these
used for testing functions. All statistical tests from
Dieharder (20/20) and STS NIST (162/162) success-
fully passed on such data, and no stable distinguisher
was found. The average distinguisher success ratio
computed in the same manner as for tested functions
(AAM) was 0.52. Note that the value of 0.52 is
equivalent to random guessing, although bigger than
0.5. The reason is that more than one individual is
present in the population (20 individuals were used,
20 guesses instead of 1 are made, best one is used).
Changing the number of individuals or the number
of test vectors will influence the expected centre of
distribution – the distinguisher success ratio shifts to-
wards the value 0.5 when the number of individuals is
decreasing, as well as when the number of test vectors
is increasing, as intuitively expected. We also exper-
imentally verified this reasoning: for the population
fixed to 20 individuals, setting the test set size to 200,
500, 1000, 2000, 5000 and 10000 vectors provide the
average success ratios of 0.544, 0.527, 0.520, 0.514,
0.509 and 0.506, respectively. For the test size fixed
to 1000 vectors, setting the population size to 5, 10,
20, 50 and 100 individuals provide the average suc-
cess ratios of 0.509, 0.514, 0.520, 0.526 and 0.530,
respectively.
Let us take Grain limited to 1 round as an example
how to interpret data in Tables 1–7:
• For a key fixed over all tests (the key is set only
once for the run), all tests from Dieharder and STS
NIST failed, therefore the displayed value is 0. A
software circuit found a strong 99% distinguisher
in the 221
st
generation (on average).
• For the key changed every test set, all tests from
Dieharder and STS NIST failed again, resulting
in value 0. The software circuit was unable to
find a strong 99% distinguisher, but found a dis-
tinguisher with approximately 0.67 success rate
(AAM) – value (0.67) is displayed.
• For the key changed every test vector (every 16
bytes), Dieharder resulted in one fail and one
weak test (all other passed), therefore the sum is
18.5. For STS NIST, all tests passed, resulting
in value 162. The software circuit was unable to
find any distinguisher better than random, having
AAM value equal to 0.52, therefore (0.52) is dis-
played.
4.3 Verification of Separate Circuit
To cross-verify results found by the proposed ap-
proach, we took the source code representation of a
circuit found and executed it without the circuit em-
ulator directly over 100 000 test vectors. The results
confirmed values obtained via circuit emulator.
5 DISCUSSION
Process of circuit optimization and circuits found can
be analysed to understand how EAs progress towards
a working solution and what makes circuit a working
distinguisher. The following behaviour was observed:
• Different circuits with the same distinguishing
success rate might be evolved, as is demonstrated
with the example of Grain-2 (Figure 2), possibly
with a significant diversity. A deeper analysis of
shared components between different circuits may
provide a better understanding of statistical de-
fects detected in data.
• Fitness progress typical for evolutionary algo-
rithms was observed. Intermediate solutions tend
to overlearn on a particular testing set and sharply
decrease once the testing set is changed (occur-
ring every 100
th
generation), forming a jaw-like
graph (see Figure 3). Once a genuine progress
in the distinguisher success rate is achieved, over-
learning still takes place, but the subsequent drop
is not going down to random guessing.
• Not all nodes and connectors in input and inner
layers are utilized for prediction. As such nodes
and connectors can be automatically detected (no
TowardsCryptographicFunctionDistinguisherswithEvolutionaryCircuits
141

Table 1: Results for Grain.
# of rounds
IV and key reinitialization
once for run for each test set for each test vector
Dieharder
(x/20)
STS NIST
(x/162)
EACirc
Dieharder
(x/20)
STS NIST
(x/162)
EACirc
Dieharder
(x/20)
STS NIST
(x/162)
EACirc
1 0.0 0 n = 221 0.0 0 (0.67) 18.5 162 (0.52)
2 0.0 0 n = 471 0.5 0 (0.66) 20.0 162 (0.52)
3 19.5 160 (0.52) 20.0 162 (0.52) 20.0 162 (0.52)
13 20.0 162 (0.52) 20.0 161 (0.52) 19.5 162 (0.52)
Table 2: Results for Decim.
# of rounds
IV and key reinitialization
once for run for each test set for each test vector
Dieharder
(x/20)
STS NIST
(x/162)
EACirc
Dieharder
(x/20)
STS NIST
(x/162)
EACirc
Dieharder
(x/20)
STS NIST
(x/162)
EACirc
1 0.0 0 n = 2681 0.0 0 (0.85) 0.0 5 n = 1431
2 0.5 0 (0.54) 1.0 0 (0.54) 15.5 146 (0.52)
3 1.0 0 (0.53) 1.0 0 (0.53) 15.0 160 (0.52)
4 3.5 79 (0.52) 3.0 78 (0.52) 20.0 160 (0.52)
5 4.5 79 (0.52) 3.5 91 (0.52) 17.5 161 (0.52)
6 19.0 158 (0.52) 19.0 159 (0.52) 18.0 162 (0.52)
7 18.5 162 (0.52) 19.0 161 (0.52) 20.0 161 (0.52)
8 20.0 162 (0.52) 20.0 159 (0.52) 19.0 161 (0.52)
Table 3: Results for FUBUKI.
# of rounds
IV and key reinitialization
once for run for each test set for each test vector
Dieharder
(x/20)
STS NIST
(x/162)
EACirc
Dieharder
(x/20)
STS NIST
(x/162)
EACirc
Dieharder
(x/20)
STS NIST
(x/162)
EACirc
1 20.0 162 (0.52) 20.0 161 (0.52) 18.0 162 (0.52)
4 20.0 162 (0.52) 20.0 162 (0.52) 20.0 162 (0.52)
change to the fitness value when temporarily re-
moved), a pruned version of the circuit is easier to
analyse.
5.1 Comparison of Software Circuit
with STS NIST/Dieharder Batteries
Based on results obtained with the proposed approach
(software circuits designed by genetic programming),
a comparison to statistical batteries like STS NIST
and Dieharder can be undertaken:
Advantages
• The proposed method is based on a completely
different approach than statistical tests used in
batteries, opening space for detecting dependen-
cies between solutions not covered by tests from
batteries.
• The proposed method offers possibility to con-
struct a distinguisher based on a dynamically con-
structed algorithm rather than a predefined one
from batteries.
SECRYPT2013-InternationalConferenceonSecurityandCryptography
142

Table 4: Results for Hermes.
# of rounds
IV and key reinitialization
once for run for each test set for each test vector
Dieharder
(x/20)
STS NIST
(x/162)
EACirc
Dieharder
(x/20)
STS NIST
(x/162)
EACirc
Dieharder
(x/20)
STS NIST
(x/162)
EACirc
1 20.0 162 (0.52) 20.0 162 (0.52) 20.0 162 (0.52)
10 20.0 160 (0.52) 20.0 162 (0.52) 20.0 162 (0.52)
Table 5: Results for LEX. Note that the internal structure of LEX responds differently to the limitation of number of rounds
(when compared to other algorithms). LEX internally prepares 4 bytes of data during every round as output stream. Limitation
of the number of rounds will only limit number of bytes in the output, not the strength of output data. Since we are testing 16
bytes of input data, 4 rounds will generate enough internal output bytes to encrypt it as a full round version.
# of rounds
IV and key reinitialization
once for run for each test set for each test vector
Dieharder
(x/20)
STS NIST
(x/162)
EACirc
Dieharder
(x/20)
STS NIST
(x/162)
EACirc
Dieharder
(x/20)
STS NIST
(x/162)
EACirc
1 0.0 0 n = 148 0.0 0 n = 7274 3.0 1 n = 154
2 4.0 1 n = 221 4.0 1 n = 304 3.5 1 n = 254
3 0.5 1 n = 378 3.5 1 n = 491 4.0 1 n = 361
4 20.0 162 (0.52) 19.5 162 (0.52) 20.0 161 (0.52)
10 19.5 162 (0.52) 19.5 160 (0.52) 20.0 160 (0.52)
Table 6: Results for Salsa20.
# of rounds
IV and key reinitialization
once for run for each test set for each test vector
Dieharder
(x/20)
STS NIST
(x/162)
EACirc
Dieharder
(x/20)
STS NIST
(x/162)
EACirc
Dieharder
(x/20)
STS NIST
(x/162)
EACirc
1 5.5 1 (0.87) 8.5 1 (0.67) 17.5 161 (0.52)
2 5.5 1 (0.87) 7.0 1 (0.67) 19.5 162 (0.52)
3 20.0 162 (0.52) 20.0 162 (0.52) 19.5 161 (0.52)
12 20.0 162 (0.52) 19.5 161 (0.52) 19.0 161 (0.52)
• Once a working distinguisher is found, it requires
extremely short sequences (tested on 16 bytes
only) to detect function output. Statistical batter-
ies require at least several megabytes of data.
• Once a distinguisher is found (time intensiveoper-
ation), it can be used to quickly process additional
test vectors produced with different keys.
• Lower amount of data extracted from a given
function is necessary to provide a working dis-
tinguisher (at maximum, we used 2.2 MB). Data
required by STS NIST and Dieharder were larger
(more than 200 MB required for some Dieharder
tests). Note that some tests may provide indica-
tion of failure even when less data is available.
Disadvantages
• Because of very short sequences the circuit is
working on, subtle statistical defects may not be
detected. However, several modifications to the
proposed approach might be used to process large
sequences instead of 16 bytes only (e.g., circuit
with memory executed iteratively over large data
partitioned to 16 bytes chunks) – testing such
TowardsCryptographicFunctionDistinguisherswithEvolutionaryCircuits
143
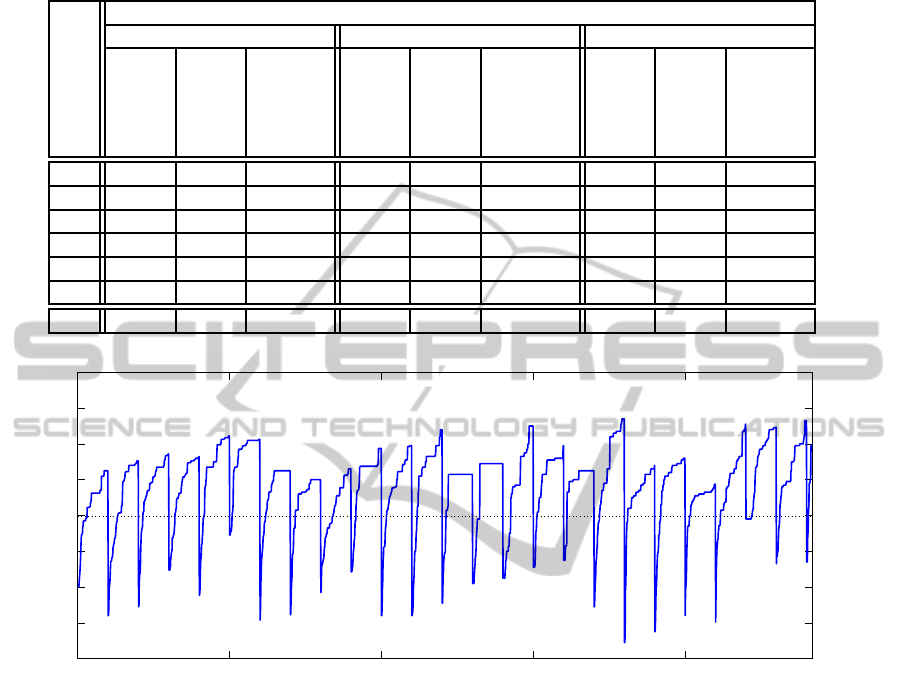
Table 7: Results for TSC. Note that the TCS algorithm does not fill data into all output structures before round 9. During
the first 8 rounds, only parts of memory are set by function output, leaving remaining memory filled with memory garbage
(values present in the memory before allocation).
# of rounds
IV and key reinitialization
once for run for each test set for each test vector
Dieharder
(x/20)
STS NIST
(x/162)
EACirc
Dieharder
(x/20)
STS NIST
(x/162)
EACirc
Dieharder
(x/20)
STS NIST
(x/162)
EACirc
1-8 0.0 0 n = 104 0 0 n = 4101 0.0 0 n = 104
9 1.0 1 n = 234 1.5 1 n = 491 2.0 1 n = 121
10 2.0 13 n = 188 3.0 13 n = 218 3.0 12 n = 158
11 10.0 157 (0.52) 11.5 157 (0.52) 14.0 159 (0.52)
12 16.0 162 (0.52) 17.0 161 (0.52) 17.5 162 (0.52)
13 20.0 162 (0.52) 20.0 162 (0.52) 19.0 162 (0.52)
32 20.0 161 (0.52) 20.0 162 (0.52) 20.0 161 (0.52)
0 500 1000 1500 2000
0.48
0.49
0.5
0.51
0.52
0.53
0.54
0.55
0.56
Distinguisher success rate
Random to random data distinguisher
Number of generations
Figure 3: Example of success rate for distinguisher evolution between two sets of random data, the data set changed every
100
th
generation (dotted line corresponds to average success of random guessing). Although no structure is present in data,
the circuit is overlearning on a particular data set and thus exhibiting better success rate then random guess (increasing part of
curve) before the test set is changed (a sudden drop in the success rate).
modifications is now on our agenda.
• The resulting distinguisher may be hard to analyse
– what is the weakness detected and what should
be fixed in the function design?
• EA based approach may require significantly
higher computational requirements to test the can-
didate function during the evolution phase of soft-
ware circuit. Evaluation of an evolved circuit
(e.g., distinguisher) is then very fast.
• A distinguisher found may be fitted to a particular
candidate function (and possibly even a particular
key, if the key is not changed periodically in the
training set) instead of discovering generic defects
in the tested function.
To verify usability of the proposed methodology
against a wider set of functions than stream ciphers
from the eStream competition, we applied the de-
scribed methodology also against 18 selected func-
tions from the SHA-3 competition. As these algo-
rithms provide only fixed and short sequences, hash
of value of randomly initialized counter is used to
obtain data from the algorithms passed to statistical
tests. Results obtained confirmed the results against
eStream candidates (
ˇ
Svenda et al., 2013).
6 CONCLUSIONS
We proposed a general design of a cryptoanalytical
tool based on genetic programming and applied it to
the problem of finding a random distinguisher for sev-
SECRYPT2013-InternationalConferenceonSecurityandCryptography
144
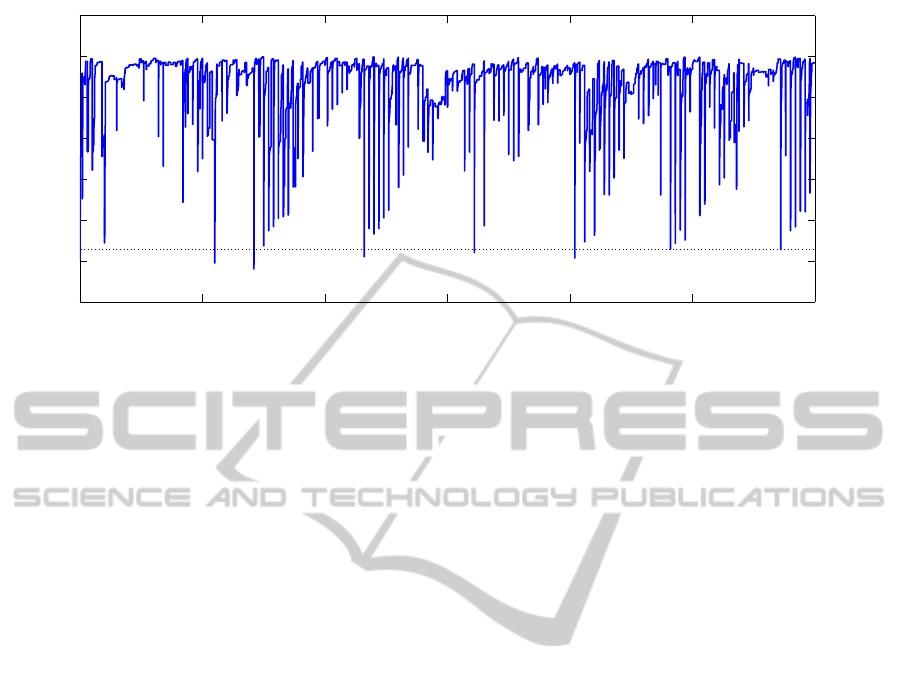
0 0.5 1 1.5 2 2.5 3
x 10
4
0.4
0.5
0.6
0.7
0.8
0.9
1
1.1
Salsa20 (2 rounds), fixed key for whole run
Number of generations
Distinguisher success rate
Figure 4: Fitness progress over 30000 generations for Salsa20 reduced to 2 rounds and with a fixed key for all test sets.
Although sometimes the distinguishing success rate drops down to random guess when a key set was changed, the circuit is
quickly able to learn back to a high success rate. Such a behaviour motivated us to compute and display the AAM value rather
than a single value of the best individual from last round. Also, the circuit is (over-)learning very quickly to a particular data
set. Such a behaviour led us to inspect the overlearning speed as a potential metric of success instead of how well the circuit
is working after a test vector change.
eral stream ciphers (with a reduced number of rounds)
taken from the eStream competition. In general, the
proposed approach proved to be capable of closely
matching the performance of the NIST statistical test-
ing suite (except for the Decim algorithm) and with
several exceptions also to the Dieharder battery. A
robust evaluation was performed to obtain an aver-
age success rate over various scenarios w.r.t. the key
change frequency as well as the number of rounds to
which the target stream cipher is limited to.
The proposed approach provides a novel way of
inspecting statistical defects in cryptographic func-
tions and may provide a significant advantage when
working with very short sequences (such as 16 bytes)
once the learning phase of evolution is completed.
Our future work will cover techniques that will en-
able providing significantly more data as circuit in-
put to provide more fair comparison to STS NIST and
Dieharder batteries, which are making statistical ana-
lysis on tens (STS NIST) up to hundreds (Dieharder)
of megabytes of data.
Resources (data, source codes, configuration files,
etc.) for the work discussed are provided at (
ˇ
Svenda
et al., 2013).
ACKNOWLEDGEMENTS
This work was supported by the GAP202/11/0422
project of the Czech Science Foundation. The ac-
cess to computing and storage facilities owned by par-
ties and projects contributing to the National Grid In-
frastructure MetaCentrum, provided under the pro-
gramme Projects of Large Infrastructure for Re-
search, Development, and Innovations (LM2010005)
is highly appreciated.
REFERENCES
AES (1997). AES competition, announced 2.1.1997.
Anderson, D. P. (2004). BOINC: A system for public-
resource computing and storage. In Proceedings of
the 5th IEEE/ACM International Workshop on Grid
Computing, GRID ’04, pages 4–10, Washington, DC,
USA. IEEE Computer Society.
Banzhaf, W., Nordin, P., Keller, R. E., and Francone, F. D.
(1997). Genetic programming: An introduction: On
the automatic evolution of computer programs and its
applications.
Brown, R. G. (2004). Dieharder: A random number test
suite, version 3.31.1.
Castro, J. C. H. and Vi˜nuela, P. I. (2005). New results on
the genetic cryptanalysis of TEA and reduced-round
versions of XTEA. New Gen. Comput., 23(3):233–
243.
Delman, B. (2004). Genetic algorithms in cryptography.
PhD thesis, Rochester Institute of Technology.
Dinur, I. and Shamir, A. (2009). Cube attacks on tweak-
able black box polynomials. In Proceedings of the
28th Annual International Conference on Advances in
Cryptology: the Theory and Applications of Crypto-
graphic Techniques, EUROCRYPT ’09, pages 278–
299. Springer-Verlag.
Doganaksoy, A., Ege, B., Koc¸ak, O., and Sulak, F. (2010).
Statistical analysis of reduced round compression
TowardsCryptographicFunctionDistinguisherswithEvolutionaryCircuits
145

functions of SHA-3 second round candidates. Techni-
cal report, Institute of Applied Mathematics, Middle
East Technical University, Turkey.
ECRYPT (2004). Ecrypt estream competition, announced
November 2004.
Englund, H., Hell, M., and Johansson, T. (2007). A note
on distinguishing attacks. In Information Theory for
Wireless Networks, 2007 IEEE Information Theory
Workshop on, pages 1–4. IEEE.
Garrett, A., Hamilton, J., and Dozier, G. (2007). A compar-
ison of genetic algorithm techniques for the cryptanal-
ysis of tea. International journal of intelligent control
and systems, 12(4):325–330.
Gentry, C. (2010). Computing arbitrary functions of en-
crypted data. Commun. ACM, 53(3):97–105.
Hinton, G. E., Osindero, S., and Teh, Y.-W. (2006). A fast
learning algorithm for deep belief nets. Neural com-
putation, 18(7):1527–1554.
Hu, W. (2010). Cryptanalysis of TEA using quantum-
inspired genetic algorithms. Journal of Software En-
gineering and Applications, 3(1):50–57.
Kaminsky, A. (2012). GPU parallel statistical and cube test
analysis of the SHA-3 finalist candidate hash func-
tions. In 15th SIAM Conference on Parallel Process-
ing for Scientific Computing (PP12).
Liu, L., Li, M., and Lin, D. (2008). Replacement strate-
gies in steady-state multi-objective evolutionary algo-
rithm: A comparative case study. In Proceedings of
the 2008 Fourth International Conference on Natural
Computation, ICNC ’08, pages 645–649, Washington,
DC, USA. IEEE Computer Society.
Picek, S. and Golub, M. (2011). On evolutionary computa-
tion methods in cryptography. In MIPRO, 2011 Pro-
ceedings of the 34th International Convention, pages
1496 –1501.
Rukhin, A. (2010). A statistical test suite for the valida-
tion of random number generators and pseudo ran-
dom number generators for cryptographic applica-
tions, version STS-2.1. NIST Special Publication 800-
22rev1a.
Sekanina, L., Salajka, V., and Vaˇs´ıˇcek, Z. (2012). Two-step
evolution of polymorphic circuits for image multi-
filtering. In IEEE Congress on Evolutionary Compu-
tation, pages 1–8.
SHA-3, N. (2007). SHA-3 competition, announced
2.11.2007.
Soto, J. (1999). Randomness testing of the AES candidate
algorithms. NIST.
Stevanovi´c, R., Topi´c, G., Skala, K., Stipˇcevi´c, M., and
Rogina, B. M. (2008). Quantum random bit generator
service for Monte Carlo and other stochastic simula-
tions. In Lirkov, I., Margenov, S., and Wa´sniewski, J.,
editors, Large-Scale Scientific Computing, pages 508–
515. Springer-Verlag.
Sulak, F., Do˘ganaksoy, A., Ege, B., and Koc¸ak, O.
(2010). Evaluation of randomness test results for
short sequences. In Proceedings of the 6th inter-
national conference on Sequences and their applica-
tions, SETA’10, pages 309–319. Springer-Verlag.
Turan, M. S., Doˇganaksoy, A., and C¸. C¸ alik (2006). De-
tailed statistical analysis of synchronous stream ci-
phers. In ECRYPT Workshop on the State of the Art of
Stream Ciphers (SASC’06).
Ukrop, M. and
ˇ
Svenda, P. (2013). EACirc project,
https://github.com/petrs/eacirc.
ˇ
Svenda, P., Ukrop, M., and Maty´aˇs, V. (2013).
SeCrypt2013 paper – supplementary data,
http://www.fi.muni.cz/∼xsvenda/papers/secrypt2013/.
Webster, A. F. and Tavares, S. E. (1986). On the design of
S-boxes. pages 523–534. Springer-Verlag.
Wheeler, D. and Needham, R. (1995). TEA, a tiny encryp-
tion algorithm. In Fast Software Encryption, pages
363–366. Springer.
Yao, A. C. (1982). Theory and application of trapdoor
functions. In Proceedings of the 23rd Annual Sympo-
sium on Foundations of Computer Science, SFCS ’82,
pages 80–91, Washington, DC, USA. IEEE Computer
Society.
SECRYPT2013-InternationalConferenceonSecurityandCryptography
146
