
Behavior-based Malware Analysis using Profile Hidden Markov Models
Saradha Ravi, N. Balakrishnan and Bharath Venkatesh
SERC, Indian Institute of Science, Bangalore, India
Keywords:
Behavior-based Malware Analysis, Profile Hidden Markov Model, Multiple Sequence Alignment, Malware
Classification, Metamorphic Viruses, Clustering.
Abstract:
In the area of malware analysis, static binary analysis techniques are becoming increasingly difficult with
the code obfuscation methods and code packing employed when writing the malware. The behavior-based
analysis techniques are being used in large malware analysis systems because of this reason. In these dynamic
analysis systems, the malware samples are executed and monitored in a controlled environment using tools
such as CWSandbox(Willems et al., 2007). In previous works, a number of clustering and classification
techniques from machine learning and data mining have been used to classify the malwares into families and
to identify even new malware families, from the behavior reports. In our work, we propose to use the Profile
Hidden Markov Model to classify the malware files into families or groups based on their behavior on the host
system. PHMM has been used extensively in the area of bioinformatics to search for similar protein and DNA
sequences in a large database. We see that using this particular model will help us overcome the hurdle posed
by polymorphism that is common in malware today. We show that the classification accuracy is high and
comparable with the state-of-art-methods, even when using very few training samples for building models.
The experiments were on a dataset with 24 families initially, and later using a larger dataset with close to 400
different families of malware. A fast clustering method to group malware with similar behaviour following
the scoring on the PHMM profile database was used for the large dataset. We have presented the challenges in
the evaluation methods and metrics of clustering on large number of malware files and show the effectiveness
of using profile hidden model models for known malware families.
1 INTRODUCTION
With the pervasive use of the internet, a lot of ma-
licious programs or malware that spread across it,
pose a serious threat to the security of the systems.
There are a variety of malware that are in the forms
of viruses, trojans, worms and botnets. The malware
uses the software vulnerabilities and other social en-
gineering techniques to trick the users into running
them, so that they can spread.The anti-malware com-
panies receive thousands of sample files everyday, for
analysis. These files are usually the ones that the user
finds suspicious in his/her system, and whose func-
tionality they are not sure of. It is important that we
understand the operations that a particular malicious
program does, in order to asses the seriousness of the
threat and its malware family. We also notice the fact
that, new files that are uploaded are usually the vari-
ants of some malicious program that is already exist-
ing. Though the action of the malware would be very
similar, the signatures of the files may not match, even
for very close variants. This makes the signature-
based techniques fail for the metamorphic variants of
the malware. Static malware analysis focuses on clas-
sifying malware based on features directly extracted
from malware sample whereas dynamic analysis does
it based on the behavioral patterns of the malware.
Due to the increasing need, many automated mal-
ware analysis systems such as CWSandbox(Willems
et al., 2007), Anubis (Bayer et al., ) are being used.
In these systems, the uploaded malware programs are
executed in a controlled environment. The operations
performed by the program, characterized by the sys-
tem calls and their arguments, or the registry changes
are monitored carefully and logged. From these ex-
ecution logs, the reports are generated and the ana-
lysts go through them to assess the threat. But when
there are large number of programs, analysing them
manually becomes a tough job. It would be easy
if there is an automated way of classify a malware
into already existing families or report a new behav-
ior profile. A number of classification and cluster-
ing techniques from machine learning are used on the
behavior reports(Rieck et al., 2011)(Lee and Mody,
195
Ravi S., Balakrishnan N. and Venkatesh B..
Behavior-based Malware Analysis using Profile Hidden Markov Models.
DOI: 10.5220/0004528201950206
In Proceedings of the 10th International Conference on Security and Cryptography (SECRYPT-2013), pages 195-206
ISBN: 978-989-8565-73-0
Copyright
c
2013 SCITEPRESS (Science and Technology Publications, Lda.)

2006)(Bayer et al., 2010)(Apel et al., 2009). Once the
malware programs are grouped, we can then see what
the common behavior of that particular family of mal-
ware is and use them later for proactively mitigating
that threat beforehand in anti-malware software. In
our work, we address the problem of malware classifi-
cation and also clustering (based on similar behavior)
using profile Hidden Markov Models.
2 RELATED WORK
In this section, we will look at some of the related
work done in the behavior-based malware analysis
and classification. The dynamic analysis techniques
gained prominence because of the limitations in the
static analysis techniques (Moser et al., 2007).Moser
et al proposed a method where the normal model of
programs were modelled using sequences of six sys-
tem calls and any deviations from this was flagged
as anomaly or a security threat.This was one of the
first approachesof using behaviorto differentiate mal-
ware from benign programs. Bailey et al(Bailey et al.,
2007) tracked more abstract features like system state
changes rather than system call sequences for mal-
ware classification.
Different distance measures are used to find the
similarity within the files of the same malware family.
Some of them are appropriate for the given problem
whereas some are not, particularly when the order of
the activities in the behavior isn’t taken into consid-
eration. Lee et al propose a malware clustering ap-
proach where a modified Levenshtein distance is used
and a k-medoid partition clustering is performed(Lee
and Mody, 2006). The complexity of computing dis-
tances between malware in their method is quadratic
in the number of system calls and so expensive.
In more recent work(Bayer et al., 2010), Bayer et
al have employed faster approximate nearest neighbor
search using Locality Sensitive Hashing for compari-
son of the analysis reports with known behavior pro-
files that they have created (using data tainting meth-
ods to track system call dependencies). The behavior
reports are then clustered using hierarchical clustering
algorithm. Comparing the clusters to the true malware
clusters gave them 0.98 and 0.93, precision and recall
values.
The automatic classification system given by
Rieck et al was used to identify novel families of
unseen malware using clustering and assign new in-
stances of malware to these families by classification
using SVMs(Rieck et al., 2008). In this method proto-
types for each class of malware is generated and even-
tually used in the hierarchical clustering of the mal-
ware reports. The experiments for this work are con-
ducted on a larger dataset with close to 33000 reports
and a detailed study of resource utilization is also
done.Their malheur implementation gave F-scores,
around 0.95 for the clusters and 0.97 for the classi-
fication. In their previous work(Rieck et al., 2008),
the classification of malware using support vector ma-
chines is elaborated and the discriminative features in
behavior reports are analysed to explain classification
decisions. The authors also propose a new represen-
tation for the monitored behavior of malware(Trinius
et al., 2010). This representation is optimised to be ef-
ficient when applying machine learning and data min-
ing techniques.
Wagener et al (Wagener et al., 2008) propose a
dynamic analysis method where they couple a se-
quence alignment method to compute the similarities
and leverage the Hellinger distances. They also show
how the use of phylogenetic tree improves their clas-
sification method. The different distance measures
used when clustering similar malware behavior are
examined in a work by Apel eta al(Apel et al., 2009).
Their finding is that the Manhattan distance or some
similarity coefficient used on 3-grams of the report
contents, stored in tries or generalized suffix trees,
work the best.
To detect similarity in workloads from NFS traces
for storage systems, Neeraja et al (Yadwadkar et al.,
2010) have applied the PHMM on the opcode se-
quences of the NFS traces. They also observe that
very few training sequences for a particular type of
workload, was enough for modeling. In another work
(Attaluri et al., 2009), the profile HMM had been ap-
plied for x86 opcode sequences of the polymorphic
malware binaries generated by the commonly avail-
able virus kits. But they observe that the method
works for some families better than the others because
of the problems like subroutine permutation and the
code reordering.
3 PROPOSED APPROACH
3.1 Our Contribution
In this paper , it is shown that polymorphic malware
are better detected when we look at their behavior,
where we expect a certain common sequence of ac-
tions to be preserved, in spite of obfuscation in the
code. We choose PHMM mainly because it intuitively
fitted the kind of sequence search problem, which we
have in classifying malware behavior. The initial ex-
periments are done on a fairly diverse dataset that has
close to 24 families of malware and we see that the re-
SECRYPT2013-InternationalConferenceonSecurityandCryptography
196

sults are quite promising. The F-scores for most of the
classes considered,(including polymorphic families)
are above 0.96. This way, we show that the method
is comparable to some of the best of the techniques
used for this problem. Later we extend the exper-
iments on a larger and more varied dataset of mal-
ware infected files, which poses more challenges to
the analysis and grouping of similar files. The chal-
lenges are explained and the results of using PHMM
models on the dataset is also presented.
The Profile Hidden Markov Model is a probabilis-
tic approach that developed specially for modeling se-
quence similarity occurring in biological sequences
such as proteins and DNA(Eddy, 1998)(Durbin et al.,
1998). It is also a faster alternative to the traditional
deterministic approaches used in sequence matching
(Durbin et al., 1998). It is a modified implementa-
tion of HMM, which is basically a generative model
and constructs a probabilistic finite state machines.
For behavior-based analysis, we again assume that
there is a sequence of operations common for a virus
family and for a presented new sequence we would
like to find the best known match from the database.
Our approach to the classification problem employing
PHMM employs the following steps:
1. The behavior reports (which are XML files)
obtained from the dynamic analysis tool such as
CWSandbox(currently called the GFISandbox), can
be encoded using a more simpler representation such
as the MIST(Trinius et al., 2010). The MIST format
that we chose for experiments can be processed at dif-
ferent levels considering how much of system call ar-
gument information we look at. Refer to Fig. 4 for a
sample MIST encoding. We can also directly encode
every unique type of a system call to a particular al-
phabet in the range (A-T) and eventually the behavior
report looks like a protein sequence.
2. A small number of such sequences belonging to a
known malware family is givento a multiple sequence
alignment module to get an alignment file.
3. The multiple alignment file for a malware family is
used for constructing a profile hidden markov model
for that family. Many such HMM profiles can be com-
bined to create a malware profile database.
4. When a new malware file is given, it is again en-
coded as a sequence and searched for in the malware
profile database. The profile HMM gives a score for
the most similar malware families for that new se-
quence.The one with the highest score is taken as the
malware class prediction.
3.2 Methodology
The main reason for us to choose this approach for
solving the problem of finding malware similarity is
because the behavior of malware program has vari-
ablility, yet has a characteristic signature reflected in
the sequence of system calls. For example if we look
at the CWSandbox reports for two malware programs
from same family, we notice that a sequence of ma-
licious actions is preserved, interspersed with some
other actions introduced to confuse the malware de-
tection system.
A hidden markov model (HMM) is very suitable
for probabilistic modeling of such sequences, which
is evident from past works. Thus it can be used for
modeling different classes of malware. But as we
have discussed above , there might be additions, dele-
tions or changes to the system calls for different pro-
grams within same malware family. The profile HMM
is exactly designed to model this kind of problem,
because it also has non-emitting states or the delete
states. We would now outline the concept of profile
HMM before we proceed to show how it has been
used in our work.
3.3 Hidden Markov Models
A hidden markov model(HMM) is a statistical tool
which captures the features of one or more sequences
of observable symbols by constructing a probabilis-
tic finite state machine with some hidden states that
are emitting the observed symbols (Rabiner, 1989).
When the state machine is trained, its graph and the
transition probabilities are computed such that they
best produce the training sequences. When we test
with a new sequence, the HMM gives a score for how
best the sequence matched with the known state ma-
chine. In our case, the observed symbols are the codes
for each unique system call in the behavior report of
the malware program(MIST codes).
An HMM is specified by the following parame-
ters.
• the alphabet of symbols Σ
• the hidden state set Z
• the emission probability matrix E
|Z|x|Σ|
• the state transmission matrix A
|Z|x|Z|
• the initial state distribution π
Thus the HMM λ can be written as λ = (Σ,Z,A,E,π).
This model can thus be used to assign a probability to
an observed sequence X as follows
P(X|λ) =
∑
z
∏
k
A
z
k
,z
k+1
E
z
k
,X
k
(1)
This probability as indicated by the formula, is that of
emitting the observation sequence X after all possible
Behavior-basedMalwareAnalysisusingProfileHiddenMarkovModels
197
state transitions (i.e state transmission sequences). of
the model λ.
The model λ has to be learnt from training data
consisting of independent and identically distributed
sequences. This can be done by maximizing the
probability P(T|λ) where T is a training sequence.
There is no analytical solution to this, however this
can be done by using an iterative procedure that uses
E-M (Expectation-Maximization) algorithm(Rabiner,
1989).
Given a sequence X, the Viterbi algo-
rithm(Rabiner, 1989) can be used to compute
the hidden state Z, so as to maximise P(Z|X) i.e
determine most probable sequence of hidden states
that produced the observed sequence. Equation 1 can
then be evaluated using the likelihood and P(X) got
using the forward and backward procedures (Rabiner,
1989).
3.4 Profile Hidden Markov Model
A PHMM is a specific formulation of a standard
HMM that makes explicit use of positional informa-
tion contained in the observation sequences(Attaluri
et al., 2009). PHMM is a strongly linear left-right
model while HMM is not(Eddy, 1998). A PHMM
model allows null transitions, so that it can match se-
quences that differ by point insertions and deletions
happening by chance mutations. They were specifi-
cally formulated for use in bioinformatics,where such
insertions and deletions to DNA sequences were natu-
ral during evolution. Thus PHMMs can be seen effec-
tive in modeling metamorphic malware, that also go
through similar kind of evolution, both at binary level
and at a behavioral level. Furthermore, PHMM state
transition matrices are essentialy sparser than those of
HMM, allowing quicker inference.
A central concept to note here is that of sequence
alignment. In DNA sequencing, multiple gene se-
quences which are significantly related are aligned.
The alignment can be used to ascertain if the gene
sequences where diverging out from some common
ancestor. Now, for an unknown sequence, this mul-
tiple sequence alignment of a profile, can be used to
determine if the sequence is related to it or not.
A pairwise alignment of two sequences yields a
pair of sequences of equal length that captures the
difference between the two original sequences by in-
serting ‘-’ or gaps. The global alignment is an align-
ment such that the matches are maximised and the
insertions/deletions are minimised(Needleman et al.,
1970). The local alignment problem tries to locate
two longest subsequences from each sequence, such
that they are similar. This can be extended to align
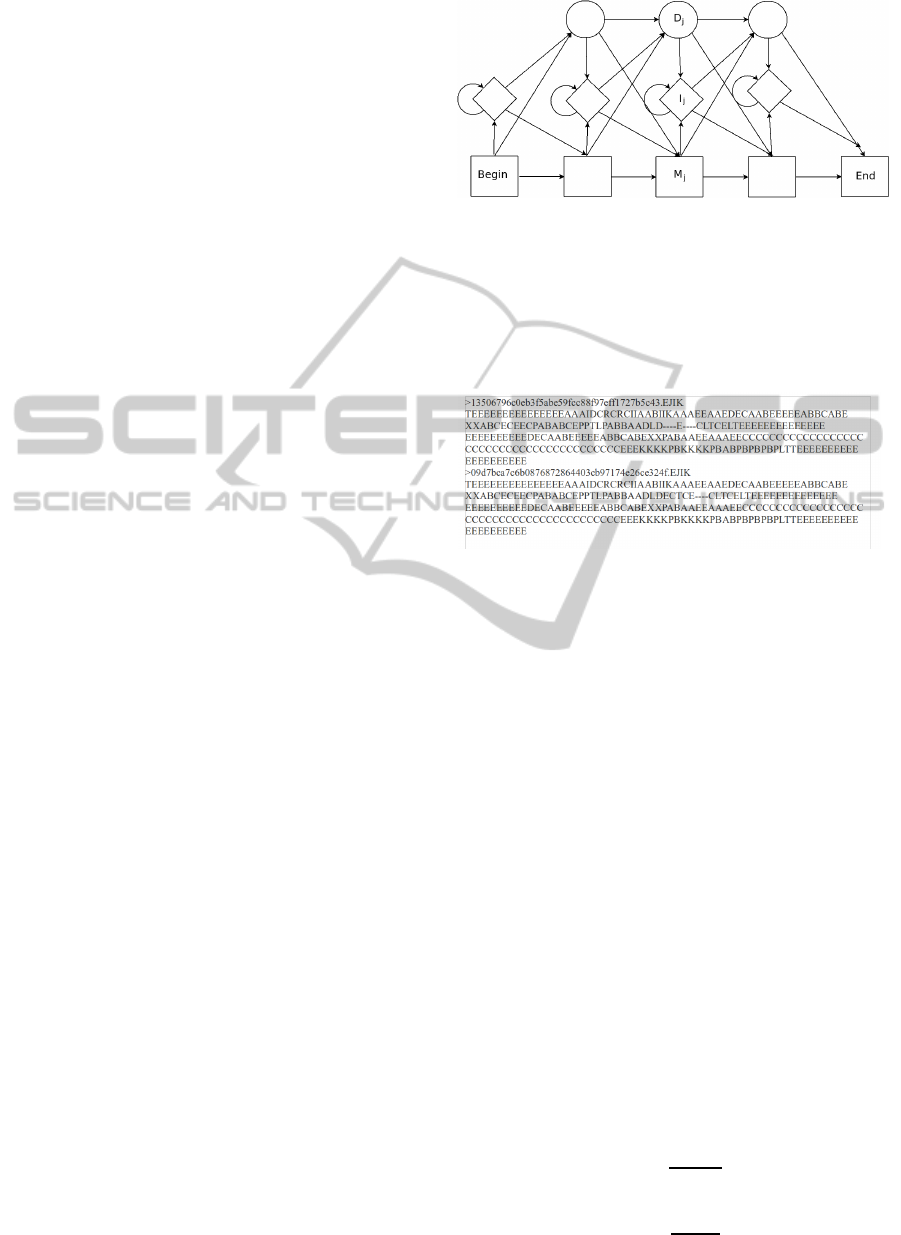
Figure 1: The transition structure of a profile HMM. For
example, from an insert state (diamond), we can go to the
next delete state (circle), continue in the insert state (self
loop) or go to the next match state (rectangle). Note that
while multiple sequential deletions are possible by follow-
ing the circle states, each with a different probability, mul-
tiple sequential insertions are only possible with the same
probability(Yadwadkar et al., 2010).
Figure 2: A sample MSA file for EJIK Malware Sequences.
multiple sequences. This multiple sequence align-
ment represents a family of similar sequences, where
some subsequences are conserved in all. While effi-
cient dynamic programming based solutions exist to
pair alignment, multiple alignment scales as O(n
r
) in
both time and space. This makes it prohibitively ex-
pensive for implementation.
MUSCLE is a freely available program used com-
monly for MSA. It uses fast distance estimation using
k-mer counting, a progressive alignment using a new
profile function, and refinement using tree dependent
restricted partitioning method(Edgar,2004). We have
used MUSCLE for generating the MSA files in the
*.afa format. The MSA step essentially serves as a
training phase where we align sequences of selected
few malware reports in each class, in our approach
to using PHMM. The Viterbi algorithm, forward-
backward procedure and Expectation-Maximization
are naturally extended to PHMMs. In PHMM, the
emission probabilities are position dependent unlike
in standard HMM. Learning a profile HMM from data
involves computing the emission probability matrix E
and the state transition probability matrix A using the
multiple sequence alignment data. These are given by
A
uv
=
N
A
uv
∑
v
N
A
uv
(2)
A
uv
=
N
E
ut
∑
t
N
E
ut
(3)
SECRYPT2013-InternationalConferenceonSecurityandCryptography
198
Where N
A
uv
represents the number of transitions
from the state u to v and N
E
uv
, the number of emis-
sions of t given a state u.(Durbin et al., 1998) After
the model λ has been learnt from the training multiple
alignment data, the problem of identifying the family
that a new sequence X belongs to, is decided by the
rule
y(X) = argmax
k
P(X|λ
k
) (4)
HMMER(Eddy, 2003) is an open source imple-
mentation of PHMM and its architecture gives flex-
ibility in deciding between local and global align-
ments. It is a very powerful tool and can used to
perform operations like building HMM profiles from
MSA, compressing a HMM profile database for effi-
ciency and for searching the most matched profile for
a new sequence. We have used hmmer for building
HMM profiles for all malware families and for search-
ing the ‘best suited’ profile for new sequences, that are
essentially the malware reports in the test dataset.
4 INITIAL EXPERIMENTS
The initial experiments are conducted on the pub-
licly available dataset that comprises of behavior re-
ports generated by CWSandbox, for nearly 3130 mal-
ware binaries collected over three years from many
sources(Trinius, 2009). The malware files in this
dataset were annotated by choosing the majority of
the labels given independently by six different anti-
virus products. Each malware family has a number of
files ranging from 30 to 300. The details of the ref-
erence dataset that we have used for our experiments
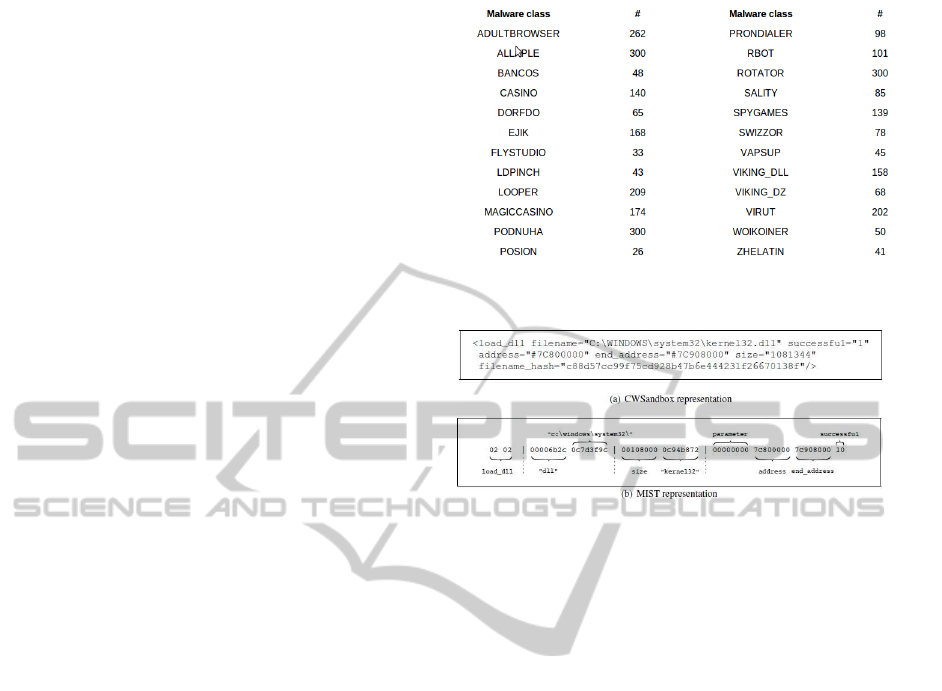
is shown in Figure 3. The reports are available in the
MIST format too. For our experiments, we consider
only the MIST Level 0 in the reports.That is, we look
at only the system call type and not the argument val-
ues. This level is actually sufficient for discrimination
of various classes of malware.
The MIST Level 0 reports have close to eighty five
different mist codes or system call operations, out of
which some 20 operations are very frequent. A sam-
ple MIST instruction for a CWSandox reresentation
is shown in Fig 4. Now we map every category op-
eration code with a unique alphabet in the range [A-
T]. The remaining category operation codes are also
mapped to alphabets in the accepted range.This fa-
cilitates the sequence representation to be compatible
with the protein sequence format such as the FASTA
or the STOCKHOLM formats.
Now for every family of malware, say Allaple,
we choose few (typically between 5-20) files and add
their sequence representation to FASTA (*.fa) file.
This FASTA file with the sequences is given to the
Figure 3: The different malware families and the number of
files in each, as in Malheur reference dataset(Trinius, 2009).
Figure 4: Sample of MIST representation of a portion of
CWSandbox report(Trinius et al., 2010).
multiple sequence alignment module and the output
is an aligned FASTA (*.afa), which has the multiple
alignment. The alignment file for that malware family
is now given to the hmmbuild step in hmmer, which
now creates a profile HMM for the class.This is done
for all the families of malware. The malware profile
database is the concatenation of all the HMM profiles
created for the known malware families in hand.
Presented with an unknown malware instance, we
convert the MIST encoded file to a FASTA sequence
file. The hmmsearch operation of the hmmer triggers
a search on the profile database. The result of the
hmmsearch operationgives the scores for the different
malware families profiles, that were closely related to
the presented sequence. The score values for the over-
all sequence match and best domain matches are ob-
tained. Choosing the family which gets the maximum
score, gives the classification result. The score differ-
ences between the families can also help us get some
insight into how close the match was, to each of it.
The hmmsearch operation takes longer time
for identifying very long sequences with more
than 50000 operations in a single report. Mul-
tiple sequence alignment and hmmsearch opera-
tions were run on a system with quad-core Intel(R)
Xeon(R)E5440 @ 2.83GHz processor with 32GB of
RAM. Some sequences in the family SALITY were
too long and we haven’t used them for testing in our
experiment. But we plan to look at how to handle
such sequences in our future work.
Behavior-basedMalwareAnalysisusingProfileHiddenMarkovModels
199
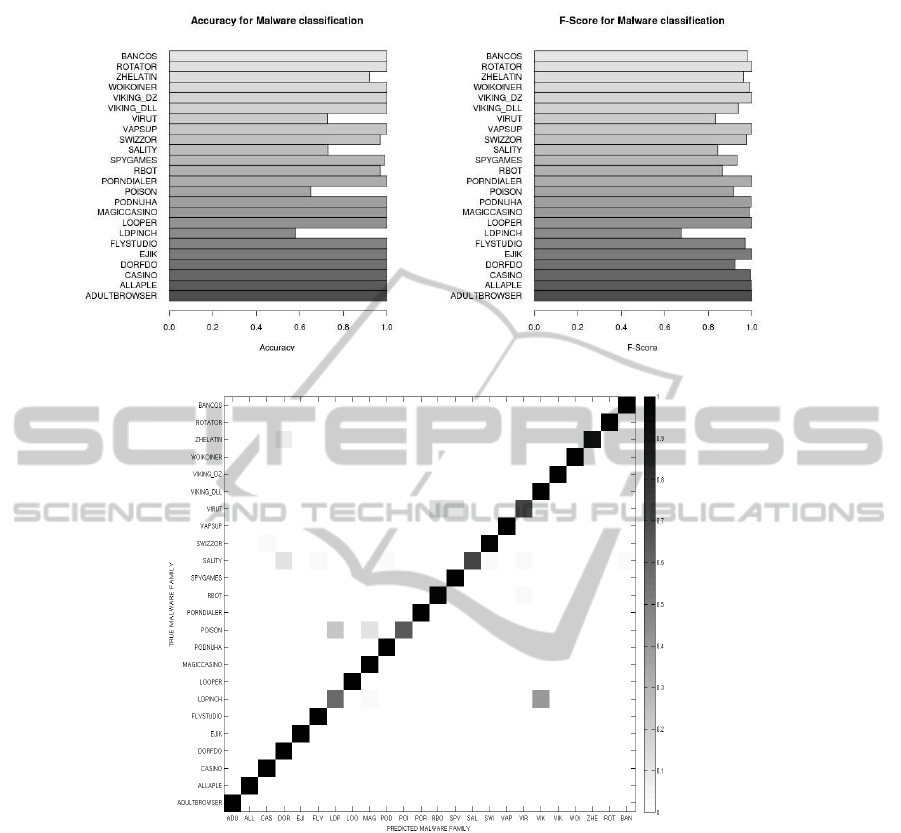
(a) Histogram of classification accuracy (b) Histogram of F-scores
(c) Confusion matrix for malware classification
Figure 5.
5 RESULTS
5.1 On the Reference Dataset
We already saw that, around 5 to 20 files are used to
construct the profile HMM for every malware family
considered. The testing set consisted of the remaining
files in the dataset(Trinius, 2009). The predictions of
the HMM for all the malware programs spanning the
24 families is given in the form of a confusion matrix
in Figure 5(c). We see that the overall accuracy for the
dataset is around 95% and the classification accuracy
for most of the classes is close to 100%. This shows
that our approach is comparable with the state-of-the-
art approaches as the Malheur(Rieck et al., 2011), in
terms of prediction accuracy.
The overall accuracy rate over the entire dataset
is about 0.964. The accuracy of classification for ev-
ery class of malware is shown as a histogram in the
Figure 5(a). We see that for most of the classes the
accuracy is close to 1.0. For classes such as Allaple,
which is polymorphic, all 300 instances were classi-
fied correctly. It was noticed that the scores given for
the dominating profile or malware class was very high
when compared to all other closely matched profiles.
Also, whenever there was misclassification, the dif-
ference in the scores for the closely matched profiles
is small.
SECRYPT2013-InternationalConferenceonSecurityandCryptography
200

The Figure 5b) shows a plot of the F-scores ob-
tained for the classification results. The average F-
score taken over most of the classes are more than
0.96 and there are families like Looper, Adultbrowser
etc. with values 1.0. We would like to compare this
with results from (Rieck et al., 2011)and (Bayer et al.,
2010) which give average F-scores of about 0.88 and
0.97 respectively.
The confusion matrix for the multi-class predic-
tion of malware families is presented in the Figure
5(c). By observing this matrix we see how the diago-
nal blocks are dark,owing to high prediction accuracy.
There are lighter grey blocks outside the diagonal re-
flecting the proportion of files that were misclassified
for every target malware family. The confusion plot
gives us some insight on how closely related different
families are.
For some classes like Ldpinch, owing to the small
size of the reports and high variability, the accuracy is
low. Programs of the family virut and rbot are very
close in the behavior pattern which is reflected in the
accuracy.
5.2 Challenges of the Previous
Approaches
We wanted to extend our approach on larger col-
lection of malware to show its usefulness in real-
time malware analysis, motivated by the initial re-
sults. The publicly available malheur application
dataset(Trinius, 2009) has close to about 400 differ-
ent families of malware reports available, on which
we wanted to test our approach and do a comprehen-
sive study.
It is known that there are many challenges in the
analysis on such large and varied dataset when us-
ing the PHMM approach. To encode a broader range
of MIST instructions, a better and efficient encoding
scheme was required. The encoding also had to take
into account the larger range of malware classes that
had to be analysed. Since there are many classes of
malware with just very few (1 to 3) instances available
for analysis, a pure classification approach may not
be very suited. So we resort to a clustering approach
that would work on the PHMM scores that we obtain
for every malware report against stable malware pro-
files. If we assume the malware family name given
by an antivirus as the ground truth, then the cluster
size distribution for the labeling is still skewed. The
reference dataset that was used in our initial exper-
iments has a few shortcoming when evaluating the
performance of any methodology. The behaviour of
different classes of malware in the dataset were dis-
tinct from one another. As pointed in a work by Li
et al (Li et al., 2010) , most of the discriminative
classification models built on such datasets give good
results and the effectiveness of one method over an-
other does not account for the intrinsic characteristics
of a malware. In the same work it is been analysed
that biased cluster size distribution in the dataset re-
duces the significance of a high precision and recall
of the clustering results of the malware as observed
in the dataset used for a fast scalable clustering ap-
proach(Bayer et al., 2009). Also the issue of inconsis-
tency in the labels used for this evaluation across dif-
ferent anti-virus vendors renders the evaluation met-
ric not so effective. It is pointed that even a plagia-
rism detection software gave comparable results for
the dataset and metrics while still the LSH based clus-
tering technique considered in (Bayer et al., 2009) is
far more scalable. In essence, our analysis empha-
sizes on the clustering of malware mainly based on its
behaviour that we obtain and study of malware evolu-
tion on this large dataset using the PHMM approach.
6 DETAILED EXPERIMENTS
We present the details of experiments in testing the
usefulness of PHMM to create malware family pro-
files and how one can use the PHMM scores to cluster
a large set of malware instances. The malware analy-
sis using this approach involves the following steps.
1. We choose to use the MIST(Trinius et al.,
2010) approach for representing the instructions of
the CWSandbox report.
2. The MIST 0 level is what we have used for the cur-
rent experiments. In future, we will consider using the
arguments of the MIST instructions too (higher mist
levels).
3. Since the number of unique instructions in the
MIST set is more than the number of legitimate alpha-
bets in the protein encoding(20), we choose to use an
efficient encoding algorithm which will be described
in the following subsection.
4. The choice of the malware instances to create the
family’s PHMM profile was an important question
that arose. We have addresed the issue, by choosing
the most variable sequences in terms of the sequence
length and malware behaviour.
5. As in the previous experiment, the subsequent steps
are the MSA of the chosen sequences and building
of the HMM profiles for those families that we have
enough samples of.
6. The new unseen sequences of all the malware in-
stances are scored against the profile database. The
resulting scores for the top scoring families(above an
inclusion threshold) are then normalised across all
Behavior-basedMalwareAnalysisusingProfileHiddenMarkovModels
201

known families in the database.
7. This normalised vector is then used for clustering
the malware into families. We have used a fast re-
peated bisection method for clustering the set of mal-
ware reports.
6.1 Encoding the Behaviour Reports
The behaviour reports of the malware dataset(Trinius,
2009) are encoded using the MIST codes as in the
paper(Trinius et al., 2010). When converting this en-
coding to that of the protein sequences we have fewer
codes to represent a larger set of MIST instructions.
We resorted to use the huffman encoding algorithm
for the same. The encoding gives shorter alphabet
code for more frequent instructions and longer codes
for the rare ones in the behavior reports. This gave
us a nice encoding that will ensure that the sequences
are not too long and hence easing the complexity in-
volved in multiple sequence alignment step.
6.2 Incremental Setting for the Detailed
Experiments
The dataset that we used for the detailed experiments
mainly focuses on the analysis of the malware fami-
lies that exhibit varied behaviour across samples. The
malheur application set has malware files spanning
over 403 families, among which, around 146 fami-
lies have more than three samples each. To see how
an incremental analysis can be done, we did a profile
creation for about 130 families and the malware be-
longing to these families were scored over the profile
database. This covered about 7700 files whose preci-
sion and recall was about 0.67 and 0.46 respectively.
In the incremental step, we add the PHMM pro-
files for 15 more prominent families to the database.
The total number of files in the dataset is around
18990 and the reports of all the 400 families of mal-
ware are presented for scoring and later clustering us-
ing a fast recursive bisection method. The vectors
of PHMM scores for each report is normalised and
the cosine similarity measure was used for cluster-
ing. The recursive bisection algorithm is very fast
and the clustering results for nearly 19000 malware
reports was available in less than one minute. This is
of a great advantage in malware analysis where thou-
sands of files are typically getting uploaded everyday
for analysis.
The classification results for some of the initially
seen samples from newly added families (in the in-
cremental) can be explained with the help of phylo-
genetic analysis that will be introduced in the coming
section. It is assumed that, at some point of time the
phylogenetic analysis on the aligned MIST sequences
helps us discover a new class of malware branching
steadily from an existing family. Once that discov-
ery is done, the exemplary samples of the new family
is used for building its own profile and the database
is updated. However, completely new families of
malware generally do not surface on the web so fre-
quently as the polymorphic variants or extensions of
already existing families of malware.
6.3 What is Phylogeny
The phylogenetic analysis is usually done in the field
of evolutionary biology to find the hierarchical rela-
tionships between the organisms belonging to differ-
ent taxonomic groups that form the leaves in the tree.
The physical or the genetic characeteristics are used
for the same. The cladograms or the phylogenetic
trees are constructed with the branch lengths repre-
senting the evolutionary distance between the organ-
isms in consideration.
The trees can be built from two forms of the ge-
nomic data. They are the distance matrices for the
genetic sequences and the molecular data compris-
ing the aligned sequences themselves. The distance
methods build the phylogenetic tree by clustering the
sequences based on their distances obtained from the
matrix, in an iterative manner. Character-based tree
building methods can use both types of data, and
search for the best hierarchical tree from a set of pos-
sible tree topologies. They are slower than the dis-
tance methods as they come with optimality guaran-
tees, but there are heuristics that speed up the process.
6.4 Malware Phylogeny from Our
Experiments
The tool ClustalW was used for phylogenetic anal-
ysis of the encoded MIST sequences of the mal-
ware. It takes in the prealigned homologous se-
quences, initially computes rough distance matrices
based on pairwise alignment scores. It then uses a
simple Neighbor-Joining clustering method to clus-
ter the leaves of the tree under branches. In biology,
the homologous sequences refer to the nucleic acid or
protein sequences that are similar because they have
a common evolutionary origin. The phylogenetic tree
for the families Virut and Kies is shown in Figure 6.
The initially seen few samples of Virut were misclas-
sified as Kies and it is seen that the tree reflects the
common behaviour that they share. A similar tree
for the families Palevo and Buzus is shown in Fig-
ure 7. Palevo was a worm that surfaced in 2009 and
it opens a back door on the compromised computer
SECRYPT2013-InternationalConferenceonSecurityandCryptography
202
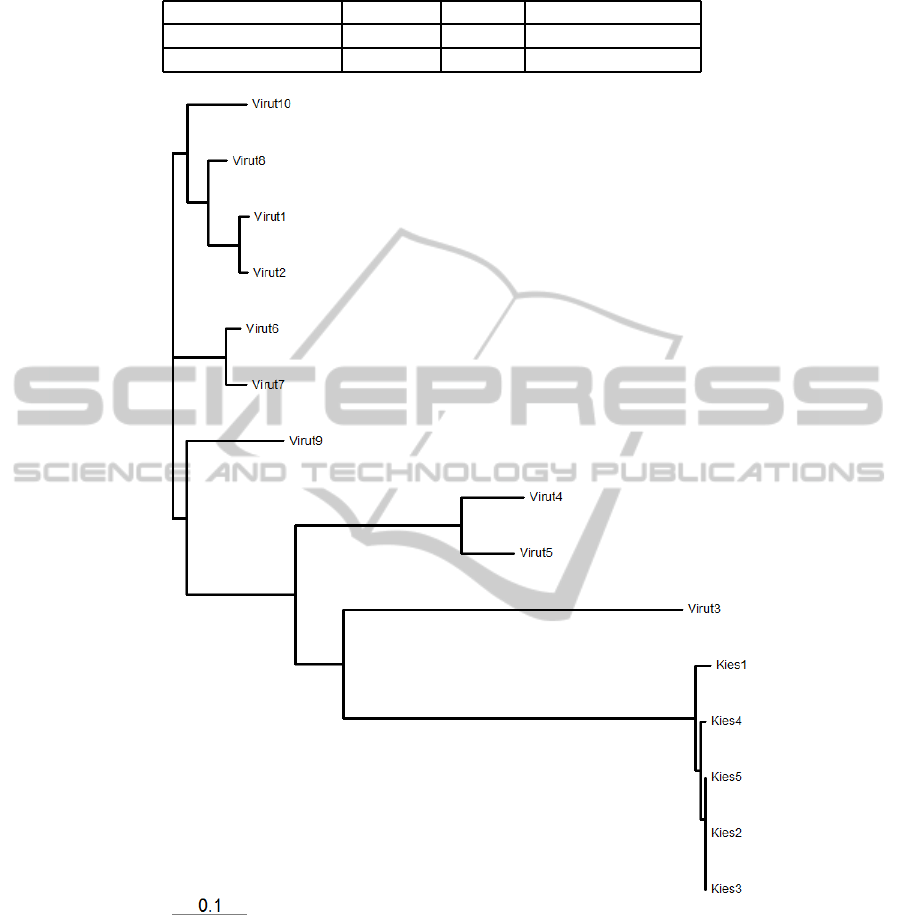
Table 1: Malware Clustering Comparision.
Features Precision Recall Number of clusters
PHMM Scores 0.7058 0.3106 400
4-gram frequencies 0.7000 0.3700 400
Figure 6: Phylogenetic tree for Virut and Kies.
and attempts to connect to the following IRC server
to receivecommands and the Buzus shared similar be-
haviour too. The length of the branches in the tree re-
flects the genetic distance between aligned sequences.
This distance is usually defined as the fraction of mis-
matches at aligned positions, with gaps either ignored
or counted as mismatches.
6.5 Analysis of the Results
The distribution of files over the different families of
viruses is very skewed, with popular polymorphic
viruses like Allaple, Texel, Swizzor with over 1000
samples and nearly 200 classes of viruses with just
one sample each. From a little bit of analysis into
the behaviour profiles, it was observed that some of
the majority classes like Basun had a stable behaviour
pattern with minimal variations and constituted a third
of the malware collection itself. With such a distribu-
tion in the data, a high precision and recall may not
help us distinguish the effectiveness of one method
over another. So for our study and comparison, we
Behavior-basedMalwareAnalysisusingProfileHiddenMarkovModels
203
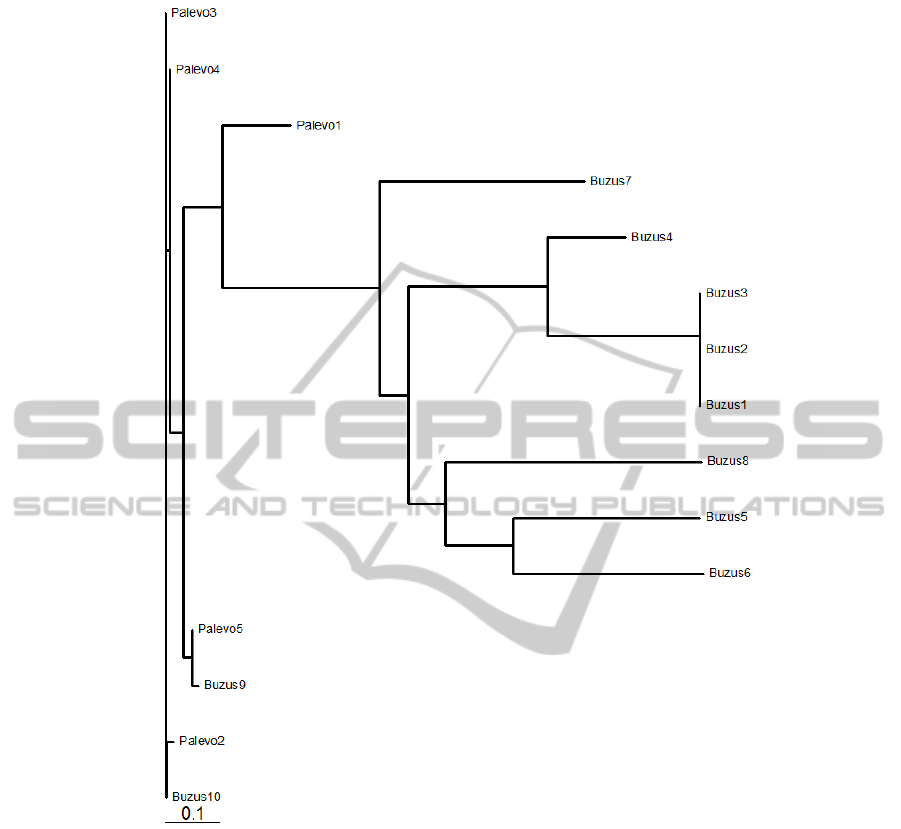
Figure 7: Phylogenetic tree for Palevo and Buzus.
have used the malware families with the most vari-
able behaviour across instances, forming the majority
of the samples used in the study for comparison. The
typical example is the class of viruses called Texel. It
has many aliases used in the antivirus companies and
has a varying behaviour. It behaves like a virus be-
cause of its self replicating nature. Some instances
of Texel may frequently pop up advertising messages
to interrupt computer users, while more severely they
may destroy the data in computers. The lower re-
call and higher precision in the clustering obtained
from PHMM features is because the Texel files have a
varied behavior forming different clusters of big and
small sizes. The cluster distribution for the top fif-
teen clusters are shown in the Fig.8. It is seen that
the clusters are pure and that the cluster size distribu-
tion obtained is not very skewed. The results show
that the performance of our methodology is compa-
rable with the state-of-the-art, even when using very
few sequences to actually model a behaviour profile.
PHMM also gives the advantage of lesser complexity
in merging profiles or aligning extra sequences to an
existing profile, when new variants appear or taxon-
omy changes.
7 FUTURE WORK
AND CONCLUSIONS
We have explored the approach of using profile hid-
den markov model for the problem of malware clas-
SECRYPT2013-InternationalConferenceonSecurityandCryptography
204
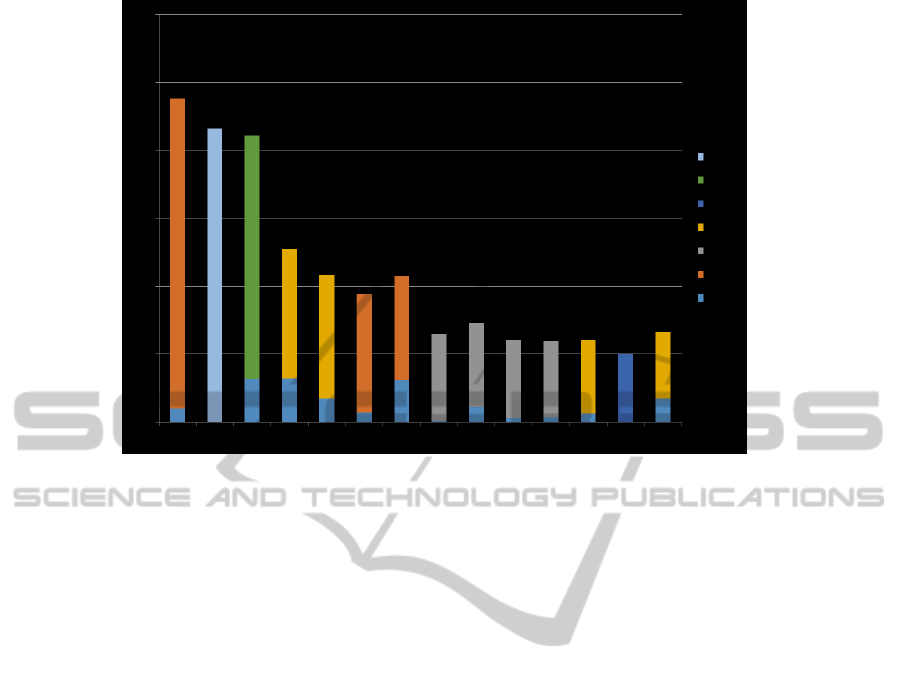
Figure 8: Clustering Results - Top 15 clusters.
sification based on behavior reports. This approach
was considered because of the inherent similarity of
the metamorphism in malware to that of the muta-
tions in gene or protein sequences. The results are
quite assuring of a high classification and clustering
performance, even when very few training instances
available for building models. We would like to ex-
tend this approach for identifying new unseen mal-
ware families and to distinguish benign files in our
future work that would empower us to design a com-
plete malware triage system. The methods of speed-
ing up the algorithms in the profile HMMs can also
be explored,when employing in large scale malware
analysis.
REFERENCES
Apel, M., Bockermann, C., and Meier, M. (2009). Mea-
suring similarity of malware behavior. In Local Com-
puter Networks, 2009. LCN 2009. IEEE 34th Confer-
ence on, pages 891–898. IEEE.
Attaluri, S., McGhee, S., and Stamp, M. (2009). Profile hid-
den markov models and metamorphic virus detection.
Journal in computer virology, 5(2):151–169.
Bailey, M., Oberheide, J., Andersen, J., Mao, Z., Jahanian,
F., and Nazario, J. (2007). Automated classification
and analysis of internet malware. In Recent Advances
in Intrusion Detection, pages 178–197. Springer.
Bayer, U., Comparetti, P. M., Hlauschek, C., Kruegel, C.,
and Kirda, E. (2009). Scalable, behavior-based mal-
ware clustering. In Network and Distributed System
Security Symposium (NDSS). Citeseer.
Bayer, U., Kirda, E., and Kruegel, C. (2010). Improving the
efficiency of dynamic malware analysis. In Proceed-
ings of the 2010 ACM Symposium on Applied Com-
puting, pages 1871–1878. ACM.
Bayer, U., Kruegel, C., and Kirda, E. Anubis: Analyzing
unknown binaries.
Durbin, R., Eddy, S. R., Krogh, A., and Mitchison, G.
(1998). Biological sequence analysis: probabilistic
models of proteins and nucleic acids. Cambridge uni-
versity press.
Eddy, S. (2003). Hmmer: profile hmms for protein se-
quence analysis. http://hmmer.janelia.org/.
Eddy, S. R. (1998). Profile hidden markov models. Bioin-
formatics, 14(9):755–763.
Edgar, R. C. (2004). Muscle: multiple sequence align-
ment with high accuracy and high throughput. Nucleic
acids research, 32(5):1792–1797.
Lee, T. and Mody, J. J. (2006). Behavioral classification. In
EICAR Conference.
Li, P., Liu, L., Gao, D., and Reiter, M. (2010). On
challenges in evaluating malware clustering. In Re-
cent Advances in Intrusion Detection, pages 238–255.
Springer.
Moser, A., Kruegel, C., and Kirda, E. (2007). Limits of
static analysis for malware detection. In Computer Se-
curity Applications Conference, 2007. ACSAC 2007.
Twenty-Third Annual, pages 421–430. IEEE.
Needleman, S. B., Wunsch, C. D., et al. (1970). A gen-
eral method applicable to the search for similarities in
the amino acid sequence of two proteins. Journal of
molecular biology, 48(3):443–453.
Rabiner, L. R. (1989). A tutorial on hidden markov models
and selected applications in speech recognition. Pro-
ceedings of the IEEE, 77(2):257–286.
Rieck, K., Holz, T., Willems, C., D¨ussel, P., and Laskov, P.
Behavior-basedMalwareAnalysisusingProfileHiddenMarkovModels
205

(2008). Learning and classification of malware behav-
ior. Detection of Intrusions and Malware, and Vulner-
ability Assessment, pages 108–125.
Rieck, K., Trinius, P., Willems, C., and Holz, T. (2011). Au-
tomatic analysis of malware behavior using machine
learning. Journal of Computer Security, 19(4):639–
668.
Trinius, P. (2009). Malheur Dataset. http://pi1.informatik.
uni-mannheim.de/ malheur/ #dldata.
Trinius, P., Willems, C., Holz, T., and Rieck, K. (2010).
A malware instruction set for behavior-based analy-
sis. In Proceedings of 5th GI Conference Sicherheit,
Schutz und Zuverl assigkeit, Berlin, Germany.
Wagener, G., State, R., and Dulaunoy, A. (2008). Mal-
ware behaviour analysis. Journal in computer virol-
ogy, 4(4):279–287.
Willems, C., Holz, T., and Freiling, F. (2007). Toward au-
tomated dynamic malware analysis using cwsandbox.
Security & Privacy, IEEE, 5(2):32–39.
Yadwadkar, N. J., Bhattacharyya, C., Gopinath, K., Niran-
jan, T., and Susarla, S. (2010). Discovery of applica-
tion workloads from network file traces. In Proceed-
ings of the 8th USENIX conference on Fileand storage
technologies, pages 14–14. USENIX Association.
SECRYPT2013-InternationalConferenceonSecurityandCryptography
206
