
Emerging Trends in Local Governments Web Strategies
Citizen Web Empowerment Assessment in Italy
Elena Bellio and Luca Buccoliero
CERMES, Department of Marketing, Bocconi University, Via Roentgen 1, 20136 Milano, Italy
Keywords: Citizens, Empowerment, Participation, Public Administrations, Web 2.0, Web Portals.
Abstract: The “Internet revolution” has deeply impacted relations on every context of exchange of goods and services.
Nowadays, citizens are aware of this historic change that is taking place and they are the bearers of a new
demand in terms of: access to official, customized and “on demand” information and services, new
opportunities for direct and informal relationships with politicians and civil servants, acquiring a proactive
role within the network.
This paper assesses the web strategies of Italian municipalities to measure their “citizen empowerment”
effectiveness. The study was performed by adopting a revised version of the Citizens Web Empowerment
Index (CWEI) designed to benchmark administrations’ official web portals. The analysis was made on the
web portals of the 104 Italian cities with over 60,000 inhabitants in 2012 and 2013. Results show that there
is still a general lack of strategy to strengthen citizens’ level of empowerment and participation through
official web portals.
1 INTRODUCTION
How to assess and benchmark the web strategies of
municipalities in term of their “citizen
empowerment” effectiveness? How to measure the
improvement of the “empowerment effectiveness” in
Italian municipalities?
Citizen empowerment, markedly tied in with the
spread of the Internet and technological resources as
part of our daily lives (in which the Internet is now
‘embedded’), represents one of the major challenges
that public systems face today.
Our proposed definition of “citizen
empowerment” is the following: citizens are today
the bearers of new demands, which can be
summarized as follows:
a) access to official, customized and “on demand”
information and services;
b) new opportunities for direct and informal
relationships with politicians and civil servants;
c) willingness to be “active players” within the
network, also by sharing their own problems and
complaints with others and seeking information
on experiences of others with the same problems;
Web 2.0 logic (O'Reilly, 2005) has considerably
amplified this latter development. (Bellio and
Buccoliero, 2013)
As web sites and portals are the strategic tool needed
to meet this growing empowerment demand, their
design has moved from a technology-centric vision
to a content-centric one and, more recently, to a
citizen-centric approach (King and Cotterill, 2007).
The impact of ICT on urban environments
governance and planning is typically linked with
challenging problems. A successful city must
balance social, economic and environmental needs
but it should also put the needs of its citizens at the
forefront of all its planning activities. A "smartcity”
makes conscious efforts to adopt innovative ICT-
based solutions to improve conditions of living and
working and to support a more inclusive, and
sustainable urban environment. The strategy is built
on the principles to use technologies to improve the
City and to empower its citizens by making them
active players in the decision making process. In the
Web 2.0 age, Internet represents the key tool of this
strategy (Bellio and Buccoliero, 2013).
This paper describes a methodological
framework for the assessment of citizen
empowerment provided by municipalities’ web sites
and analyses the trend of citizen web empowerment
in a sample of Italian municipalities in the years
2012 and 2013. In section 2, a review of relevant
256
Bellio E. and Buccoliero L..
Emerging Trends in Local Governments Web Strategies - Citizen Web Empowerment Assessment in Italy.
DOI: 10.5220/0004528902560263
In Proceedings of the 4th International Conference on Data Communication Networking, 10th International Conference on e-Business and 4th
International Conference on Optical Communication Systems (ICE-B-2013), pages 256-263
ISBN: 978-989-8565-72-3
Copyright
c
2013 SCITEPRESS (Science and Technology Publications, Lda.)

literature is shown. In section 3, the research
framework and results are presented. In section 4,
some managerial implications of the study and
future research developments are discussed.
2 BACKGROUND AND RELATED
WORKS
According with Richards (Richards, 2010), Web
communication platforms, such as blogs, wikis, and
social networks have allowed average users to
change from passive receivers of information to
active producers of information (Budin, 2005).
These tools and the ways that they have empowered
individuals to take control of their Internet
experiences have been categorized as Web 2.0
technology (Pachler and Daly, 2009).
Tim O'Reilly has first attempted to provide a
clear definition of web 2.0: “Web 2.0 is the business
revolution in the computer industry caused by the
move to the Internet as a platform, and an attempt to
understand the rules for success on that new
platform. Chief among those rules is this: “Build
applications that harness network affects to get
better the more people use them” (O'Reilly, 2007).
The identified key points are:
1. User participation. The web should be the
medium that enables its users to participate and
share information. The services offered are
developed under the open-source paradigm,
where users’ interaction is a source of
development and growth for the site.
2. Transformation of data (‘remixability’).
‘Remixability’ stems from the desire of users and
developers to be able to use and share
information and then process and change it by
developing new concepts and ideas.
3. Design centered on the user’s needs
It is increasingly important to understand not only
how Web 2.0 tools work, but also how the sharing
and distribution of information through these tools
can promote civic engagement (Budin, 2005).
It has been a long time since public
administrations have begun to investigate the
potential of Web 2.0 to improve service delivery,
democratic responsiveness and citizen participation
(Fountain, 2001). According with European
Commission (Ala-Mutka et al., 2009): “public sector
institutions are beginning to recognise the need to
shift to services that are closer to people’s everyday
lives, to use innovative tools to reach citizens and to
better engage employees and to share information
and knowledge within and between organisations
(Berce et al., 2006). Also, public institutions are
increasingly making use of collective intelligence
and user-generated content to encourage real-time
interaction and facilitate participation (Dutton and
Peltu, 2007) Social Computing-enabled governance
mechanisms could enhance collaboration within
government agencies and interaction with
stakeholders, transforming processes into more
user-centric, cost-effective solutions and bringing
public value to end-users (DiMaio et al., 2005);
(Osimo, 2008).
A recent study (Assar and Boughzala, 2013)
emphasizes that the current objective is to provide
online services customized to match users' profiles
and requirements, and to personalize the
relationships users have with public institutions. The
emergence of Web 2.0 and rise of social networks
have revealed new perspectives that challenge public
institutions. These institutions are particularly
attentive to the possibilities of taking advantage of
these tools in the context of e-government.
Given these trends, business models and
governance modes must necessarily adapt and
sometimes be rethought. Public organizations are not
immune to these developments, and the e-
government 2.0 concept refers to specific
applications of social media in the sphere of public
services (Baumgarten and Chui, 2009).
The annual meeting of the Gov2.0 Summit has
brought together figures from the U.S.
administration and some researchers to discuss
experiments, problems and questions concerning e-
government 2.0 implementation since 2009. Few
recent academic publications tackle explicitly e-
government 2.0 and the problems it raises: in
Niehaves’ paper (Niehaves, 2009), specific
applications of the concept in the process
management field; in Nam’s study (Nam, 2011), the
adoption of e-government 2.0 by citizens; or in
Scholl’s paper (Scholl and Luna-Reyes, 2011)
factors that promote openness, collaboration and
citizen participation.
Several papers have been published on web site
quality evaluation methodology (Aladwani and
Palvia, 2002); (Cox and Dale, 2002); (Van Iwaarden
and Van derWiele, 2002); (Kim et al., 2003); (Van
Iwaarden et al., 2004); (Bilsel et al., 2006). Many of
these publications offer frameworks containing
groups of quality dimensions that are similar to the
SERVQUAL (Service Quality) model proposed by
Parasuraman (Parasuraman et al., 1988). Also some
publications have proposes evaluation
methodologies for specific web sites such as e-
EmergingTrendsinLocalGovernmentsWebStrategies-CitizenWebEmpowermentAssessmentinItaly
257

government web sites (Kaylor, Deshazo et al. 2001;
Smith 2001) hotel web sites (Chung and Law, 2003),
online library web sites (Chao, 2002) (Novljan and
Maja, 2004), and health care web sites (Bilsel et al.,
2006); (Buccoliero et al., 2010); (Bedell et al.,
2004). Recently, Kuo (Kuo, 2004) has presented a
new point of view by integrating quality function
deployment aspects into web site quality assessment
methodology.
In a number of publications, quantitative
methods for Web site quality evaluation are used.
Statistical methods are the most widely used
assessment tool (Cox and Dale, 2002); (Jeong et al.,
2003); (Kim et al., 2003); (Kim and Stoel, 2004).
3 THE RESEARCH
3.1 Citizen Web Empowerment Index
In this study, we combine both service and web site
quality assessment methodologies by adopting an
index named “Citizen Web Empowerment Index”
(CWEI) (Buccoliero and Bellio, 2010); (Bellio and
Buccoliero, 2013), whose components are listed in
Table 1
Table 1: CWEI components (adapted by Buccoliero,
Bellio, 2010) and (Bellio and Buccoliero, 2013).
Sub-indicator Assessed variables
CWEI
e-Information
Government structure;
Segmentation or life event;
Contact details;
Policies, procedures;
Budget;
Council minutes;
Newsletter and/or web
magazine.
Web tools
& strategies
Blog and Forum;
Chat;
Social networks;
Mobile services;
Web TV;
Open data strategy;
Web strategy evaluation
EGRI (UN, 2008).
e-Consultation
On-line polls, surveys;
On-line complaints;
Reputation systems;
Mayor’s direct on-line
relation with citizens.
e-Decision
making process
Evidence that the opinion
of citizens is considered;
Evidence of other
complaints.
Our study attempts to extend previous empirical
research to understand and to measure the degree of
citizen web empowerment in local Italian
governments’ portals by developing and index for
benchmarking citizens’ empowerment through web
portals (CWEI).
The baseline research hypothesis is that the
information and services provided by local
governments via the web are capable of enhancing
citizen empowerment regarding two key dimensions:
information held by citizens and control of the
information with respect to his/her needs.
The various typologies of web information which
allow evaluation of the level of e-participation were
used to develop an indicator by means of which
ratings could be given for the websites of all the
cities considered. This indicator, CWEI, is given by
the aggregation of four components, each of which
is calculated on the basis of the presence of certain
elements characterizing the structure of the website
considered (During the stage of quantitative
determination, the value 1 was ascribed to the
presence of the service or of the information
considered, value 0 to absence). The maximum
theoretical value is 100 while each sub-indicator has
a different theoretical value:
CWEI = e-information + web tools & strategies +
e-consultation + e-decision making process
During spring 2012 and spring 2013, the indicator
was used to assess the websites of local Italian
governments with populations over 60,000
inhabitants (104 cities assessed even if from 2012 to
2013 the number decreased to 102); the aim was to
arrive at certain assessments of the current state of
maturity of their web strategy in relation to potential
for an increase in citizens’ empowerment.
Analysis and rating of sites was based on two
fundamental criteria:
the immediacy with which information or
services can be obtained while navigating the
site, without impediments and time-consuming
procedures coming into play when attempting to
access information or services;
systematic (as opposed to sporadic) presence of
the information or services required from the
site.
CWEI, as pointed out in table 1, is a
multidimensional indicator because it is composed
of a series of sub-indicators the objective of which is
the measurement of various aspects of citizen
participation via the web.
The first sub-indicator has been termed e-
information. It relates to the presence on the
ICE-B2013-InternationalConferenceone-Business
258

website of some general information regarding the
city and its policies.
Assessment was conducted on a number of these
characteristics: the presence of a city politician list,
considering if there are only name and surnames or
a wider range of details in order to contact the
municipality officials. Clear presentation of the city
government organizational structure was also
assessed since it is considered as an important way
of orientation among the total number of services
provided. The on-line availability of policies,
procedures and legislation also helps. The last
element considered in this sub indicator is the on-
line presence of the budget and the way it is
addressed.
The second component of the indicator consists
of Web tools & strategies. It refers to the existence
of social networking applications made for a high
level of citizen participation - empowerment.
However not only was the presence of the main
instruments assessed (e.g. forums, blogs,
newsletters, Facebook, Twitter, Flickr, YouTube),
also specific services provided through mobile were
included. The presence of “open data” and “GIS”
strategy was also considered as an interesting
element that makes a difference to citizens.
To construct sub-indicator E-consultation,
various elements relative to the way of exchanging
information with citizens were considered as
reputation systems, online polls or e-surveys, and
on-line complaints. Also the direct relation between
citizens and the mayor was evaluated by searching
for the presence of direct on-line involvement of
citizens.
The fourth component of the indicator is termed
E-decision making process. This sub-indicator
assesses evidence that the municipality considers the
opinion of citizens in decision making processes and
provides evidence as to what decisions have been
taken starting from the consultation process (e.g.
publication of on-line pools, e-surveys results and
subsequent actions taken). (Bellio and Buccoliero,
2013)
3.2 CWEI Assessment 2012-2013
The evaluation task was randomly assigned to two
coders (the authors). The intercoder reliability of
each CWEI sub-indicator was tested on a 20-site
subset using Krippendorff's alpha coefficient (Hayes
and Krippendorff, 2007).
Overall, use of the CWEI rating system was
found to be highly reliable in the two annual
evaluations (Table 2).
Table 2: Intercoder reliability (Krippendorf’s alpha values
for the sub-indicators, yearly subset n=20).
CWEI Sub-indicator
CWEI E-information 0.9714 0.9797
CWEI WEB Tools and strategies 0.9552 0.9765
CWEI E-consultation 0.9509 0.9412
CWEI E-decision making process 0.9009 0.9319
When looking at the CWEI values, we observe
that none of the surveyed websites has reached a
score close to the maximum theoretical value of 100;
in fact the average CWEI value was 37.30 in 2012
and 40.24 in 2013. A moderate increase was
registered during the last year but the value is still
low, this testifies that it is hard to find local
governments which have developed web-based
strategies oriented toward information and user
participation
Considering the average CWEI values per sub-
indicators (Table 3), a little increase among the two
years of analysis can be noticed, but the score order
remains unvaried. The higher value is E-
information; this does not surprize since it is the
only component of the index which stands in the
middle between a traditional website structure and a
participatory one. On the contrary, the lowest level
is registered by E-decision making process sub-
indicator. This demonstrates that the awareness of
local governments on the potentials of the web is
only partial; in fact the tools for citizen participation
in many cases exist (for example forms that allow
problems to be reported very easily on-line, polls to
evaluate initiatives, etc.), but what is missing is
something that makes citizens aware that they have
been taken into account, something that gives
evidence on how a citizen's opinion was used in the
decision making process, something that develops e-
participation to empower citizens.
Table 3: Average CWEI values by sub-indicators.
Average CWEI
sub-indicator values
2012 2013
CWEI E-information 64.42/100 68.21/100
CWEI WEB Tools and
strategies
29.29/100 32.53/100
CWEI E-consultation 22.12/100 23.08/100
CWEI E-decision making
process
7.21/100 8.89/100
Figure 1 shows the map of Italy and contains the
average CWEI values per geographic area (Nielsen
Areas).
The highest value has been registered in the
North-East of the Country (Area 2: 46.62/100 in
2012 and 50.00/100 in 2013), North-West and the
EmergingTrendsinLocalGovernmentsWebStrategies-CitizenWebEmpowermentAssessmentinItaly
259
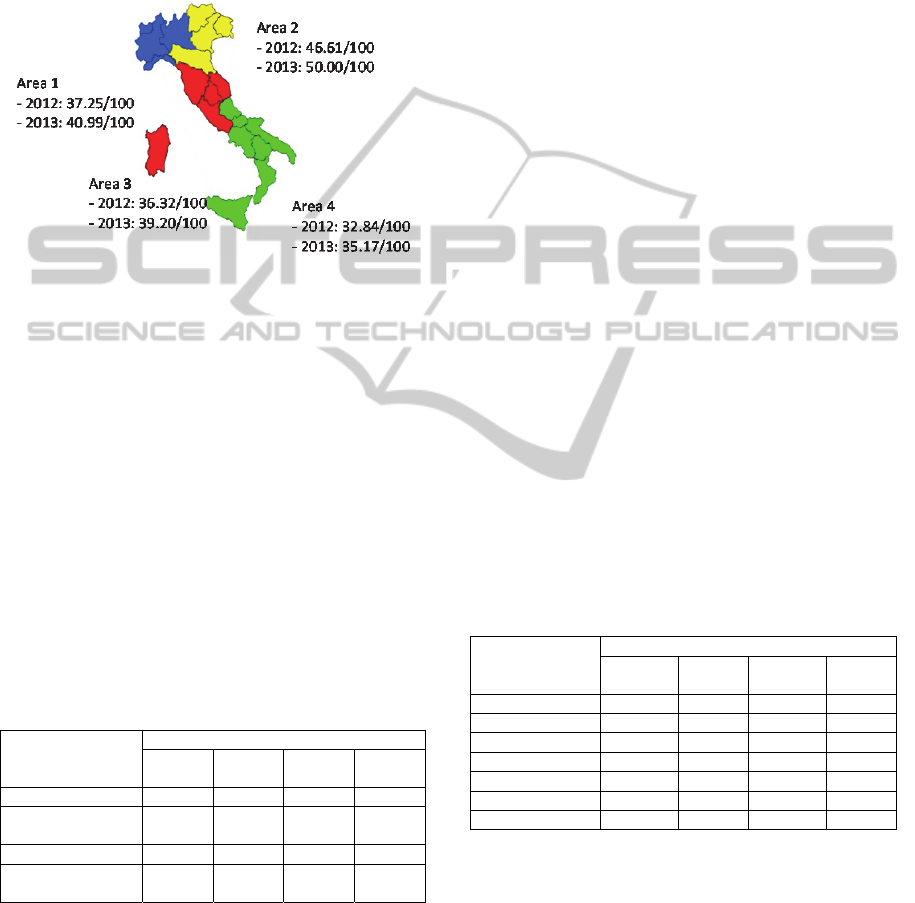
Centre have a similar value both in 2012 and 2013
(Area 1: 37.25/100 in 2012 and 40.99/100 in 2013,
Area 3: 36.32/100 in 2012 and 39.20/100 in 2013),
while a lower value is obtained by the South of Italy
(Area 4: 32.84/100 in 2012 and 35.17/100 in 2013).
For all the four geographical areas an increase is
shown between the two years of analysis.
Figure 1: Average CWEI values per geographic area
(Nielsen areas).
When looking at the “top scores” per sub-
indicator, we find a number of interesting and
significant “best practices” even if just in very few
cases the maximum value per sub-indicator is
obtained as shown in Table 4. By comparing
numbers in 2012 and 2013 it can be seen that the
number of cities increased only for sub-indicator E-
information.
The fact that only this sub-indicator was fully
accomplished by new cities shows, once again, that
the web strategies perceived by administrations are
still oriented at providing the most traditional form
of information to citizens, those which guarantee
little interaction and participation.
Table 4: Number of cities that have obtained the
maximum value per sub-indicator.
Cities with maximum value
N
2012
% 2012
N
2013
% 2013
e-Information 8/104 7.69% 10/104 9.62
WEB tools and
strategies
0/104 0 0/104 0
e-Consultation 1/104 0.96% 1/104 0.96%
e-Decision making
process
3/104 2.88% 3/104 2.88%
With regard to e-information the component site
structure was examined. Ratings show that sites
enabling the life events model for navigation (i.e.
navigation starting out from events which may
characterize the life of citizens, such as “studying”,
“giving birth” “using public transport” or “life as a
senior citizen”), or which provide clear segmentation
of citizens by cluster (the elderly, women, children,
foreigners, etc.) have increased between 2012 and
2013 probably because it has been understood that
menus constructed according to these approaches aid
consultation by citizens who can now receive
immediate answers targeted for their specific needs.
The research reveals that in 2013 about the 35%
of the sample has information provision based on
visitor-type clusters and 41% has chosen the life
event logic. Both approaches are adopted only in 22
cases over the 104 cities of the sample.
The highest score in WEB Tools and Strategies
sub-indicator was obtained both in 2012 and 2013
by the city of Turin where not only mobile services
are offered, but there is an intense use of blogs and
forums, social networks, videos and Web TV
channels, plus there are some public GIS
applications which not only allow interactive
consultation of different cartographies but also help
to personalize and share maps of the city.
The research also shows that there is an increase
in the presence of some specific information as for
example the list of politicians and their personal
pages or on-line details about the budget. This trend
is due to the Italian legislation’s recent requirements.
Analysis of Web tools and strategies reveal that
the use of social networks by local governments has
increased between 2012 and 2013 (29.81% in 2012
and 41,35% in 2013 among the sample). The most
used social networks are Facebook, YouTube and
Twitter as shown in Table 5, but also my Space,
Flickr, G+ and Skype were considered.
Table 5: Number of cities using each social network (SN)
and percentage among the sample.
Cities using each SN
N
2012
%
2012
N
2013
%
2013
Facebook 26/104 25.00 38/104 36.54
You Tube 21/104 20.19 29/104 27.88
Twitter 16/104 15.38 29/104 27.88
G+ 5/104 4.81 7/104 6.73
Flickr 5/104 4.81 5/104 4.81
My Space 4/104 3.85 4/104 3.85
Skype 1/104 0.96 1/104 0.96
In 2013 only 11 local governments out of 104
offer mobile services. As in 2012, the most
significant examples are given by services for
tourists which are often combined with QR codes
which allow cultural and historical information to be
read.
The use of open data was also explored, numbers
confirm that only a few cities are considering this
strategy but findings show that there was a
significant increase in 2013 compared to the
ICE-B2013-InternationalConferenceone-Business
260

previous year: a set of 10 cities has now introduced
open data as for example Florence, Palermo, Rome,
Venice, while others are starting to consider it.
Turning to e-consultation, the involvement of
the mayor in on-line relations with citizens was
assessed but it was hard to find tools for a true
interaction.
Only in few cases special forms are used or the
mayor’s presence on Facebook or Twitter is shown.
A wider presence of internet polls, surveys,
complaint platforms and reputation systems is
registered, even if in many cases they are still just
electronic forms to fill in which do not allow a
complete participatory behaviour.
The only city which has obtained the maximum
score in this sub-indicator was in 2012 and still is in
2013 Rimini. Its website offers reputation systems
not only to evaluate the general agreement on the
website but also on specific areas, as for example
police services. In addition there are direct online
ways to put citizens in contact with the
administration and also ways to report the needs of a
specific area, such as maintenance, repairs and
removal of litter in certain districts and public parks.
In terms of e-decision making process there is
still much work to do across the country.
It’s possible to see that except for a few cases
there is no evidence on how decisions are taken.
Often there are tools which allow a participatory
atmosphere but rarely results are shown. On the
whole sample only in 3 cases both evidence that
citizens’ opinion has been considered and evidences
about other’s compliant are shown. When
considering some best practices, we can think at
Venice or Udine, two cities which websites offers a
range of services built to allow citizens to “speak”
by reporting something, interacting with others and
seeing what the administration does or says.
With this regard it can be said that not much has
changed between year 2012 and year 2013 in the
Italian context.
In addition, correlation analyses (Pearson
correlation coefficient) between elements were
evaluated using the statistical package SPSS to
determine if there is a link between the city
population and the scores of each sub-indicator
(Table 6). Results show that in 2012 there was not
significant correlation between the number of
inhabitants and the level of the CWEI nor between
the number of inhabitants and the sub-indicators.
Instead in 2013 some significant correlations (two
tailed) are found between the population and the
CWEI score and also between the number of
inhabitants and CWEI 2 - Web Tools and Strategies
and CWEI 3 - e-Consultation.
These results show that in 2012 on-line
investments in citizen empowerment didn’t depend
on the dimension of the city while in 2013 the
opposite trend was found. Probably the 2013 result
could be explained by some elements of CWEI 2
and CWEI 3 which were observed in an increased
number of cities and which require some big
financial and organizational investment. For
example the development and adoption of online
complaint platforms or the adoption of open data
strategies which have increased during the last year.
Table 6: Correlation between population and CWEI.
POPULATION
2012 2013
CWEI_TOT
Pearson's
correlation
,086 ,212
*
Sig.
(2-code)
,388 ,031
N
104 104
CWEI_1
Pearson's
correlation
-,016 ,093
Sig.
(2-code)
,873 ,350
N
104 104
CWEI_2
Pearson's
correlation
,100 ,217
*
Sig.
(2-code)
,310 ,027
N
104 104
CWEI_3
Pearson's
correlation
,162 ,223
*
Sig.
(2-code)
,100 ,023
N
104 104
CWEI_4
Pearson's
correlation
-,009 ,013
Sig.
(2-code)
,931 ,899
N
104 104
4 CONCLUSIONS
A number of preliminary conclusions may be
reached on the basis of the analysis of the CWEI.
The very low CWEI scores obtained by the
Cities of the sample (average CWEI value is 37.30
over 100 in 2012, 40.24 over 100 in 2013) testifies
there is still a substantial immaturity of web
strategies, which appear modulated on structures and
organizational responsibilities rather than on the
needs and on the demand of citizens’ empowerment;
no substantial improvement has been detected in the
two-years period considered.
There is still a low but increasing penetration of
Web 2.0 tools and strategies (average sub-indicator
EmergingTrendsinLocalGovernmentsWebStrategies-CitizenWebEmpowermentAssessmentinItaly
261

“Web tools and strategies” value is 29.29 over 100
in 2012, 32.53 over 100 in 2013). This moves an
emphasis from the individual for whom information
equates to power to a more collaborative, collective
“group cooperation culture” that is hard to be
understood and accepted by most public employees.
Surprisingly, also a limited diffusion of mobile
applications was registered. This finding moves in
the same direction of Web 2.0 tools adoption since
also mobiles, especially smartphones, if properly
used, can turn citizens into active players in the
relationship with the Administration, involving them
in service co-creation, evaluation and use.
Although there is theoretical and practical
recognition that citizens must be more involved in
public decisions, many administrators are, at best,
ambivalent about public involvement or, at worst,
they find it problematic. Administrators need help in
addressing problems but find that the help they seek
from citizens often creates new sets of problems. As
a result, although many public administrators view
close relationships with citizens as both necessary
and desirable, most of them do not actively seek
public involvement. If they do seek it, they do not
use public input in making administrative decisions.
Overcoming the highly significant limits shown
above may turn out to be a prerequisite for concrete
development of the provision of services for
empowered citizens.
The CWEI index (if further evaluated) could be
used also at international level to benchmark and
monitor the web strategies of smartcities across
countries. Furthermore the CWEI index could
support a citizen-centered web design of information
and services. This could help a faster development
of official web solutions aimed to citizen
empowerment, developing trust and partnership
relationships, which are essential to deliver quality
and value for money.
REFERENCES
Ala-Mutka, K., D. Broster, et al. (2009). The Impact of
Social Computing on the EU Information Society and
Economy. Seville (Spain), European Commission
Joint Research Centre Institute for Prospective
Technological Studies.
Aladwani, A. and P. Palvia (2002). "Developing and
validating an instrument for measuring userperceived
Web quality." Information & Management(39): 467- 476.
Assar, S. and I. Boughzala (2013). E-Government
Evolution Priorities from a Web 2.0 Perspective: An
Exploratory Field Study. 46th Hawaii International
Conference on System Sciences (HICSS), 2013, Maui.
Baumgarten, J. and M. Chui (2009). "E-government 2.0."
McKinsey Quarterly 4.
Bedell, S., A. Agrawal, et al. ( 2004). "A systematic
critique of diabetes on the World Wide Web for
patients and their physicians." International Journal of
Medical Informatics(73): 687- 694.
Bellio, E. and L. Buccoliero (2013). Citizen Web
Empowerment across Italian Cities: a benchmarking
approach. Citizen E-Participation in Urban
Governance Crowdsourcing and Collaborative
Creativity. C. Nunes Silva, IGI Global.
Berce, J., A. Bianchi, et al. (2006). Towards the
eGovernment Vision for the EU in 2010: Research
Policy Challenges. Seville (Spain), European
Commission Joint Research Centre Institute for
Prospective Technological Studies.
Bilsel, R. U., G. Büyüközkan, et al. (2006). "A Fuzzy
Preference-Ranking Model for a Quality Evaluation of
Hospital Web Sites." International Journal of
Intelligent Systems 21: 1181-1197.
Buccoliero, L. and E. Bellio (2010). "Citizens Web
Empowerment in European Municipalities." Journal
of E-Governance 33(4): 11.
Buccoliero, L., E. Bellio, et al. (2010). Patient web
empowerment index (PWEI): a tool for the assessment
of healthcare providers’web strategies. A first
benchmark of Italian NHS Hospitals. MEDINFO 2010
Proceedings of the 13th World Congress on Medical
Informatics. C. Safran, S. Reti and H. Marin.
Amsterdam, IOS PRESS: 38-42.
Budin, H. (2005). Democratic Education and Self-
Publishing. Social Studies and the Press: Keeping the
Beast at Bay? . M. Crocco, Information Age
Publishing.
Chao, H. (2002). "Assessing the quality of academic
libraries on the Web: The development and testing of
criteria." Library & Information Science
Research(24): 169-194.
Chung, T. and R. Law (2003). "Developing a performance
indicator for hotel websites." International Journal of
Hospitality Management(22): 119-125.
Cox, J. and B. Dale (2002). "Key quality factors in Web
site design and use: An examination." International
Journal of Quality & Reliability Management(19):
862-888.
DiMaio, A., G. Kreizman, et al. (2005). Government in
2020: Taking the Long View, Gartner Inc.
Dutton, W. and M. Peltu (2007). Reconfiguring
Government-Public Engagements: Enhancing the
Communicative Power of Citizens. Oxford, Oxford
Internet Institute.
Fountain, J. E., Ed. (2001). Building the Virtual State:
Information Technology and Institutional Change.
Washington, DC, Brookings Institution Press.
Hayes, A. F. and K. Krippendorff (2007). "Answering the
call for a standard reliability measure for coding data."
Communication Methods and Measures 1: 77-89.
Jeong, M., H. Oh, et al. (2003). "Conceptualizing Web site
quality and its consequences in the lodging industry."
International Journal of Hospitality Management(22):
ICE-B2013-InternationalConferenceone-Business
262

161-175.
Kaylor, C., R. Deshazo, et al. (2001). "Gauging e-
government: a report on implementing services among
American cities." Government Information
Quarterly(18): 293-307.
Kim, S.-E., T. Shaw, et al. (2003). "Web site design
benchmarking within industry groups." Internet
Research(13): 17-26.
Kim, S. and L. Stoel (2004). "Dimensional hierarchy of
retail Website quality." Information &
Management(41): 619- 633.
King, S. and S. Cotterill (2007). "Transformational
Government? The role of information technology in
delivering citizen-centric local public services " Local
Government Studies 33(3): 21.
Kuo, Y.-F. (2004). "Integrating Kano’s model intoWeb-
community service quality." Total Quality
Management(15): 925-939.
Nam, T. (2011). New Ends, New Means, but Old
Attitudes: Citizens’ Views on Open Government and
Government 2.0. 44th HICSS conference 2011.
Niehaves, B. (2009). Open Innovation and Public Sector
Business Process Management - A Multi-Method
Study. Americas Conf. on IS (AMCIS).
Novljan, S. and Z. Maja (2004). "Web pages of Slovenian
public libraries: Evaluation and guidelines." Journal of
Documentation(60): 62-76.
O'Reilly, T. (2005) "O'Reilly Network: What Is Web 2.0."
O'Reilly, T. (2007). "What is Web 2.0: Design Patterns
and Business Models for the Next Generation of
Software." International Journal of Digital Economics
65(1): 20.
Osimo, D. (2008). Web2.0 in Government: Why and
How? Seville, European Commission Joint Research
Centre Institute for Prospective Technological Studies.
Pachler, N. and C. Daly (2009). "Narrative and learning
with Web 2.0 technologies:Towards a research
agenda." Journal of Computer Assisted Learning
25(1): 12.
Parasuraman, A., V. Zeithaml, et al. (1988).
"SERVQUAL: A multi-item scale for measuring
consumer perceptions of service quality." Journal of
Retailing(64): 2- 40.
Richards, R. (2010). "Digital Citizenship and Web 2.0
Tools." MERLOT Journal of Online Learning and
Teaching 6(2): 7.
Scholl, H. J. and L. F. Luna-Reyes ( 2011). Uncovering
Dynamics of Open Government, Transparency,
Participation, and Collaboration. 44th HICSS
conference, 2011.
Smith, A. (2001). "Applying evaluation criteria to New
Zealand government websites." International Journal
of Information Management 21: 137-149.
Van Iwaarden, J., T. Van der Wiele, et al. (2004).
"Perceptions about the quality of Web sites:Asurvey
amongst students at Northeastern University and
Erasmus University." Information & Management(41):
947-959.
Van Iwaarden, J. and T. Van derWiele (2002) "A study on
the applicability of SERVQUAL dimensions for Web
sites."
EmergingTrendsinLocalGovernmentsWebStrategies-CitizenWebEmpowermentAssessmentinItaly
263
