
Continuous Improvement of Geographic Data Production Processes
Approach and Results of a Case Study
Wolfgang Reinhardt and Thorsten Bockmühl
Institute of Applied Computer Science, University of the Bundeswehr München, Neubiberg, Germany
Keywords: Quality of Geographic Data Production Processes, Continuous Improvement, Process Indicators.
Abstract: The quality of products – in this case the quality of geographic data representing the facilities of utility
companies – depends not only on the used sources and methods of data acquisition but is also significantly
affected by the processes applied for the production of geographic data. Study and optimization of
production processes are important topics in manufacturing for many years and are widely known as
»Process-Based Quality Management«. This means that besides the quality of the final product, the quality
of the production processes is also of high interest. In this paper an overview concerning a three years study
is given, in which a methodology for a continuous improvement of the geographic information production
processes has been developed and applied. Also key figures to describe the quality of products and
processes have been suggested. These key figures have been analyzed over a longer period. The overall
objectives of this procedure are to reveal the quality of products and processes, to detect deficiencies and
weaknesses of the processes and to prove the effectivity of changes of the processes.
1 INTRODUCTION
Quality is an important characteristic of products,
maybe the most important one in many cases.
Therefore, quality assurance is of high importance
for all kinds of productions. Consequently much
effort has been spend to improve it in manufacturing
for many years ended with the development of the
more general concept of Quality Management
(QM). Key drivers for this development were mainly
different industrial branches primarily in Japan, the
US and in Europe. According to (ISO 9000, 2005)
Quality is understood as “the degree a set of inherent
characteristics which fulfill requirements”.
Geographic data quality, also called spatial data
quality, has been a core sub-discipline of
Geographic Information Sciences / Geomatics since
its early development and various related issues have
been investigated. Although there are several issues
which are still subject of intensive research, the ISO
standard 19113 “Geographic information - Quality
principles” establishes the principles for describing
the quality of geographic data and specifies
components for reporting quality information. It also
provides an approach to organize information about
data quality (ISO19113, 2001).
The quality elements defined in ISO 19113 for
describing the quality of geographic data are shortly
outlined here:
Completeness
Logical consistency
Positional accuracy
Temporal accuracy
Thematic accuracy
Quality Management (QM), according to ISO 9000,
comprises various organized actions and
arrangements to improve products, processes and
services. The fundamental elements of QM
(Mahoney and Thor, 1994) are:
Total involvement (of the organization)
Continuous improvement (processes)
Customer orientation
One other important feature of QM shall be
mentioned also, which is the Process orientation. It
means that in organizations the overlapping
processes become more important instead of
functions and rigid hierarchies. The definitions for
quality refer to the quality of products and services
but all relevant QM concepts point out that the
quality of the production processes is very important
and of course, have an essential influence on the
quality of the product, e.g. Masing (1994). Quality
of processes will be discussed in section 2.
ISO 9000 is a series of five international standards
344
Reinhardt W. and Bockmühl T..
Continuous Improvement of Geographic Data Production Processes - Approach and Results of a Case Study.
DOI: 10.5220/0004530303440350
In Proceedings of the 4th International Conference on Data Communication Networking, 10th International Conference on e-Business and 4th
International Conference on Optical Communication Systems (ICE-B-2013), pages 344-350
ISBN: 978-989-8565-72-3
Copyright
c
2013 SCITEPRESS (Science and Technology Publications, Lda.)

for quality management. The content of these
standards and instructions for the application and
implementation is published widely, e.g. Mahoney
and Thor (1994). An important concept of ISO 9000
for our work is Process-based Quality Management
(PQM) which is also called process-oriented
Management by some authors. Some of the key
characteristics are:
Important activities and resources in enterprises
shall be described as processes and shall be
controlled accordingly
Cross-functional processes need to be identified,
understood and controlled accordingly
The continuous improvement (CI) of the
processes is a permanent goal of an organization
One of the reasons why these standards became well
known was the fact that organizations could be
certified according to ISO 9000 by specific
legitimated third-party agencies. In this paper we are
not focusing on certification but on the principles of
ISO 9000 as these principles can guide every
organization who is implementing a QM system, and
are therefore of high interest in this context.
As mentioned, quality of spatial data is
investigated intensively but process quality and
quality management have not been discussed much
in the geographic domain. The application of PQM
to production processes of geographic data
especially to so-called GIS based Facility
Management Systems (FM-Systems) within utility
companies were investigated by Stürmer (2007).
Within the framework of a project funded by the
research unit of the German Society for Quality
(DGQ), a PQM related to update processes for
geographic data in utilities was developed
(Bockmühl and Reinhardt, 2008). This project
triggered the idea to evaluate the concepts developed
in a practice study over a longer period. The
intended goal of the study is to measure the effects
of changes in processes, e.g. when new data check
methods have been introduced which in other words
is the implementation of a continuous improvement
cycle for geographic data production processes. For
this reason suitable measures had to be developed. In
this paper our main focus is put on introducing a
developed methodology of CI as well as the results
of a case study where this methodology was applied.
Also we focus on explaining which measures can be
used to unveil the effects of changes of processes.
The remainder of this paper is organized as
follows: In section two we will give an overview
about principles of process tracing and general
approaches for CI. We will discuss approaches to
define process quality in general and outline how
this can be applied for geographic data production
processes. In section three some basics of PQM and
its application to FM-systems at utility companies
within the framework of the project “PQM-NIS”
will be outlined. This is followed by a description of
the case study which has been carried out, its
background, organizational requirements and goals
as well as the basic approach of the study, the
analysis of ratios, developed from process related
data and the results of the study. Finally some
conclusions are drawn.
2 PROCESSES – BASICS,
QUALITY MODEL
AND CONTINUOUS
IMPROVEMENT
2.1 Background and Overview
A process in the context of this paper is understood
as any kind of single or connected activities which
has / have input and output. These activities shall be
targeted on the output, for example a product of
required quality, see e.g. (Masing, 1994).
As already mentioned, processes have to be
monitored and checked (and improved if necessary)
continuously. As a general approach for this task the
method DMAIC (Define - Measure - Analyse -
Improve - Control) is very suitable (see Mahoney
and Thor, 1994). It includes the following steps:
Define: Define the goals of the process together
with the customer (user). Emphasize on the process
output and specific characteristics which are chosen
together with the customer.
Measure: Measure the characteristics through
suitable metrics (indicators) to determine the actual
state of the process.
Analyze: Analyze the characteristics of the process
and detect the reason for weaknesses and
deficiencies.
Improve: Improve the process based on the results
of the analyses and discussions with the customer
Control: Check the results of the re-organized
processes.
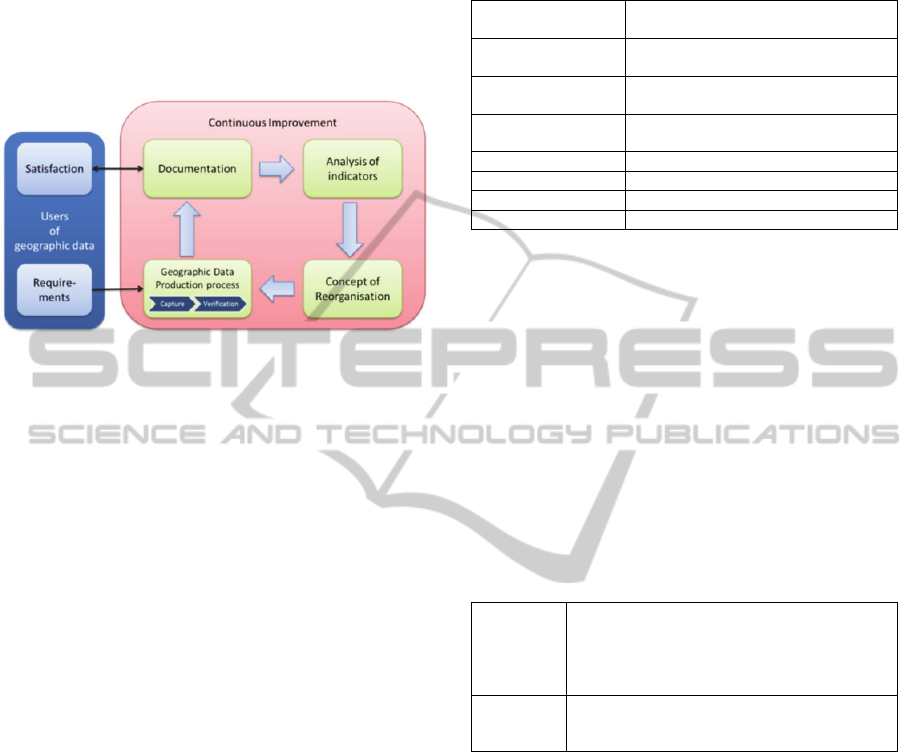
Figure 1 illustrates the CI process adapted to
geographic production processes. These general
concepts give us guidelines for the CI methodology
we have to develop. But we further need:
A quality model suitable for geographic data
production processes which includes proper
ContinuousImprovementofGeographicDataProductionProcesses-ApproachandResultsofaCaseStudy
345
quality elements
A way to link the quality elements with the
characteristics of the process defined by the
customer
Metrics for the quality elements
These issues will be discussed in the next sections.
Figure 1: Continuous improvement of geographic data
production processes (adapted after ISO 9000).
2.2 A Process Quality Model and Its
Application
As QM is applied in a very large variety of domains
from health care to mechanical product production
and in our case to the production of geographic data,
it is clear that the indicators of process quality must
be different in the various domains. That means,
criteria for the process quality have to be developed
in a domain specific way. To the knowledge of the
authors, such criteria have not been published for
geographic data production processes. As a
consequence these criteria for our case study had to
be defined by ourselves. A literature study showed
that several authors suggested considering software
quality characteristics for the measurement of the
quality of general business processes. Quality
characteristics for software product quality are
defined in the ISO/IEC 9126 standard (Satpathy et
al.,
2001). Table 1 includes this generic process
quality model.
This model is very comprehensive and due to its
generic approach it offers quality elements for all
process characteristics. That means in each
application the quality focus have to be defined first
and according to this focus the proper elements have
to be chosen from this list (table 1). This selection
process needs intensive discussions with users to
define the focus clearly. In other words: each
organization can define its own profile of a quality
model, even various profiles for specific cases.
Table 1: Factors and examples of sub-factors of the
generic process quality model, after Satpathy et al.,
(2001).
Functionality
Compliance, Completeness,
Consistency, Security
Usability
Understandability, Learnability,
Operability
Efficiency and
Estimation
Cost/ Effort estimation, Cycle Time,
Complexity estimation
Visibility and
Control
Progress, Monitoring, Improvement
Measures
Reliability Failure Frequency, Fault Tolerance
Safety Risk avoidance
Scalability Scalability
Maintainability Analyzability, Modifiability, Stability
To structure this discussion a methodology
which supports the selection of the suitable elements
(and related metrics) for the specific characteristics
of a process would be helpful. A very common
method for such purposes is the Goal-Question-
Metric (GQM) methodology (Satpathy et al., 2001).
GQM is applied in a certain project in a way that at
first the general goals are specified (together with
the customer). An example of a general goal would
be to study the efficiency of certain processes. To
come to a more precise view and to define metrics a
set of questions have to be formulated. Table 2 gives
an example of the application of GQM.
Table 2: Example of GQM application.
Goal
Object of study: Selected data acquisition
process
Purpose: To assess
Focus: E.g. Functionality
Points of view: Relevant actors
Question
Are the data check methods in data capture
suitable?
Metric: Number of errors detected.
The process quality model introduced here
together with the GQM method is a suitable
framework for implementing a CI for geographic
data production processes. But it has to be
emphasized that it requires intensive discussions
with customers (users) who have good process
knowledge to select the quality elements, to ask the
proper questions and to choose the metrics (see 3.2).
3 THE CASE STUDY
3.1 Background of the Study
In many countries utility companies are committed
by legal regulations to keep records of the position
and other properties of their facilities like pipes,
ICE-B2013-InternationalConferenceone-Business
346
cables etc. These facilities are stored in GIS based
Facility Management (FM) Systems, also called
Network Information Systems (NIS). The
continuous updating of the data bases is a very
important permanent task.
The data (and the GIS) is used for many
purposes like the construction of new facilities,
failure management (e.g. in case of a breakdown),
planning of network extensions etc. In the case of
any road constructions which require digging the
data also is used to avoid damages of pipes and
cables. Therefore, utility companies have a high
interest in ensuring the quality of their geographical
and other data.
Against this background, in 2007, the project
“PQM-NIS” was started with the general goal to
develop a PQM for the updating processes of the
data bases of utility companies. The results were
comprised in a best practice booklet which includes
the description of the relevant basics and the update
processes, the quality relevant actions as well as a
guide to introduce a PQM. For details see Bockmühl
and Reinhardt (2008).
Within this project the idea was born to prove the
effects of a PQM in practice and especially to
implement a CI for the update processes and study
the effects over a longer period of time. Finally the
case study was started in 2011. The details are
explained in the following sections.
3.2 Approach of the Case Study
The study has been carried out with five utility
enterprises in the southern part of Germany. The
study is scheduled to be carried out till December
2013. The paper includes results from the first two
years (2011-2012).
The strategic goals of the study:
To detect deficiencies in the processes and to
identify options to eliminate them.
To demonstrate quantitatively that any changes
of the processes were effective (or not). Typical
process changes are for example the introduction
of new check methods.
To convert these strategic goals to operative goals
the following steps have to be carried out:
Selection of processes /sub-processes which shall
be traced
General PQM activities
Definition of the detailed (operative) goals and
metrics
These issues are discussed in the next sections.
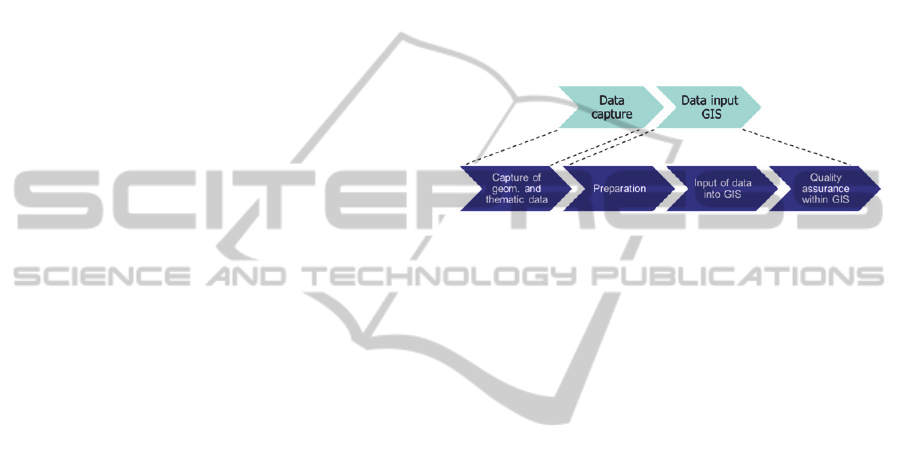
Selection of Processes /Sub-processes. The
selection of processes and/or sub-processes has to be
carried out with very good process knowledge e.g.
by involving the relevant actors of the processes. In
this case processes had been selected which the
involved operators indicated as “high potential for
improvements”. These processes were “Data
Capture” (DC), that is data acquisition of newly
constructed pipes (geometry and attributes), mainly
pipes that are connecting houses to main pipes and
“Data Input to GIS (DI GIS)” which consists of
“Preparation”, “Input of data into GIS” and “Quality
Assurance in GIS after input” (see fig. 2).
Figure 2: Processes considered in the case study.
General PQM Activities. To perform such a study
and to implement a QM-concept like CI requires a
series of additional actions which are also very
important for the success of such a project like
the involvement of people or
the compilation of relevant documents e.g.
process descriptions etc.
With regard to the length of the paper these issues
are not discussed.
Refinement of Goals. This step was also carried out
together with different actors of the processes of the
enterprises. It was agreed with the partners that the
main focus within the first part of the project should
be put on efficiency of the processes as it was
known that the performance within some of the sub
processes was pretty low. Other issues were the
categories and the number of detected errors within
these categories. To refine this and to choose metrics
the GQM method (see section 2) was applied. Table
3 presents some of the results of this part.
The factors and sub-factors of the generic
process quality model (included in “focus” in the
table) together with the GQM method allows for a
user-defined adaption to any other goals. An
important step is, as usual in QM, an involvement of
people to include their deep process knowledge.
To be able to determine the metrics relevant
measurements have to be performed, preferably
automatically whenever it is possible. Some remarks
on terminology: the term “metrics” in GQM is called
“process indicators” or “ratios” in general literature
ContinuousImprovementofGeographicDataProductionProcesses-ApproachandResultsofaCaseStudy
347
on business processes. Therefore the term ratio is
used in the following.
Table 3: Result of the GQM application.
Goal 1
Object of study: Processes DC / DI GIS
Purpose: To assess
Focus: Functionality
Points of view: Relevant actors
Question
Are check methods in DI GIS suitable to detect
errors?
Metric: Number of errors detected by a
specific method.
Goal 2
Object of study: Processes DC / DI GIS
Purpose: To assess
Focus: Efficiency
Points of view: Relevant actors
Question 1
Is the duration of considered processes / sub-
processes adequate?
Metric: Process duration (in days).
Question 2
Is the elapsed time of certain sub-processes
(e.g. problem management) adequate?
Metric: Elapsed time of the sub process (in
hours).
Procedure applied in the Study. In the first period
of the project the documentation of the processes
and workflows of the enterprises were checked and
completed. Also some software components were
developed to be able to collect the necessary process
information and to calculate the defined process
ratios. At the end of the first year we were able to
start with the process of collecting data, calculate
ratios, analyze the ratios and recommend process
changes. The calculation of ratios was performed
monthly.
3.3 Results of the Case Study
In this section we present selected results from the
study to illustrate the methodology and to discuss
the most important issues. Due to the length of the
paper this requires a rather restrictive selection.
Please note that with respect to data privacy
protection all the data have been biased mainly in
the absolute values, but all the effects described here
have been observed with the real data.
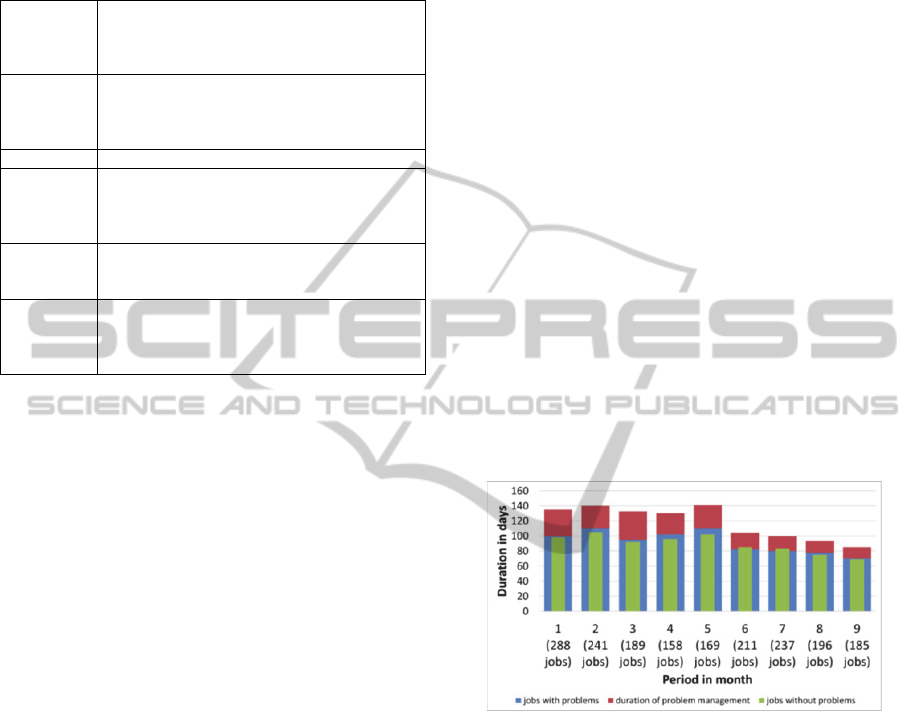
The first area of interest was the duration of jobs
related to processes and sub processes. Figure 3
shows the average duration of jobs (including data
capture and data input to GIS) for one of the
involved enterprises for a period of 9 month. In
green colour the jobs without any problems and in
blue colour the jobs with problems are given.
Problem in this case means that something was
unclear and had to be clarified by further
investigations e.g. phone calls or discussions with
people who were involved in the job. In red colour
the duration is given which was needed to solve the
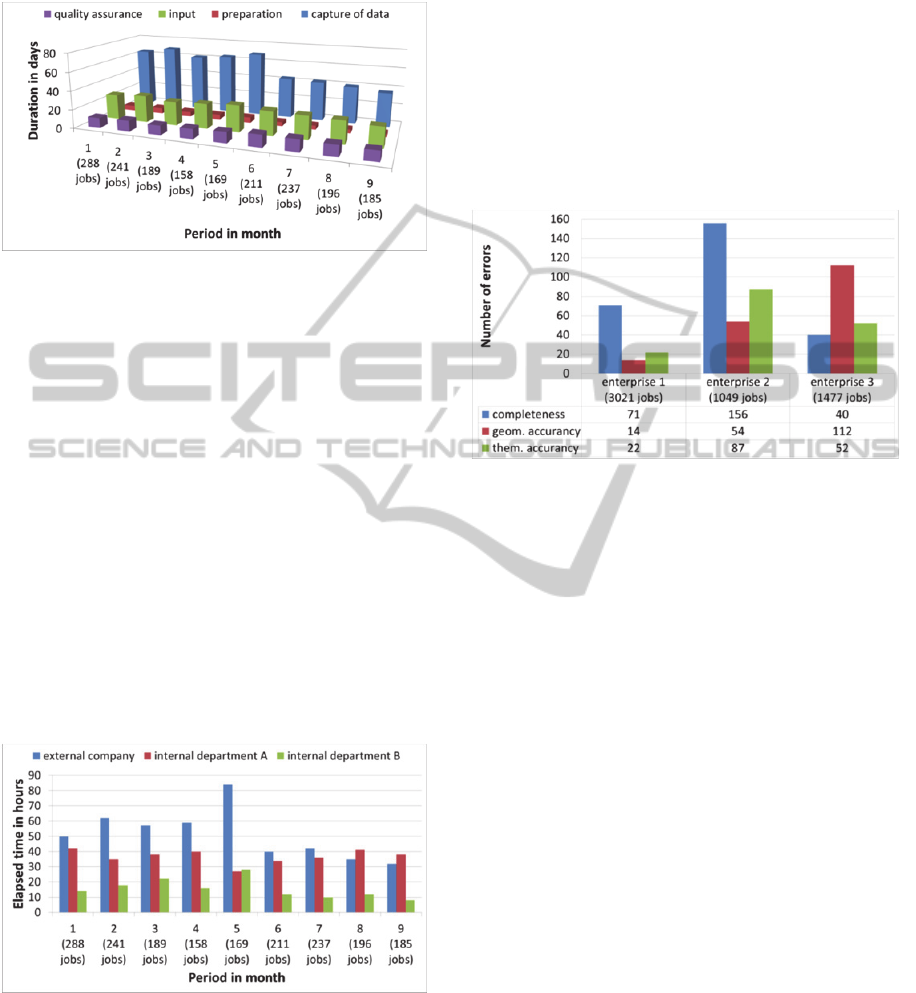
problem. Figure 4 includes the corresponding
durations of the sub processes of the processes DC
and DI GIS.
These figures illustrate some important facts:
o The duration of jobs (DC and DI GIS) in general
is very long (around 100 days!). The target
duration (which is the goal) of the enterprises is
different, but is between 20 and 40 days. In
general the utility companies would need a
higher up-to-dateness, but with regard to the
costs they accept these duration of 20-40 days.
o In case of problems the duration of jobs is
around 30% higher than without problems.
o At around 10-15% of the jobs problems
occurred. With regard to the time needed for
problem management there is a high potential for
savings if it’s possible to reduce this percentage.
o Figure 4 also shows that for the sub process
capture of data the duration is at least double
compared to other sub processes. This is not
caused by a very complex data capture but just
by the fact that the delivery of the results in
general is delayed.
Figure 3: Duration of jobs (DC and DI GIS) for a period of
9 month.
o Data capture in general is performed by external
companies or the companies who are doing the
construction. Figure 4 shows that after 5 months
the average duration of data capture was reduced
by about 30%. This was just caused by
negotiating with the external companies and a
change of the contracts. It is expected that this
will be reduced even more in future.
o Also the duration of the input of data into the
GIS is pretty high (around 30 days). This is due
to limited human resources working for this task.
In future organizational changes shall help to
decrease the duration of this step also.
o In general there is still a high potential to reduce
the duration of the jobs especially related to data
ICE-B2013-InternationalConferenceone-Business
348
capture or the delivery of the results respectively
and related to the data input to GIS.
Figure 4: Duration of sub processes for a period of 9
month.
Figure 5 shows the average elapsed time per job
for problem management (not the duration as in the
other cases!). Problem management means finding
the reason for the problem and/or clarifies the
situation and delivers a correct data capture result.
o The average duration of problem management is
around 40 h per job, which none of the orgs
would have expected. It also can be recognized
that there are considerable differences between
the internal departments and the external
company dealing with that. The reason for this
has to do with education / skills of people and
cannot be further discussed here.
o The reduction of the elapsed time of problem
management after 5 months, which can be seen
also in figure 5, was caused by an organizational
change in the problem management process.
Figure 5: Elapsed time for problem management of
different org units.
Figure 6 shows examples of detected errors of
certain error types aggregated for 6 month.
o It clearly shows that in two enterprises the
number of incomplete data sets were much
higher than in the third one. It is assumed that the
reason for this was an unclear communication of
the rules what the data set should include. This
figure also shows a very high number of
geometric errors (detected after input into the
GIS and corresponding checks) for one
enterprise. In this case the reason probably was
that not proper skilled personal (construction
workers) did the surveying. In future these
assumptions have to be verified. Generally in
both cases a considerable reduction of the
corresponding numbers of errors is expected.
Figure 6: Detected numbers of errors of certain error
types.
These examples show that the methodology
developed and applied offers the opportunity to
analyse processes based on objective figures. In
principle much more data can be captured and
analysed in this context as we were able to
demonstrate. In our case study the findings about the
duration of the projects and the possible
improvements (e.g. shorter durations) leaded to
further and deeper investigations related to the
efficiency of the processes so that other issues have
been neglected in the first period of the project.
4 CONCLUSIONS
AND OUTLOOK
We have presented a methodology for a continuous
improvement of geographic data production
processes based on objective figures and results
from its practical application. Continuous
Improvement is one of the most important parts of a
process-oriented quality management. This method
allows for a quantitative presentation of the quality
of data production processes as well as the product
(geographic data). A variety of different kind of
information can be used as quantitative measures
(also called process ratios) like efficiency or
functionality indicators. Based on time series of
ContinuousImprovementofGeographicDataProductionProcesses-ApproachandResultsofaCaseStudy
349

these ratios, reorganizations of the processes can be
designed and its effectivity can be checked and
verified.
The method has been applied to geographic data
production processes within utility companies but
the method doesn´t include any utility specific
things. In consequence it can be applied to the whole
geographic data domain. The only things which of
course can be specific are the processes itself which
means that the analysis of the processes itself can be
specific also.
Also the generic process quality model
(presented in 2.2) is that comprehensive and allows
for a specific adaption with regard to the focus of the
specific investigation. In our case study mainly
efficiency issues have been discussed but in other
applications the focus can be different, of course.
Within the remaining period of the study we will
focus on untreated process characteristics and we
will investigate the usage of other analysis methods,
e.g. methods of the Seven Basic Tools of Quality.
ACKNOWLEDGEMENTS
The financial support of this work as well as the
successful cooperation with the utility companies
Netrion GmbH, energis GmbH, Netzdienste Rhein-
Main GmbH and Stadtwerke München is gratefully
acknowledged.
REFERENCES
Bockmühl T., Reinhardt W., 2008. Leitfaden zur
Entwicklung eines prozessorientierten
Qualitätsmanagements für die Produktion von
Netzinformationen in Versorgungsunternehmen. FQS
Forschungsgemeinschaft Qualität e.V, FQS-DGQ-
Band, 83-04.
ISO 19113:2002 Geographic information — Quality
principles.
ISO 9000:2005 Qualitätsmanagementsysteme –
Grundlagen und Begriffe.
Masing W (ed.), 1994. Handbuch Qualitätsmanagement.
München, Wien, Hanser.
Mahoney F X and Thor C G 1994 The TQM Trilogy,
AMACOM.
Satpathy M, Harrison R, Snook C, Butler M 2001 A
Generic Model for Assessing Process Quality, Lecture
Notes in Computer Science. Berlin, Heidelberg,
Springer: 94–110.
Stürmer S 2007 Qualitätsgesicherter Aufbau digitaler
Netzdokumentation - Möglichkeiten, Grenzen und
Risiken von PQM, Dissertation (Ph.D. Thesis), UniBw
München
ICE-B2013-InternationalConferenceone-Business
350
