
A New Methodology for Mitigation of Lava Flow Invasion Hazard
Morphological Evolution of Protective Works by Parallel Genetic Algorithms
G. Filippone
1
, W. Spataro
1
, D. D’Ambrosio
1
and D. Marocco
2
1
Department of Mathematics and High-Performance Computing Center, University of Calabria, Arcavacata di Rende, Italy
2
Centre of Robotics and Neural Systems, School of Computing and Mathematics, Plymouth University, Plymouth, U.K.
Keywords:
Evolutionary Computation, Genetic Algorithms, Parallel Computing, Cellular Automata, Lava Flow Simula-
tion, Lava Flow Control.
Abstract:
The determination of areas exposed to be interested by new eruptive events in volcanic regions is crucial for
diminishing consequences in terms of human causalities and damages of material properties. Nevertheless,
urbanized areas, cultural heritage sites or even important infrastructures, such as power plants, hospitals and
schools can be protected by diverting the flow towards lower interest regions. This paper describes the applica-
tion of Parallel Genetic Algorithms for optimizing earth barriers construction by morphological evolution, to
divert a case study lava flow that is simulated by the numerical Cellular Automata model Sciara-fv2 at Mt Etna
(Sicily, Italy). In particular, the application regards the optimization of the position, orientation and extension
of an earth barrier built to protect Rifugio Sapienza, a touristic facility located near the summit of the volcano.
The study has produced extremely positive results and represents, to our knowledge, the first application of
morphological evolution for lava flow mitigation. Among different alternatives generated by the Genetic Al-
gorithm, an interesting scenario consists of an earthen barrier solution (with a length of 225 m, average height
of 25 m, base width of 10 m and volume of 56180 m
3
) which completely deviates the flow avoiding that the
lava reaches the inhabited area.
1 INTRODUCTION
Among several approaches for modeling natural com-
plex phenomena proposed in the literature, Cellular
Automata (CA) represent a possible solution when the
phenomena to be simulated evolve on the basis of lo-
cal interactions of their constituent parts. CA are dy-
namical systems, discrete in space and time. They can
be thought of as a lattice of cells, each one embedding
an identical finite automaton, interacting only with a
small set of neighbouring cells. The state of each fi-
nite automaton is changed by applying the transition
function, which defines local rules of evolution for the
cell. The CA overall global dynamic emerges from
the simultaneous application of the local rules to each
cell.
In the specific case of simulating macroscopic nat-
ural events, Macroscopic Cellular Automata (MCA)
can represent a valid methodology to model numer-
ous complex non-linear phenomena (Di Gregorio and
Serra, 1999), such as lava and debris flows. MCA
are an extension of classical CA, developed for over-
coming some of the limitations affecting conventional
CA frames such as the modeling of large scale com-
plex phenomena. Due to its particulate nature and lo-
cal dynamics, MCA are very powerful in dealing with
complex boundaries, incorporating microscopic inter-
actions and parallelization of the algorithm.
In the risk assessment of lava flow context, the
use of thematic maps of volcanic hazard is of fun-
damental relevance to support policy managers and
administrators in effective land use planning and tak-
ing proper actions that are required during an emer-
gency phase. In particular, hazard maps are a key tool
for emergency management by describing the threat
that can be expected at a certain location for future
eruptions. At Mt. Etna (Italy), the most active vol-
cano in Europe, the majority of events that have oc-
cured in the last four centuries report damage to hu-
man properties in numerous towns on the volcano
flanks (Behncke and Neri, 2003). Notwithstanding,
the susceptibility of the Etnean area to lava invasion
has increased in last decades due to continued urban-
ization (Dibben, 2008), the inevitable consequence
being that new eruptions may involve even greater
risks. Current efforts for hazard evaluation and con-
13
Filippone G., Spataro W., D’Ambrosio D. and Marocco D..
A New Methodology for Mitigation of Lava Flow Invasion Hazard - Morphological Evolution of Protective Works by Parallel Genetic Algorithms.
DOI: 10.5220/0004540400130024
In Proceedings of the 5th International Joint Conference on Computational Intelligence (ECTA-2013), pages 13-24
ISBN: 978-989-8565-77-8
Copyright
c
2013 SCITEPRESS (Science and Technology Publications, Lda.)

tingency planning in volcanic areas draw heavily on
hazard maps and numerical simulations for the pur-
pose of individuating affected areas in advance. Al-
though many computational modeling methods (Ishi-
hara et al., 1990; Miyamoto and Sasaki, 1997; Avo-
lio et al., 2006; Del Negro et al., 2008) for lava flow
simulation and related techniques for the compilation
of susceptibility maps are already known to the inter-
national scientific community, the problem of defin-
ing a standard methodology for the construction of
protection works, in order to mitigate volcanic risk,
remains open. Techniques to slow down and divert
lava flows, caused by collisions with protective mea-
sures such as artificial barriers (Barberi et al., 2003;
Colombrita, 1984; MacDonald, 1962) or dams (Bar-
beri et al., 1993), are now to be considered empirical,
exclusively based on past experiences.The proper po-
sitioning of protective measures in the considered area
may depend on many factors (viscosity of the magma,
output rates, volume erupted, steepness of the slope,
topography, economic costs). As a consequence, in
this context one of the major scientific challenges for
volcanologists is to provide efficient and effective so-
lutions.
Morphological evolution is a recent development
within the field of engineering design, by which evo-
lutionary computation techniques are used to tackle
complex design projects. This branch of evolutionary
computation is also known as evolutionary design and
is a multidisciplinary endeavour that integrates con-
cepts from evolutionary algorithms, engineering and
complex systems to solve engineering design prob-
lems (Bentley, 1999). Morphological evolution has
been largely explored in evolutionary robotics, both
for the design of imaginary 3D robotics bodies (Sims,
1994) and for the efficient and autonomous design
of adaptive moving robots (Bongard, 2011; Lipson
and Pollack, 2000). Principles of evolutionary design
have been also applied in structural engineering at dif-
ferent level of the design process, from the structural
design itself to the logistic involved in the construc-
tion (Kicinger et al., 2005).
This paper describes the application of Parallel
Genetic Algorithms (PGAs), for the first time to our
knowledge, for optimizing earth barriers construction
by morphological evolution, to divert a case study
lava flow that is simulated by a CA model. The GA
fitness evaluation has implied a massive use of the
numerical simulator running thousands of concurrent
simulations for every generation computation. There-
fore, a GPGPU (General Purpose computation with
Graphic Processor Units) library was developed to
accelerate the GA execution. A visualization sys-
tem (Filippone et al., 2013) was also implemented,
thereby allowing interactive analysis of the results. A
study of GA dynamics, with reference to emergent be-
haviors, is also discussed later. The paper is organized
as follows: after a brief description of the SCIARA-
fv2 CA model (Section 2) that was used for lava flow
simulation of the case study adopted for the experi-
ments (Section 3), the main characteristics of the im-
plemented algorithm, framework and results are pre-
sented (Section 4). Section 5 concludes the paper with
final comments and future works.
2 THE CELLULAR AUTOMATA
MODEL SCIARA - f v2
For the morphological evolution of protective works
by PGAs, the latest release fv2 of the SCIARA
CA model for simulating lava flows was adopted.
SCIARA is a family of bi-dimensional MCA lava
flow models, successfully applied to the simulation
of many real cases such as the 2001 Mt. Etna (Italy)
Nicolosi lava flow (Crisci et al., 2004) and the 1991
Valle del Bove (Italy) lava event (Barca et al., 1994),
which occurred on the same volcano and was em-
ployed for risk mitigation. In formal terms, the
SCIARA-fv2 model (Spataro et al., 2010) is defined
as:
SCIARA − f v2 =< R, L, X, Q, P, τ, γ > (1)
where:
• R is the set of square cells covering the bi-
dimensional finite region where the phenomenon
evolves;
• L ⊂ R specifies the lava source cells (i.e. craters);
• X = {(0, 0), (0, 1), (−1, 0), (1, 0), (0, −1), (−1, 1),
(−1, −1), (1, −1), (1, 1)} is the set that identifies
the pattern of 8 cells influencing the cell state
change (i.e., the Moore neighborhood);
• Q = Q
z
× Q
h
× Q
T
× Q
8
f
is the finite set of states,
considered as a Cartesian product of substates.
SCIARA-fv2 substates, which describe relevant
quantities representing a particular feature of the
phenomenon to be modeled are: cell elevation
a.s.l., cell lava thickness, cell lava temperature,
and lava thickness outflows from the central cell
toward neighbours, respectively;
• P = {w,t, T
sol
, T
vent
, r
T sol
, r
T vent
, hc
T sol
, hc
T vent
, δ,
ρ, ε, σ, c
v
} is the finite set of parameters (invari-
ant in time and space) which affect the transition
function (refer to (Spataro et al., 2010) for their
specifications);
IJCCI2013-InternationalJointConferenceonComputationalIntelligence
14

• τ : Q
9
→ Q is the cell deterministic transition
function, applied to each cell at each time step,
which describes the dynamics of lava flows, such
as cooling, solidification and lava outflows from
the central cell towards neighbouring ones.
• γ : Q
h
× N → Q
h
specifies the emitted lava thick-
ness, h, from the source cells at each step k ∈ N
(N is the set of natural numbers).
3 THE CASE STUDY: THE 2001
Mt Etna ERUPTION
As reported in (Barberi and Carapezza, 2004), the
2001 eruption of Mt. Etna began on July 17, char-
acterized by lava emission from several vents on the
southern flank of the volcano, at elevations of 2100
m, 2550 m, 2600 m, 2700 m, 2950 m, 3050 m, the
latter four being directly connected to the conduit of
the SE crater (see Figure 1). Only lava flows emit-
ted from the lowermost vents (2100 m, 2550 m, 2600
2700 m) caused damage and threatened some impor-
tant facilities and infrastructure, which were protected
by earthen barriers. Effusion rates at the main erup-
tive vents were estimated daily by (Behncke and Neri,
2003)from the volume/time ratio and were obtained
by careful mapping of the flow area and estimating its
mean thickness. The facilities of the Sapienza zone
were undoubtedly at risk because of their short dis-
tance from the 2700-m and 2550-m effusive vents (re-
spectively 3 and 2.5 km). The most probable path
for the lava flow emitted from the 2100-m fissure was
simulated (Crisci et al., 2001 and M.T. Pareschi, un-
published reports to Civil Protection) and was consid-
ered for the carried out experiments presented in the
next sections. Thirteen artificial barriers were built
during the July August 2001 Mt. Etna eruption. Their
locations, together with investigated area here consid-
ered, are shown in the map of Figure 1. The flow emit-
ted from the lower vent, the 2100-m fissure, immedi-
ately interrupted the road SP92 and invaded a part of
the adjacent wide parking area located between Mts.
Silvestri and the Sapienza zone (1900 m a.s.l.). Start-
ing on 21 July, a large barrier was progressively built
on the eastern flank of the flow to protect two tourist
facilities. This barrier worked properly and the two
buildings were saved. The lava flow emitted from the
2100-m fracture descended about 6 km southwards
(Figure 1) and after the SP92 road near Mts. Silvestri
it cut some other minor rural roads and destroyed a
few isolated country houses. Had the lava advanced
further, it would have re-crossed the SP92 road at a
lower elevation, causing the complete isolation of the
upper part of Mt. Etna. Workers and machines were
moved to a possible critical point on the western front
ready to build a diversion barrier to protect the road.
An intervention plan was also set up for the protec-
tion of the Nicolosi and Belpasso villages, located on
the most probable path of the lava, at only 4 km dis-
tance from its lowermost front. The plan included:
(a) the building of lateral barriers to drive the flow to-
ward large depressions of old quarries, located near
the lava trajectory, (b) the erection of other barriers
orthogonal to the flow direction to increase the retain-
ing capacity of the quarries and (c) the establishment
of a detailed preparedness plan for the Nicolosi and
Belpasso populations, mobile goods and cultural her-
itage. Diversion of the flow from its natural channel
near the 2100-m vent, using the technique employed
in 1992 in Valle del Bove (Barberi et al., 1993), was
also considered, as a possible last emergency measure
to be adopted should the lava have approached the vil-
lages. The decrease in the rate of effusion beginning
in the last days of July prevented any further advance
of the flow and so, fortunately, the planned interven-
tions were not necessary.
4 MORPHOLOGICAL
EVOLUTION OF PROTECTIVE
WORKS THROUGH PARALLEL
GENETIC ALGORITHMS
Genetic Algorithms (GAs) (Holland, 1992) are
general-purpose iterative search algorithms inspired
by natural selection and genetics. They have been
applied, with good results, in many different fields:
for the solution of difficult combinatorial problems
(Goncalves and Resende, 2011) in the study of the
interaction between evolution and learning (Hinton
and Nowlan, 1987); in evolutionary robotics (Nolfi
and Marocco, 2001; ElSayed et al., 2012). GAs have
also been used for improving the performance of CA
in resolving difficult computational tasks: (Piwon-
ska et al., 2013) applied GAs to a cellular automata-
based solution of a binary classification problem;
(Tomassini and Venzi, 2002) evolved asynchronous
CA to face similar problems. GAs based methods
have also been applied to CA for modelling biore-
mediation of contaminated soils (Di Gregorio et al.,
1999) and for the optimisation of lava and debris flow
simulation models (e.g., (Spataro et al., 2004; Iovine
et al., 2005; Rongo et al., 2008; D’Ambrosio et al.,
2012c; D’Ambrosio et al., 2012b)).
GAs simulate the evolution of a population of can-
didate solutions, called phenotypes, to a specific prob-
ANewMethodologyforMitigationofLavaFlowInvasionHazard-MorphologicalEvolutionofProtectiveWorksby
ParallelGeneticAlgorithms
15
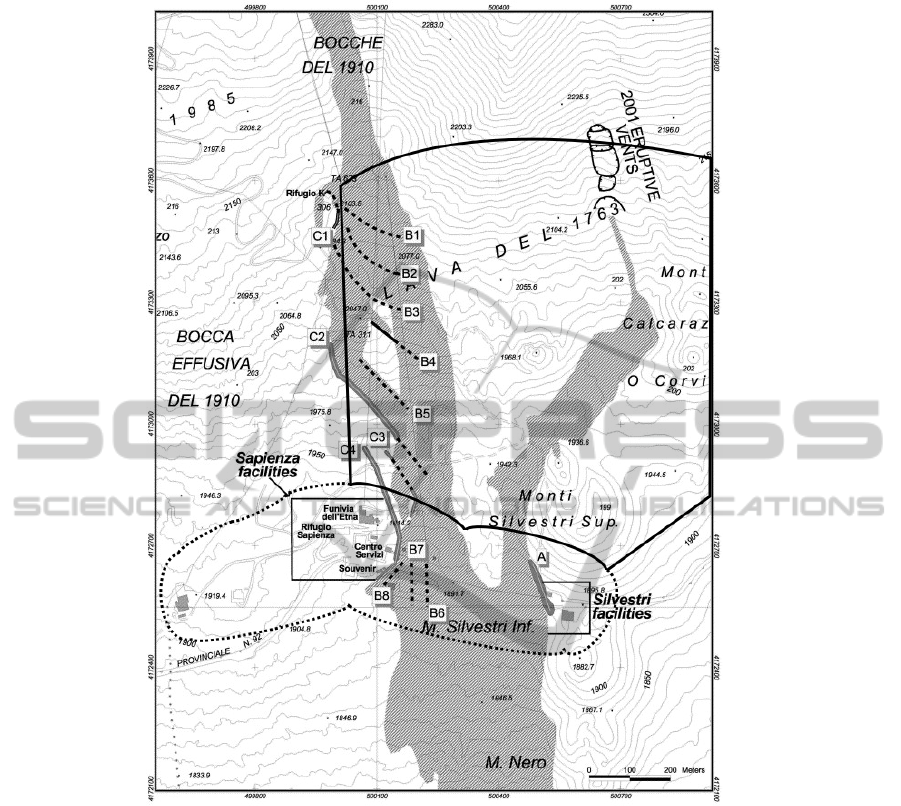
Figure 1: Set of interventions carried out during the 2001 eruption event to divert the lava flow away from the facilities. The
dashed perimeter represents the Rifugio (security area), which delimitates the area that has to be protected by the flow for the
study. The solid line perimeter (work area), specifies the area in which the earth barrier can be located (Base figure taken from
(Barberi et al., 2003)).
lem by favouring the reproduction of the best individ-
uals. Phenotypes are codified by genotypes, typically
using strings, whose elements are called genes. In or-
der to determine the best possible solution of a given
problem, the GA must explore the so-called search
(or solution) space, defined as the set of all possible
values that the genotype can assume. For example, if
the genotype codifies real numbers, the search space
is defined as the Cartesian product of the ranges in
which they are allowed to vary. The members of the
initial population are usually randomly generated and
successively evaluated by means of a “fitness func-
tion”. This latter determines the individuals “adaptiv-
ity” value (also called fitness value), i.e. a measure of
its goodness in resolving the problem. Best individu-
als are chosen by means of a “selection” operator and
reproduced by applying random “genetic” operators
to form a new population of offspring. Typical genetic
operators are “crossover” and “mutation”: they rep-
resent a metaphor of sexual reproduction and of ge-
netic mutation, respectively. According to a prefixed
probability, pairs of genotypes produce offspring via
crossover, receiving components from each parent.
Then, according to a prefixed and usually small prob-
ability, each gene of the offspring is subject to muta-
tion. The mutation operator simply changes the gene
value with another one, randomly chosen within those
allowed. The overall sequence of fitness assignment,
selection, crossover, and mutation is repeated over
many generations (i.e. the GA iterations) producing
IJCCI2013-InternationalJointConferenceonComputationalIntelligence
16

new populations of individuals. The basic idea is that
better individuals (i.e. characterised by higher fitness)
can be obtained over time by combining partial solu-
tions (i.e. portions of the genotypes) and by randomly
changing the genes values. According to the individ-
ual’s probability of selection, any change that actually
increases the individual’s fitness will be more likely
to be preserved over the selection process, thus ob-
taining better generationsas stated by the fundamental
theorem of genetic algorithms (Holland, 1992). For a
complete overview of GAs, see (Goldberg, 1989) and
(Mitchell, 1996).
While GAs have been applied several times in the
past for optimizing CA models, as the ones previ-
ously reported, by considering the 2001 Nicolosi case
study, in this work GAs were adopted in conjunction
with the SCIARA-fv2 CA model for the morphologi-
cal evolution of protective works to control lava flows.
The numerical model finite set of states was extended
by introducing two substates defined as:
Z ⊆ R (2)
where Z is the set of cells of the cellular automaton
that specifies the Safety Zone, which delimitates the
area that has to be protected by the lava flow and
P ⊆ R, P ∩ Z = (3)
where P is the set of cells of the cellular automa-
ton that indentifies the Protection Measures Zone that
identifies the area in which the protection works are
to be located.
The Protection work W = {B
1
, B
2
, ..., B
n
} was
represented as a set of barriers, where every bar-
rier B
i
= {N
i1
, N
i2
} is composed by a pair of nodes
N
i j
= {x
i j
, y
i j
, z
i j
}, where (x
i j
, y
i j
) represent CA co-
ordinates for the generic node j of the barrier i, and
z
i j
the height (expressed in m). The solutions were
encoded into a GA genotype, directly as integer val-
ues (figure 2) and a population of 100 individuals,
randomly generated inside the Protection Measures
Zone, was considered.
The choice of an appropriate fitness function is
essential to evaluate the goodness of a given solu-
tion. In the present study, two different fitness func-
tions were considered: f
1
, based on the areal com-
parison between the simulated event and the Safety
Zone (in terms of affected area) and f
2
, which consid-
ers the total volume of the protection works in order
to reduce intervention costs and environmental im-
pact.More formally, the f
1
objective function is de-
fined as:
f
1
=
µ(S ∩ Z)
µ(S ∪ Z)
(4)
where S and Z respectively identify the areal extent
of the simulated lava event and the Safety Zone area,
with µ(S ∩ Z) e µ(S ∪ Z) being the measures of their
intersection and union. The function f
1
, assumes
values within the range [0, 1] where 0 occurs when
the simulated event and Safety Zone Area are com-
pletely disjointed (best possible simulation) and 1 oc-
curs when simulated event and Safety Zone Area per-
fectly overlap (worst possible simulation). The f
2
ob-
jective function is defined as:
f
2
=
∑
|W |
i=1
p
c
· d(B
i
) · h(B
i
)
V
max
(5)
and since the barriers are composed of two nodes, the
function can be written as:
f
2
=
∑
|W |
i=1
p
c
· d(N
i1
, N
i2
) ·
¯
h(N
i1
, N
i2
)
V
max
(6)
where
¯
h(N
i1
, N
i2
) =
|z
i1
+z
i2
|
2
represents the aver-
age height value between two different nodes and
d(N
i1
, N
i2
) =
p
(x
i1
− x
i2
)
2
+ (y
i1
− y
i2
)
2
identifies its
length (in meters). The final fitness function f
2
can
be written as:
f
2
=
∑
|W |
i=1
p
c
·
p
(x
i1
− x
i2
)
2
+ (y
i1
− y
i2
)
2
·
|z
i1
+z
i2
|
2
V
max
(7)
where the parameter p
c
is the cell side and V
max
∈ R
is a threshold parameter (i.e., the maximum building
volume) given by experts, for the function normaliza-
tion. The function f
2
, assumes values within the range
[0, 1]: it is nearly 0 when the work protection is the
cheapest possible, 1 otherwise. For the genotype fit-
ness evaluation, a composite (aggregate) function f
3
was also introduced as follows:
f
3
= f
1
· ω
1
+ f
2
· ω
2
(8)
where ω
1
, ω
2
∈ R and (ω
1
+ω
2
) = 1, represent weight
parameters associated to f
1
and f
2
. Several dif-
ferent values were tested and the considered ones
in this work chosen on the basis of trial and error
techniques.The goal for the GA is to find a solu-
tion that minimizes the considered objective function
f
3
∈ [0, 1].
In order to classify each genotype in the popula-
tion, at every generation run, the algorithm executes
the following steps:
1. CA cells elevation a.s.l. are increased/decreased
in height on the basis of the genotype decoding
ANewMethodologyforMitigationofLavaFlowInvasionHazard-MorphologicalEvolutionofProtectiveWorksby
ParallelGeneticAlgorithms
17
x
11
y
11
z
11
x
12
y
12
z
12
N
11
N
12
W
x
11
y
11
x
12
y
12
z
11
z
12
y
max
x
max
2 2 5
W
6 6 1
3 7 2
3 10 2
B
1
B
2
N
11
N
12
N
21
N
22
x
11
y
11
z
11
x
12
y
12
z
12
x
21
y
21
z
21
x
22
y
22
z
22
y coordinate
x coordinate
Height (m)
Figure 2: Barriers encoding into a GA genotype.
(i.e, the barrier cells). To complete this step, an
extending Bresenham‘s original algorithm (Bre-
senham, 1965) is applied to determine the cells
inside the segment between the work protection
extremes and f
2
subsequently computed.
2. A SCIARA-fv2 simulation is performed (about
40000 calculation steps) and the impact of the lava
thickness on Z area ( f
1
computation) is evaluated.
3. f
3
is computed and individuals are sorted accord-
ing to their fitness.
The adopted GA is a rank based and elitist model,
as at each step only the best genotypes generate off-
spring. The 20 individuals which have the highest fit-
ness generate five off-spring each and the 20 × 5 =
100 offspring constitute the next generation. After the
rank based selection, the mutation operator is applied
with the exception of the first 5 individuals.
The complete list of GA characteristics and pa-
rameters is reported in Table 1. Each gene muta-
tion probability depends on its representation: p
mc
for genes corresponding to coordinates value and p
mh
viceversa. Therefore, if during the mutation process,
a coordinate gene is chosen to be modified, the new
value will depend on the parameters x
max
and y
max
which represent the cell radius within the node, the
position of which can vary. The interval [h
min
, h
max
]
is the range within which the values of height nodes
are allowed to vary (Figure 3). This strategy ensures
the possibility for the GA to provide, as output, either
protective barriers or dams.
4.1 Parallel Implementation and
Performance
To evaluate a given GA individual, an entire CA simu-
lation has to be performed, followed by a comparison
x
11
y
11
z
11
x
12
y
12
z
12
N
11
N
12
W
x
11
y
11
x
12
y
12
z
11
z
12
y
max
x
max
Figure 3: Graphical representation of the genotype mutation
phase. Each gene, representing a CA coordinate, can vary
within a variation radius (x
max
, y
max
).
of the obtained result with the actual case study. De-
pending on the adopted computer framework, such an
operation may require several seconds, or even sev-
eral hours. For example, on a 2-Quadcore Intel Xeon
E5472, 3.00 GHz CPU such evaluation requires ap-
proximately 10 min, as at least 40,000 CA steps are
required for a simulation. Thus, if the GA population
is composed of 100 individuals, the time required to
run one seed test (100 steps) exceeds 69 days. More-
over, the GA execution can grow, depending on both
the extent of the considered area and the number of
different tests to run.
Due to the high computational complexity of the
algorithm, a CPU/GPU library was developed to ac-
celerate the GA running. A “Master-Slave” model
was adopted in which the Host-CPU (Master) exe-
cutes the GA steps (selection, population replacement
Table 1: List of parameters of the adopted GA.
GA Specification Value
parameters
g
l
Genotypes length 6
p
s
Population size 100
n
g
Number of generations 100
p
mc
Coord. gene mutation probability 0.5
x
max
Gene x position variation radius 10
y
max
Gene y position variation radius 10
p
mh
Height gene mutation probability 0.5
h
min
height min variation range -5
h
max
height max variation range 10
c
h+
Cost to build 1
c
h−
Cost to dig 1
ω
f 1
f
1
weight parameter 0.90
ω
f 2
f
2
weight parameter 0.10
IJCCI2013-InternationalJointConferenceonComputationalIntelligence
18
0 20 40
60
80 100
600
800
1,000
1,200
1,400
Number of simultaneous simulations
Elapsed time in s
WCSI ALGORITHM
GTX 480
GTX 580
GTX 680
Tesla 2075
(a)
0 20 40
60
80 100
200
400
600
800
1,000
1,200
Number of simultaneous simulations
Elapsed time in s
MDGI ALGORITHM
GTX 480
GTX 580
GTX 680
Tesla 2075
(b)
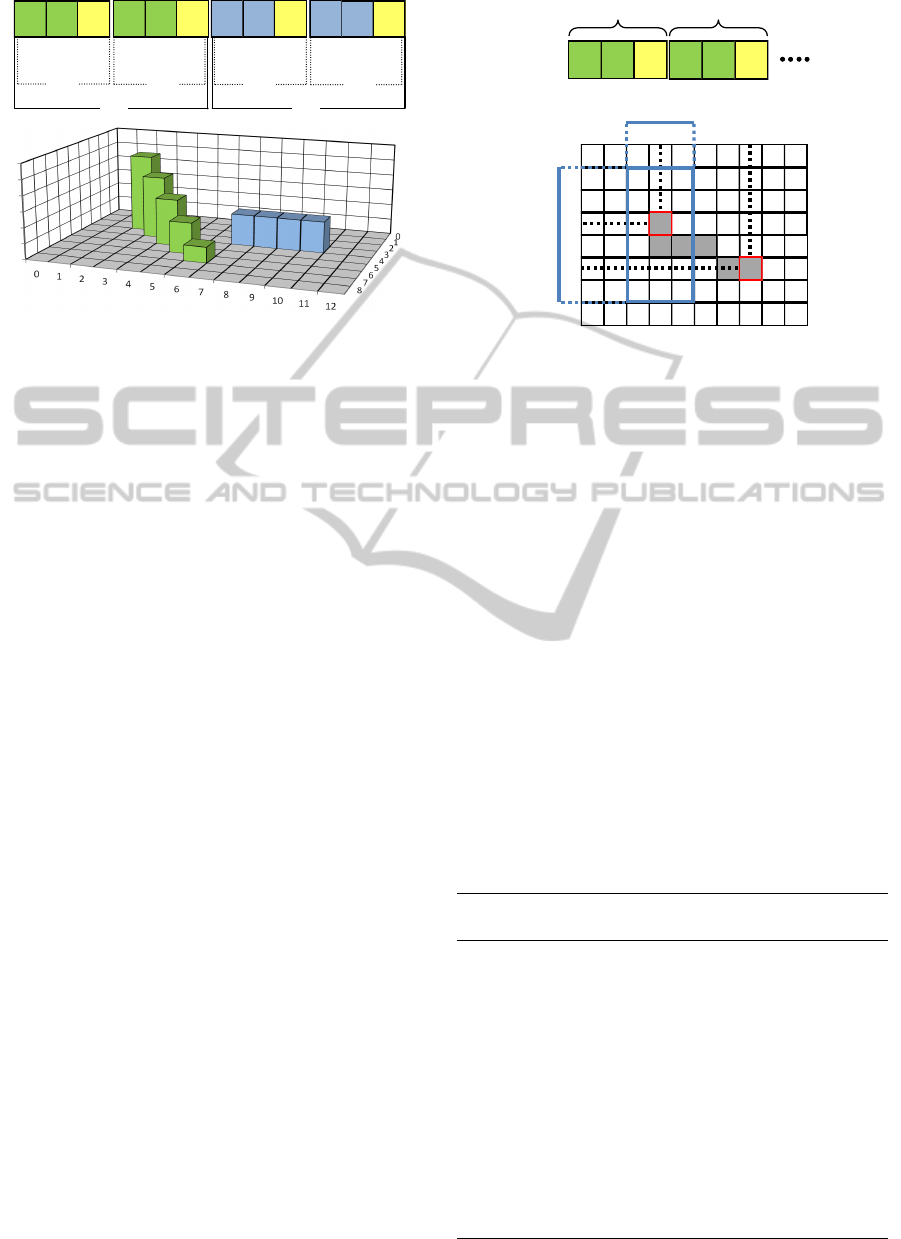
Figure 4: Elapsed time as a function of simultaneus lava events usign the WCSI (a) and MDGI (b) approaches on different
considered GPGPU hardware.
and mutation), while GPU cores (slaves) evaluate the
individuals fitness.
In order to test and evaluate the different im-
plementation strategies, a landscape benchmark case
study was considered, modeled through a Digital El-
evation Model composed of 200 × 318 square cells
with a side of 10 m. A set of 50 hypothetical barriers
placed with 2 different inclinations (135
◦
, 225
◦
) to the
lava flow direction was considered leading to a total
of 100 simulations to be performed. Two paralleli-
sation strategies and different graphic hardware were
adopted in all experiments reported below. In particu-
lar, four CUDA devices were used in the experiments:
one nVidia Tesla C2075 and three nVidia Geforce
graphic cards, namely the GTX480, GTX 580 and the
GTX 680.Also, in order to quantify the achieved par-
allel speedup, sequential versions of the same GPU
strategies were run on a workstation equipped with a
2-Quadcore Intel Xeon E5472 (3.00 GHz) CPU.
Inspired by previous works in CA modelling with
GPGPU (D’Ambrosio et al., 2012a; Filippone et al.,
2011), a first straightforward parallel implementation,
labeled as WCSI (Whole Cellular Space Implemen-
tation) was considered where the CUDA kernels op-
erate on the whole automaton. Since during a lava
flow simulation only the transition function of the cur-
rently active cells do significant computation, simu-
lating only one simulation at a time would imply a
high percentage of uselessly scheduled threads. In
addition, given the small size of most simulations (on
average, 20% of cells of the entire automaton are ac-
tive during a single simulation), the number of active
threads would be too low to allow the GPU to ef-
fectively activate the latency-hiding mechanism. For
these reasons, in the WCSI approach more than a sin-
gle lava episode are simultaneously executed. This
means that the main CUDA kernel is executed over a
number of simulations which are propagated at the
same CA step. In particular, each simulation per-
formed is mapped on a different value of z and on
a grid of threads composed of 16 × 16 blocks. That
is, the grid of threads used for the CA transition func-
tion is three-dimensional, with the base representing
the considered CA space and the vertical dimension
corresponding to the simulations.
For a fair comparison, the sequential version of
the same algorithm was used and the elapsed time
achieved by the CPU was 26039 s. Using the adopted
GPU devices, the algorithm was solved with the
WCSI approach and a variable number of simulta-
neous lava simulations. According to the results
shown in Figure 4.a, the GTX 680 achieved the low-
est elapsed time of 650,96s, concurrently simulating
50 lava events. The gain provided by the paralleli-
sation in terms of computing time was significant and
corresponded to a parallel speedup of 40 over the used
CPU.
A critical aspect of CA implementations that can
improve performance, which is also related to CA se-
quential versions, is that the application of the transi-
tion function can be restricted to the only active cells
where computation is actually taking place. When
considering a phenomenon (e.g., a lava flow) that is
topologically connected (i.e., a simulation starts from
few active cells and evolves by activating neighbour
cells), the CA space can be confined within a rectan-
gular bounding box (RBB). This optimization drasti-
cally reduces execution times, since the sub-rectangle
is usually quite smaller than the original CA space. In
case of the above WCSI CA GPGPU implementation,
ANewMethodologyforMitigationofLavaFlowInvasionHazard-MorphologicalEvolutionofProtectiveWorksby
ParallelGeneticAlgorithms
19
0 20 40
60
80 100
0.00
0.05
0.10
0.15
0.20
0.25
0.30
generation
fitness
Fitness f
3
(average on 10 seeds)
best individual
average f
3
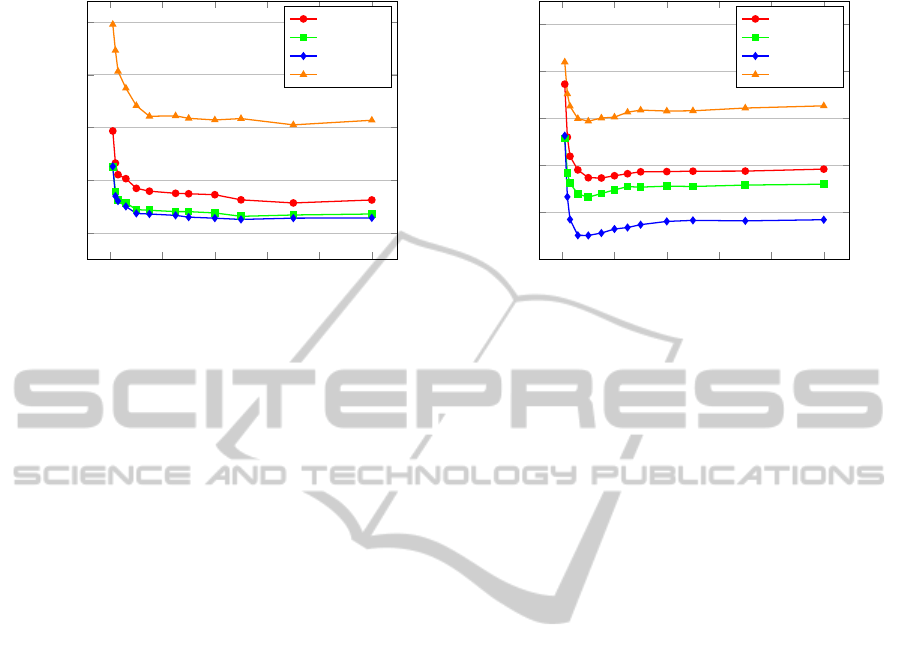
Figure 5: Temporal evolution of composite f
3
fitness of best
individual (in black) and of average fitness of whole popu-
lation (in gray). Fitness values were obtained as an average
of 10 GA runs, carried out by adopting different seeds for
generation of random numbers.
this weakness is even more evident due to the diffi-
culty of having a high percentage of computationally
active threads in the CUDA grid. For these reasons,
an alternative approach was developed in which the
grid of threads is dynamically computed during the
simulation in order to keep low the number of com-
putationally irrelevant threads. In such an approach,
labelled as DGI (Dynamic Grid Implementation), a
number of lava flow simulations are simultaneously
executed as in the WCSI procedure.
In order to perform a fair comparison, an anal-
ogous strategy based on the bounding box has been
developed for the sequential version of the program.
Using the reference CPU, such sequential procedure
required 20180 s for the case study adopted. Figure
4.b shows the corresponding times taken by the paral-
lel DGI approach as a function of the number of con-
current simulations. As seen, the GTX 680 achieved
the lowest elapsed time of 301,18s, corresponding to
a parallel speedup of 67.
4.2 Experiment and Results
By considering the Nicolosi lava flow event, ten GA
runs (based on different random seeds) of 100 gener-
ation steps each were carried out, each one with a dif-
ferent initial population. The elapsed time achieved
for the ten GA runs was less than nine hours of com-
putation on a 10 multi-GPU GTX 680 GPU Kepler
Devices Cluster (note that the same experiment, on a
sequential machine, would had lasted more than seven
months). Furthermore, during the running, a Visu-
alization System Software (Filippone et al., 2013),
0 20 40
60
80 100
0
0.1
0.2
0.3
0.4
0.5
0.6
generation
fitness
Fitness f
1
and f
2
(average on 10 seeds)
f
1
f
2
Figure 6: Temporal evolution of average fitness f
1
(in red)
and f
2
(in green) of whole population. Fitness values were
obtained as an average of 10 GA runs, carried out by adopt-
ing different seeds for generation of random numbers.
based on OpenGL and C ++ and integrated into Qt in-
terface, allowed the interactive visualization and anal-
ysis phases of the results.
For this preliminary experiment, only solutions
with two nodes were considered (|W | = 1), while Z
and P were chosen as in Figure 1. The cardinality
of W (Protection work) and the gene values in which
they are allowed to vary (depending of Z area), define
the search space S
r
for the GA:
S
r
= {[P
x
min
, P
x
max
] × [P
y
min
, P
y
max
]×
[(h
min
· n
g
), (h
max
· n
g
)]}
2|W |
(9)
The temporal evolution of the f
3
fitness is graphically
reported in Figure 5, in terms of average results over
the ten considered experiments. GA experiment pa-
m
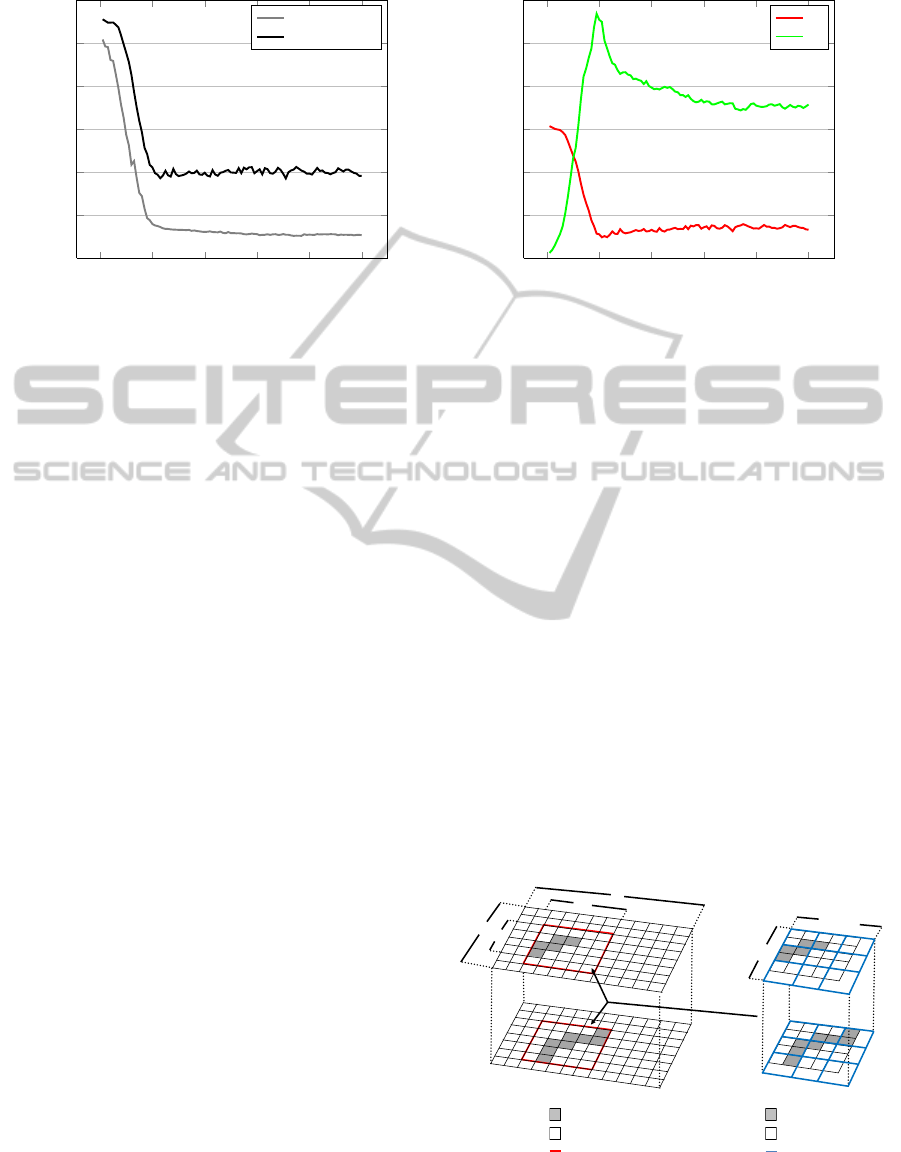
Active cells
Inactive cells
n
b
n
m
Computing thread
Inactive thread
n
n
b
+x
RBB
m
b
Grid blocks
m
b
+y
Simulation n
Simulation 1
Common RBB
n
m
n
b
m
b
n
b
+x
m
b
+y
CA
Grids of threads
MS-DGM
AGA/HMA DGA
Active cells
Inactive cells
RBB
Computing thread
Inactive thread
Grid blocks
Figure 7: Mapping of the CA transition function into a
CUDA grid of threads (right) in case of the simultaneous
lava flows (left).
IJCCI2013-InternationalJointConferenceonComputationalIntelligence
20
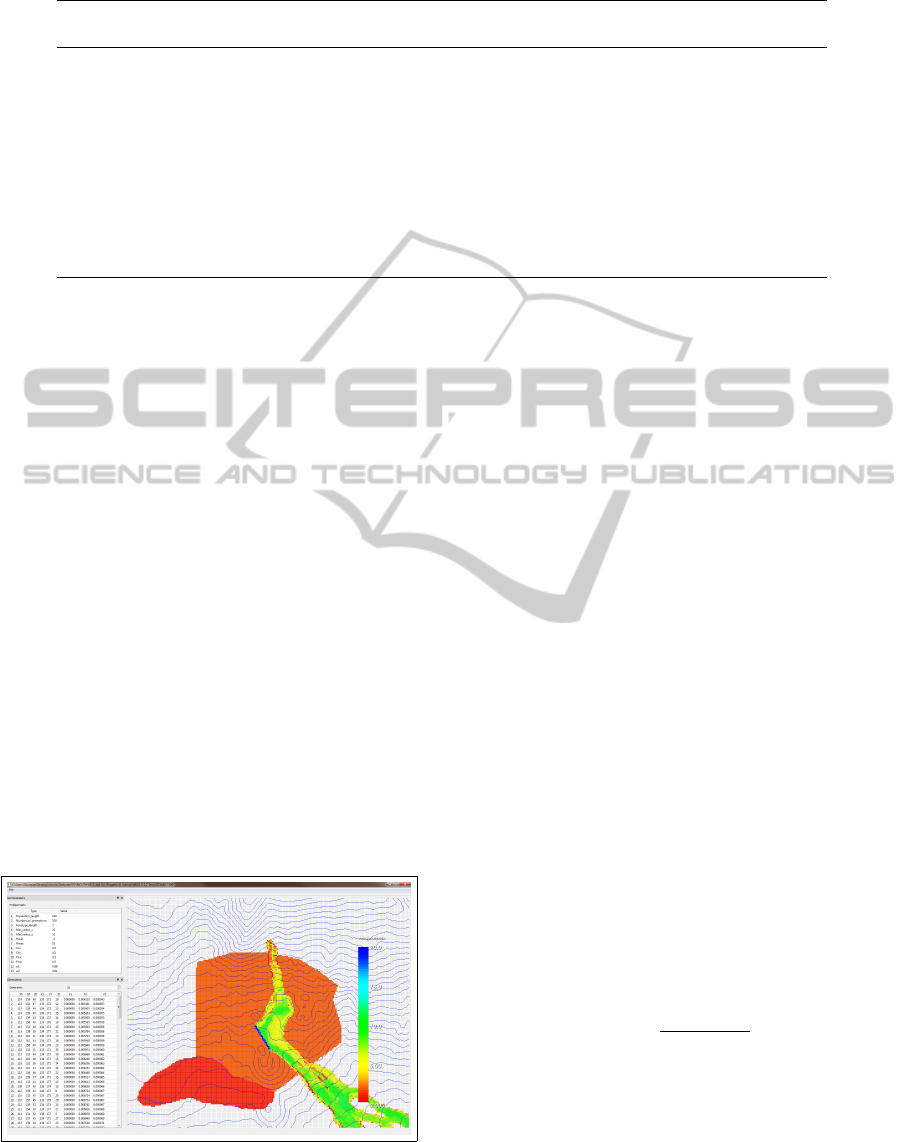
Table 2: Dimensions of the ten best barriers carried out by GA run.
Seed Barrier Length Height Base Width Volume Inclination
test (m) (m) (m) (m
3
) (degrees)
1234 [134,173,18] [114,158,35] 250 26,5 10 66250 143
2345 [135,178,8] [114,157,43] 297 25,5 10 75731 135
3456 [133,172,19] [115,155,37] 247 28 10 69324 137
4567 [113,158,45] [ 132,177,9] 269 27 10 72549 135
5678 [115,154,44] [133,171,14] 248 29 10 71800 137
6789 [133,172,12] [115,155,42] 248 27 10 66848 137
7890 [114,159,40] [133,171,10] 225 25 10 56180 148
8901 [115,156,48] [134,173,9] 255 28,5 10 72661 138
9101 [134,173,8] [114,157,41] 256 24,5 10 62750 141
1011 [115,152,38] [134,172,18] 276 28 10 77241 134
rameters values are also listed in table 1. The related
CA simulation, obtained by adopting the best individ-
ual is shown in Figure 8.
The study, though preliminary, has produced quite
satisfying results. Among different best individuals
generated by the GA for each seed test (table 2), the
best one consists of a barrier with an average height
of 25 m and 220 m in length with an inclination angle
of 130
◦
with respect to the direction of the lava flow.
The barrier (seed 7890 in table 2) completely deviates
the flow avoiding that the lava reaches the inhabited
area. The relative elevated height of the barrier is due
to the adopted GA (only solutions characterized by
single walls) and problem constraints, like the crater
location too close to the area to be protected or the
morphology characteristics.
4.3 Considerations on the GA Dynamics
and Emergent Behaviors
In the GA experiments that have been performed, in-
dividuals with high fitness evolved rapidly, even if
Figure 8: SCIARA - fv2 simulation visualization adopting
the GA best solution. As seen, the devised barrier (in blue)
completely diverts the lava flow from the Safety Area (in
red).
the initial population was randomly generated and the
search space was quite large (Equation 9). By ana-
lyzing several individuals evolved in ten different GA
executions, similar solutions were observed. This be-
havior is due to the presence of problem constraints
(e.g. morphology, lava vent, emission rate, Z and P
areas) that lead the GA to search in a “region” of the
solution space characterized by a so called “local op-
timum”. In particular, f
1
reaches the minimum value
(0) around the twentieth GA generation and the re-
maining 80 runs are used by GA for the f
2
optimiza-
tion (cf. Figure 6).
In any case, the evolutionary process has shown,
in accordance with the opinion of the scientific com-
munity (Barberi et al., 2003; Fujita et al., 2009), the
ineffectiveness of barriers placed perpendicular to the
lava flow direction despite diagonally oriented solu-
tions (130
◦
− 160
◦
) (see Table 2).
Furthermore, a systematic exploitation of morpho-
logical characteristics by GA, during the evolution-
ary process, has emerged. To better investigate such
GA emergence behaviour, a study of nodes distribu-
tion was conducted (Figure 9). By considering the
best 100 solutions provided by GA, each node was
classified on the basis of the slope proximity calcu-
lation, as an average of altitude differences between
node neighborhood cells (radius 10) and the central
cell. More formally, the function that assigns to each
generic node j a slope proximity value is defined as:
sp
j
=
∑
|X|
i=1
¯z
i
− ¯z
0
|X|
(10)
where X is the set of cells that identifies the neighbor-
hood of j and ¯z
i
∈ Q
z
is the topographics altitude (in-
dex 0 represents the central cell). As shown in Figure
10, starting from the tenth GA generation, the evolu-
tionary process has shown an increase in slope prox-
imity values. Therefore, after the f
1
optimization (cf.
Figure 6), in order to minimize f
2
, there is a specific
ANewMethodologyforMitigationofLavaFlowInvasionHazard-MorphologicalEvolutionofProtectiveWorksby
ParallelGeneticAlgorithms
21

evolutionary temporal phase (i.e., up to the 25
th
gen-
eration) where the algorithm generates solutions that
are located in the proximity of elevated slopes.
5 CONCLUSIONS AND FUTURE
WORKS
This paper has presented a novel approach for devis-
ing protective measures to divert lava flows. Starting
from the problem of the high computational complex-
ity of the GA algorithm, a library was developed for
executing a large number of concurrent lava simula-
tions using GPGPU. The parallel speedups attained
through the proposed approaches and by considering
GPGPU hardware, were indeed significant. In fact,
the adoption of PGAs permitted to perform, in rea-
sonable times, a greater number of tests shortening
the execution by a factor of 67. In addition to the GA
algorithm acceleration implementation, an interaction
visualization system was also developed for the anal-
ysis phases of the results.
In this preliminary release of the algorithm only
two nodes based solutions were considered and eval-
uated on the basis of two fitness functions. The first
fitness function guarantees the goodness of the solu-
tion in terms of security; the second one minimizes
the environmental impact.
First observations of the GA results permitted to
conjecture the presence of a local optima in the search
space, probably due to problem constraints. To bet-
ter investigate GA dynamic characteristics, a study of
nodes distribution was also conducted and a system-
atic exploitation of morphological characteristics by
GA during the evolutionary process emerged.
Figure 9: Nodes distribution of the best 100 solutions gener-
ated by the GA. Scale values indicates occurrence of nodes.
0 20 40
60
80 100
0
4
8
12
16
20
generation
¯sp
sp evolution(average on 10 seeds)
Figure 10: Temporal evolution of average slope proximity
values for the best individuals.
PGAs experiments, carried out by considering the
Nicolosi case-study, demonstrated that artificial barri-
ers can successfully change the direction of lava flow
in order to protect predefined point of interests. In
particular, by performing extensive experiments, sim-
ulations demonstrated that protective works are more
effective when placed nearly parallel to the flow di-
rection, while a barrier placed perpendicular to the
flow direction can only stop the flux temporarily, ulti-
mately allowing the solidified crust to accumulate and
cause the following mass to go over the barrier.
Though preliminary, the study has produced ex-
tremely positive results and simulations have demon-
strated that GAs can represent a valid tool to deter-
mine protection works construction in order to miti-
gate the lava flows risk.
Future work will consider the investigation of so-
lutions consisting of multiple protective interventions
and the introduction, within the methodology, of lava
cooling by water jets.
ACKNOWLEDGEMENTS
This work was partially funded by the European Com-
mission European Social Fund (ESF) and by the Re-
gione Calabria (Italy). Authors are also grateful to
Plymouth University (UK) and the CUDA Teaching
Center of the same University for supplying comput-
ing facilities.
IJCCI2013-InternationalJointConferenceonComputationalIntelligence
22

REFERENCES
Avolio, M. V., Crisci, G. M., Di Gregorio, S., Rongo, R.,
Spataro, W., and D’Ambrosio, D. (2006). Pyroclastic
flows modelling using Cellular Automata. Computers
& Geosciences, 32:897–911.
Barberi, F., Brondi, F., Carapezza, M., Cavarra, L., and
Murgia, C. (2003). Earthen barriers to control lava
flows in the 2001 eruption of Mt. Etna. Journal of
Volcanology and Geothermal Research, 123:231–243.
Barberi, F., Carapezza, M., Valenza, M., and Villari, L.
(1993). The control of lava flow during the 1991-
1992 eruption of Mt. Etna. Journal of Volcanology
and Geothermal Research, 56:1–34.
Barberi, F. and Carapezza, M. L. (2004). Mt. Etna: Volcano
Laboratory, chapter The Control of Lava Flows at Mt.
Etna, pages 357–369. American Geophysical Union,
Washington, D. C.
Barca, D., Crisci, G. M., Di Gregorio, S., and Nicoletta, F.
(1994). Cellular Automata for simulating lava flows: a
method and examples of the etnean eruptions. Trans-
port Theory and Statistical Physics, 23(1-3):195–232.
Behncke, B. and Neri, M. (2003). The July-August 2001
eruption of Mt. Etna (Sicily). Bulletin of Volcanology,
65(7):461–476.
Bentley, P. (1999). An introduction to evolutionary design
by computers. In Bentley, P. J., editor, Evolutionary
Design by Computers, chapter 1, pages 1–73. Morgan
Kaufman, San Francisco, USA.
Bongard, J. (2011). Morphological change in ma-
chines accelerates the evolution of robust behavior.
Proceedings of the National Academy of Sciences,
108(4):1234–1239.
Bresenham, J. (1965). Algorithm for computer control of a
digital plotter. IBM Systems Journal, 4(1):25–30.
Colombrita, R. (1984). Methodology for the construction of
earth barriers to divert lava flows: The Mt. Etna 1983
eruption. Bulletin Volcanologique, 47(4):1009–1038.
Crisci, G. M., Rongo, R., Gregorio, S. D., and Spataro, W.
(2004). The simulation model SCIARA: the 1991 and
2001 lava flows at Mount Etna. Journal of Volcanol-
ogy and Geothermal Research, 132(23):253 – 267.
D’Ambrosio, D., Filippone, G., Rongo, R., Spataro, W.,
and Trunfio, G. A. (2012a). Cellular automata and
GPGPU: an application to lava flow modeling. Inter-
national Journal of Grid and High Performance Com-
puting, 4(3):30–47.
D’Ambrosio, D., Rongo, R., Spataro, W., and Trunfio, G.
(2012b). Optimizing Cellular Automata through a
Meta-model Assisted Memetic Algorithm. In Pro-
ceedings of Parallel Problem Solving from Nature -
PPSN XII, volume 7492 of Lecture Notes in Computer
Science, pages 317–326. Springer Berlin Heidelberg.
D’Ambrosio, D., Rongo, R., Spataro, W., and Trunfio, G. A.
(2012c). Meta-model assisted evolutionary optimiza-
tion of cellular automata: an application to the sciara
model. In Proceedings of the 9th international confer-
ence on Parallel Processing and Applied Mathematics
- Volume Part II, PPAM’11, pages 533 – 542, Berlin,
Heidelberg. Springer-Verlag.
Del Negro, C., Fortuna, L., Herault, A., and Vicari, A.
(2008). Simulations of the 2004 lava flow at Etna
volcano using the magflow cellular automata model.
Bulletin of Volcanology, 70(7):805–812.
Di Gregorio, S. and Serra, R. (1999). An empirical method
for modelling and simulating some complex macro-
scopic phenomena by cellular automata. Future Gen-
eration Computer Systems, 16(2-3):259–271.
Di Gregorio, S., Serra, R., and Villani, M. (1999). Ap-
plying cellular automata to complex environmental
problems: The simulation of the bioremediation of
contaminated soils. Theoretical Computer Science,
217(1):131 – 156.
Dibben, C. (2008). Leaving the city for the suburbs -
The domincance of ’ordinary’ decision making over
volkanik risk perception in the production of volcanic
risk on Mt. Etna, sicily. Journal of Volcanology and
Geothermal Research, 172(7):288–299.
ElSayed, A., Kongar, E., Gupta, S., and Sobh, T. (2012). A
Robotic-Driven Disassembly Sequence Generator for
End-Of-Life Electronic Products. Journal of Intelli-
gent & Robotic Systems, 68(1):43–52.
Filippone, G., Spataro, D’Ambrosio, D., and Marocco, D.
(2013). An interactive Visualization System for Lava
Flows Cellular Automata Simulations using CUDA.
Poster presented at GPU Technology Conference, San
Jose, California.
Filippone, G., Spataro, W., Spingola, G., D’Ambrosio, D.,
Rongo, R., Perna, G., and Di Gregorio, S. (2011).
GPGPU programming and cellular automata: Imple-
mentation of the SCIARA lava flow simulation code.
In 23rd European Modeling and simulation Sympo-
sium (WMSS), Rome, Italy.
Fujita, E., Hidaka, M., Goto, A., and Umino, S. (2009).
Simulations of measures to control lava flows. Bul-
letin of Volcanology, 71:401–408.
Goldberg, D. E. (1989). Genetic Algorithms in Search, Op-
timization and Machine Learning. Addison-Wesley
Longman Publishing Co., Inc., Boston, MA, USA, 1st
edition.
Goncalves, J. F. and Resende, M. G. (2011). Biased
random-key genetic algorithms forcombinatorial op-
timization. Journal of Heuristics, 17(5):487–525.
Hinton, G. E. and Nowlan, S. J. (1987). How learning can
guide evolution. Complex Systems, pages 495–502.
Holland, J. H. (1992). Adaptation in Natural and Artificial
Systems: An Introductory Analysis with Applications
to Biology, Control, and Artificial Intelligence. The
MIT Press.
Iovine, G., D’Ambrosio, D., and Di Gregorio, S. (2005).
Applying genetic algorithms for calibrating a hexago-
nal cellular automata model for the simulation of de-
bris flows characterised by strong inertial effects. Ge-
omorphology, 66(14):287 – 303.
Ishihara, K., Iguchi, M., and Kamo, K. (1990). Numerical
simulation of lava flows on some volcanoes in Japan.
In Fink, J. H., editor, Lava Flows and Domes, vol-
ume 2 of IAVCEI Proceedings in Volcanology, pages
174–207. Springer Berlin Heidelberg.
ANewMethodologyforMitigationofLavaFlowInvasionHazard-MorphologicalEvolutionofProtectiveWorksby
ParallelGeneticAlgorithms
23

Kicinger, R., Arciszewski, T., and Jong, K. D. (2005). Evo-
lutionary computation and structural design: A sur-
vey of the state-of-the-art. Comput. Struct., 83(23-
24):1943–1978.
Lipson, H. and Pollack, J. B. (2000). Automatic De-
sign and Manufacture of Artificial Lifeforms. Nature,
406:974–978.
MacDonald, G. A. (1962). The 1959 and 1960 eruptions
of Kilauea volcano, Hawaii, and the construction of
walls to restrict the spread of the lava flows. Bulletin
Volcanologique, 24(1):249–294.
Mitchell, M. (1996). An introduction to Genetic Algorithms.
MIT Press, Cambridge, MA, USA.
Miyamoto, H. and Sasaki, S. (1997). Simulating lava flows
by an improved cellular automata method. Computers
& Geosciences, 23(3):283–292.
Nolfi, S. and Marocco, D. (2001). Evolving robots able to
integrate sensory-motor information over time. The-
ory in Biosciences, 120:287–310.
Piwonska, A., Seredynski, F., and Szaban, M. (2013).
Learning cellular automata rules for binary classi-
fication problem. The Journal of Supercomputing,
63(3):800–815.
Rongo, R., Spataro, W., D’Ambrosio, D., Avolio, M. V.,
Trunfio, G. A., and Di Gregorio, S. (2008). Lava flow
hazard evaluation through cellular automata and ge-
netic algorithms: an application to Mt Etna volcano.
Fundam. Inf., 87:247–267.
Sims, K. (1994). Evolving 3d morphology and behavior
by competition. In Proceedings of Artificial Life IV,
pages 28–39. MIT Press.
Spataro, W., Avolio, M. V., Lupiano, V., Trunfio, G. A.,
Rongo, R., and D’Ambrosio, D. (2010). The latest
release of the lava flows simulation model SCIARA:
First application to Mt Etna (Italy) and solution of the
anisotropic flow direction problem on an ideal sur-
face. In International Conference on Computational
Science, pages 17–26.
Spataro, W., D’Ambrosio, D., Rongo, R., and Trunfio, G.
(2004). An Evolutionary Approach for Modelling
Lava Flows through Cellular Automata. In ACRI
2004, volume 3305 of Lecture Notes in Computer Sci-
ence, pages 725–734. Springer Berlin Heidelberg.
Tomassini, M. and Venzi, M. (2002). Artificially evolved
asynchronous cellular automata for the density task.
In Procedings of the fifth International Conference on
Cellular Automata for Research and Industry., volume
2493 of Lecture Notes in Computer Science, pages
44–55. Springer Berlin Heidelberg.
IJCCI2013-InternationalJointConferenceonComputationalIntelligence
24
