
Applicability of Quality Metrics for Ontologies on Ontology Design
Patterns
Rebekka Alm, Sven Kiehl, Birger Lantow and Kurt Sandkuhl
University of Rostock, Chair of Business Information Systems, Albert-Einstein-Str. 22, 18059 Rostock, Germany
Keywords:
Ontology Design Patterns, Quality Metrics, Semantic Web, Ontology Engineering.
Abstract:
Ontology Design Patterns (ODPs) provide best practice solutions for common or recurring ontology design
problems. This work focuses on Content ODPs. These form small ontologies themselves and thus can be sub-
ject to ontology quality metrics in general. We investigate the use of such metrics for Content ODP evaluation
in terms of metrics applicability and validity.
The quality metrics used for this investigation are taken from existing work in the area of ontology quality
evaluation. We discuss the general applicability to Content ODPs of each metric considering its definition,
ODP characteristics, and the defined goals of ODPs. Metrics that revealed to be applicable are calculated for a
random set of 10 Content ODPs from the ODP wiki-portal that was initiated by the NeOn-project. Interviews
have been conducted for an explorative view into the correlation of quality metrics and evaluation by users.
1 INTRODUCTION
In most engineering disciplines, quality is considered
an essential factor for acceptance of technologies and
solutions, for efficiency of the processes and for ro-
bustness and usability of products. With an increas-
ing use of ontologies in industrial applications, stan-
dards, procedures and metrics for quality assessment
of ontology construction processes and the artifacts
produced during these processes also gain of impor-
tance. Although considerable efforts have been spent
on developing ontology assessment and evaluation
approaches, including metrics and ways to measure
quality (cf. Section 2.3), generally accepted practices
for industrial use are still missing.
The objective of this paper is to contribute to qual-
ity ontologies by focusing on ontology design patterns
and ways to determine their quality. Ontology design
patterns (ODP) have been proposed as encodings of
best practices (cf. Section 2.2) supporting ontology
construction by facilitating reuse of proven solution
principles. This paper focuses specifically on Con-
tent ODP and on investigating the transferability of
ontology quality metrics to Content ODP. The long
term objective is to create an instrument for quality
assurance in practice, i.e. the main intention is not
to develop new fundamental knowledge about ODP
characteristics and measurement options, but to rather
evaluate how to transfer metrics from the ontology
area and what metrics to transfer. Research results
presented in this paper are based on a research process
with two phases. In the first phase, we conducted a
literature research in the area of metrics for assessing
ontology quality. The results of this step are summa-
rized in section 2.3 and section 3, respectively. The
second phase consisted of a two-step evaluation of
the ontology metrics identified in the literature anal-
ysis. During the first step, we investigated whether
it is feasible to apply the metrics for content ODP,
i.e. to use the measurement procedures defined for
a metric and determine the actual value for a given
set of patterns. The set of patterns used consisted of
10 randomly selected patterns from the ODP portal.
If it was possible to calculate the metric value, we
furthermore took into account whether metric values
were significant for differentiating between different
ODP, i.e. for large ontologies a metric value may well
characterize an ontology, but for small ODP the same
metric may always show very similar or identical val-
ues, which are unlikely to help differentiating quality.
In the second step, we only considered those metrics
that passed the feasibility test during the first step. In
a controlled experiment, the quality indicated by the
metric value was contrasted with the perception of on-
tology engineers, i.e. do ”measured quality” and ”per-
ceived quality” match?
The contributions of this paper are (1) the evalu-
ation of a selected set of ontology metrics regarding
48
Alm R., Kiehl S., Lantow B. and Sandkuhl K..
Applicability of Quality Metrics for Ontologies on Ontology Design Patterns.
DOI: 10.5220/0004541400480057
In Proceedings of the International Conference on Knowledge Engineering and Ontology Development (KEOD-2013), pages 48-57
ISBN: 978-989-8565-81-5
Copyright
c
2013 SCITEPRESS (Science and Technology Publications, Lda.)

their applicability for content ODPs and (2) the per-
ception of ontology engineers regarding applicability
and usefulness of promising metrics.
The remainder of this paper is structured as fol-
lows. Section 2 gives an overview of research in the
area of Content ODPs and ontology evaluation. We
discuss possible quality metrics and their calculation
in section 3. The metrics that qualify for Content
ODPs are validated by a survey which we describe
in section 4. Section 5 aggregates our findings and
gives a outlook on future research needs.
2 BACKGROUND AND RELATED
WORK
Relevant background for this paper includes knowl-
edge patterns (section 2.1), ontology design patterns
(section 2.2), and approaches for quality assurance of
ontologies and ODP (section 2.3).
2.1 Knowledge Patterns
The term knowledge pattern has been explicitly de-
fined by Clark, Thomson and Porter in the context
of knowledge representation (Thompson et al., 2000).
They define ”a pattern as a first-order theory whose
axioms are not part of the target knowledge-base, but
can be incorporated via a renaming of the non-logical
symbols” (Thompson et al., 2000, p.6). The in-
tention is to help construct formal ontologies by ex-
plicitly representing recurring patterns of knowledge,
so called theory schemata, and by mapping these
patterns on domain-specific concepts. Staab, Erd-
mann and Maedche (Staab et al., 2001) investigated
the use of so called ”semantic patterns” for enabling
reuse across languages when engineering machine-
processable knowledge. Semantic patterns consist in
this approach of one description of the core elements
independent from the actual implementation and for
each target language a description that allows for
translating the core elements into the target language.
The structure of the informal description consists of
eight elements, which resemble the elements of de-
sign patterns (e.g. name, intent, motivation, structure,
etc.); the translation into a language includes transla-
tion mapping, samples, applicability and comments.
Compared to knowledge patterns, semantic patterns
try to separate engineering knowledge from language-
specific implementations instead of theories from do-
mains they are applied in. Knowledge formalization
patterns have been proposed by Puppe as rather sim-
ple templates proven in practice for the (mass) for-
malization of knowledge (Puppe, 2000). Puppe puts a
lot of emphasis on proven problem solving methods,
which uncover implicit knowledge of experts. Knowl-
edge formalization patterns consist of well-defined
problem solving methods, a graphical notation, and
simple-to-understand mental model.
2.2 Ontology Design Patterns
In a computer science context, ontologies usually are
defined as explicit specifications of a shared concep-
tualization (Gruber, 1993). Due to the increasing use
of ontologies in industrial applications, ontology de-
sign, ontology engineering and ontology evaluation
have become a major concern. The aim is to effi-
ciently produce high quality ontologies as a basis for
semantic web applications or enterprise knowledge
management. Despite quite a few well-defined ontol-
ogy construction methods and a number of reusable
ontologies offered on the Internet, efficient ontology
development continues to be a challenge, since this
still requires a lot of experience and knowledge of
the underlying logical theory. Ontology Design Pat-
terns (ODP) are considered a promising contribution
to this challenge. In 2005, the term ontology design
pattern in its current interpretation was mentioned
by Gangemi (Gangemi, 2005) and introduced by
Blomqvist and Sandkuhl (Blomqvist and Sandkuhl,
2005). Blomqvist defines the term as ”a set of onto-
logical elements, structures or construction principles
that solve a clearly defined particular modeling prob-
lem” (Blomqvist, 2009). Ontology design patterns are
considered as encodings of best practices, which help
to reduce the need for extensive experience when de-
veloping ontologies, i.e. the well-defined solutions
encoded in the patterns can be exploited by less expe-
rienced engineers when creating ontologies. The area
of ODP research is closely related to reusable prob-
lem solving methods (Puppe, 2000) and knowledge
patterns (Thompson et al., 2000) (Section 2.1). Dif-
ferent types of ODP are under investigation, which
are discussed in (Gangemi and Presutti, 2009) regard-
ing their differences and the terminology used. The
two types of ODP probably receiving most attention
are logical and Content ODP. Logical ODP focus only
on the logical structure of the representation, i.e. this
pattern type is targeting aspects of language expres-
sivity, common problems and misconceptions. Con-
tent ODP are often instantiations of logical ODP of-
fering actual modeling solutions. Due to the fact that
these solutions contain actual classes, properties, and
axioms, Content ODP are considered by many re-
searchers as domain-dependent, even though the do-
main might be considering general issues like ’events’
or ’situations’. Platforms offering ODP currently in-
ApplicabilityofQualityMetricsforOntologiesonOntologyDesignPatterns
49

clude the ODP wiki portal initiated by the NeOn-
project and the logical ODPs maintained by the Uni-
versity of Manchester.
2.3 Quality Assurance of Ontologies
and ODP
Work in the area of quality assurance for ontologies
and ODP includes different perspectives, such as the
quality of the ontology or ODP as such, the quality of
the process of ontology construction, and tools sup-
porting the ontology engineer in achieving high qual-
ity. From the tool perspective, there are tools for the
identification of the origin of inconsistencies or unex-
pected entailments (Horridge et al., 2009) using rea-
soners. Such logical errors are clear-cut and easily
identifiable. However, content errors are often harder
to detect, and their consequences often show only in
the usage situation. A line of work attempting to de-
tect content errors has focused on rendering ontology
axioms by translating them into natural language. Ex-
amples are the GALEN project (Baud et al., 1997)
and the generation of natural language sentences by
Duque-Ramos et al. (Duque-Ramos et al., 2011)
which encompasses class definitions and entailments.
The quality assessment of the ontology construction
process has received less attention than the assess-
ment of tools and ontologies as such (Gorovoy and
Gavrilova, 2007). From a process perspective, there is
an approach of using workflow diagrams for formal-
izing the ontology construction process. The work-
flow support translating upper-level axioms and meta-
properties (Guarino and Welty, 2009) into decision
trees that interactively guide an incremental ontology
construction process (Seyed, 2012b)(Seyed, 2012a).
The quality assessment of ontologies as such has been
subject of many research activities (Vrande
ˇ
ci
´
c and
Sure, 2007), but the quality criteria vary considerably
between different approaches and often address struc-
tural, logical, and computational aspects of ontolo-
gies. Furthermore, metrics originating from software
quality evaluation have been investigated (Duque-
Ramos et al., 2011). Many of the metrics which have
been proposed during last years lack an empirical val-
idation in a large number of cases, i.e. what metrics
value can be considered as ”good” or as ”bad” often
has not been defined due to an insufficient number of
reported applications.
Besides approaches like (Maedche and Staab,
2002) that suggest a gold standard for reference, an
ontology content evaluation is poorly feasible for
tool support. Thus, we focus on structural metrics
and their validation. The work of Gangemi et al.
(Gangemi et al., 2005) has been chosen as a starting
point. Among others things, they suggest structural
and usability metrics that can be calculated automati-
cally. Additionally, a rough idea of ”bad” and ”good”
values is given.
3 METRICS CALCULATION
In order to evaluate and to compare the quality
of ontologies, formally defined metrics are an in-
strument of choice. They allow for automated or
semi-automated metrics calculation. Gangemi et al.
(Gangemi et al., 2005) define such metrics based on a
metaontology O
2
. It leads to three measure types for
ontology evaluation (Gangemi et al., 2005):
• Structural Measures: focusing on syntax and
formal semantics.
• Functional Measures: focusing on the rela-
tion between the ontology graph and its intended
meaning.
• Usability-profiling Measures: focusing on the
context in which an ontology is used.
The report by Gangemi et al. (Gangemi et al., 2005)
collects concrete metrics for all three types of mea-
sures together with their meaning, calculation rules,
and relationships. Functional measures require expert
knowledge in the ontology domain. The ODPs that
are used for our investigation may be understandable
based on common knowledge. But when it comes to
questions regarding the completeness and accuracy of
modeled concepts more than common knowledge is
necessary. Thus, we discuss structural and usability-
profiling measures only.
Structural Measures
Structurally seen, an ontology is a graph whose nodes
and arcs represent concepts. Structural measures
mainly refer to the syntax of the ontology graph.
Sometimes, formal (abstract) semantics is in focus.
However, formal semantics can also be considered as
additional syntax. Intended meaning, semantics and
context are not referred to by such measures.
Concrete metrics measure topological and logical
properties (Gangemi et al., 2005, p. 8). In general,
depth and breadth metrics count isa- or subclass-of
relationships respectively. Density metrics in contrast
count all other relationships. A common representa-
tion of a metric is given by:
M = hD, S, mp, ci
D identifies the dimension to be measured. Hence, it
is the graph property of interest. The set of graph el-
ements is represented by S. The measuring procedure
mp is the calculation rule for the respective metric.
KEOD2013-InternationalConferenceonKnowledgeEngineeringandOntologyDevelopment
50

The coefficient of measurement c allows adjustments
for different measurement contexts.
Measuring structural metrics is usually based on
counting. Thus, it relates natural number to a set of
graph elements (Gangemi et al., 2005, p. 10). In or-
der to make such measuring procedures applicable,
common element sets are defined and identified by
symbols
1
.
Gangemi et al. collected 31 structural metrics to-
gether with measuring procedures. Additionally, den-
sity and degree distribution are mentioned for com-
pleteness (Gangemi et al., 2005, pp. 17, 21 – 22).
The latter two do not seem to be applicable for ODP,
because as statistical metrics they rely on a large set
of elements which is in contradiction to the idea of
design patterns.
Usability-profiling Measures
The usability-profiling metrics aim at the ontology
profile. The ontology profile is a set of ontology an-
notations which contains metadata about the ontology
and its elements with regard to ontology use and de-
velopment. This includes structural, functional and
user-oriented information. Gangemi et al. distinguish
in (Gangemi et al., 2005, pp. 36) three analytical lev-
els of information:
Recognition Annotations describe objects, actions,
and options. The goal is a complete documen-
tation that guarantees effective access. Ontology
structure, function, and life cycle can be described
by annotations. We focus on life cycle annotations
which contain information about provenance, em-
ployed methods, versioning, and compatibility.
Efficiency Annotations support the cost-benefit-
calculation in the use of ontologies.
Interfacing Annotations describe the alignment of
an ontology to an user interface. If there is a
strong connection between ontology context and
ontology representation such annotations can be
helpful.
Possible metrics of usability-profiling are presence,
completeness, and reliability of all three kinds of an-
notations.
3.1 Selection of Content ODPs
The following ten Content ODPs from the ODP wiki
portal
2
that was initiated by the NeOn-project are
the base for our further discussion: (1) AgentRole,
(2) Classification, (3) Componency, (4) Constituency,
(5) Description, (6) GearWaterArea, (7) RoleTask,
1
see (Gangemi et al., 2005, p. 10) for reference
2
http://ontologydesignpatterns.org
Figure 1: Graphs of the ten chosen Content ODPs.
(8) SpeciesConditions, (9) Tagging, and (10) TimeIn-
dexedPersonRole.
The patterns have been chosen by applying a
pseudo random number generator. Intuitively, they
have different qualities and different applications.
The graphs provided by the OntoGraf-plugin of Pro-
tege
3
have been used for metrics calculation. Figure 1
shows the structure all ten patterns.
3.2 Structural Metrics
Out of the 31 structural metrics proposed by Gangemi
et al. 19 have been calculated for the selected Content
ODPs. The following table gives an overview of the
metrics and their applicability to Content ODPS.
The X marks the metrics that could be calculated
for the Content ODPs. Brackets indicate that there is
only limited applicability. We now discuss details and
issues of the metrics calculation.
Depth and breadth metrics are based on a directed
graph and only count isa-arcs (Gangemi et al., 2005,
p. 11). The first use the cardinality of the paths from
the root to the respective leafs. The latter use the
cardinality of the several hierarchy levels or genera-
tions as well. Already the calculation of these simple
metrics has to cope with unclear calculation proce-
dures. In general, OWL classes are specializations of
the Thing concept. Thus, Thing is the root node in
any ontology. According to (Gangemi et al., 2005,
p. 10), ROO ⊆ G is the set of all root nodes while
G is the node set of the graph. However, taking the
Thing concept into account, each graph has only one
root node. There are also representations of Content
3
http://protege.stanford.edu/
ApplicabilityofQualityMetricsforOntologiesonOntologyDesignPatterns
51

Table 1: Structural metrics from (Gangemi et al., 2005) and their applicability to ODPs.
Group Structural Metric Applicability
Depth Absolute depth (M1) X
Average depth (M2) X
Maximal depth (M3) X
Breadth Absolute breadth (M4) X
Average breadth (M5) X
Maximal breadth (M6) X
Tangledness Tangledness (M7) (X)
Fan-outness Absolute leaf cardinality (M8) X
Ratio of leaf fan-outness (M9) X
Weighted ratio of leaf fan-outness (M10) X
Maximal leaf fan-outness (M11) X
Sibling fan-outness Absolute sibling cardinality (M12) X
Ratio of sibling fan-outness (M13) X
Weighted ratio of sibling fan-outness (M14) X
Average sibling fan-outness (M15) X
Maximal sibling fan-outness (M16) X
Average sibling fan-outness without metric
space
(M17)
Average sibling fan-outness without lists of val-
ues
(M18)
Differentia specifica Ratio of sibling nodes with shared differentia
specifica
(M20)
Ratio of sibling sets with shared differentia
specifica
(M21)
Density
Modularity Modularity rate (M22)
Module overlapping rate (M23)
Logical adequacy Consistency ratio (M24)
Generic complexity (M25)
Anonymous classes ratio (M26)
Cycle ratio (M27) (X)
Inverse relations ratio (M28) X
Class/relation ratio (M29) X
Axiom/class ratio (M30)
Individual/class ratio (M31)
Meta-logical adequacy Meta-consistency ratio (M32)
Degree distribution
ODPs that do not contain this node
4
. In consequence,
different values may be calculated for the same ODP.
Calculation in Gangemi’s report is based on out-
going and incoming isa - arcs. These relationships
are shown as has-subclass - arcs in Protege. In con-
sequence, the arrows aim to the opposite direction –
incoming isa - arcs express the same as outgoing has-
subclass - arcs and vice versa.
For better comprehension, the term has-subclass -
arc is used for the remainder of this paper. The tan-
gledness metric(M7) now has an adapted formula:
m =
n
G
t
∈G∧∃a
1
,a
2
(has subclass(a
1
,m)∧has subclass(a
2
,m))
In contrast to the original, isa(m, a
1
) has been
replaced by has subclass(a
1
, m), and isa(m, a
2
) by
4
see http://ontologydesignpatterns.org
has subclass(a
2
, m). n
G
is the number of nodes
within the graph.
According to Gangemi et al. (Gangemi et al.,
2005, p. 12), the tangledness metric counts the multi-
hierarchical nodes of the graph. This term generally
points at the poly-hierarchy. Hence, it aims at con-
cepts that have more than one superclass. However,
the metrics description in Gangemi’s report refers to
nodes that have more than one incoming isa - arc or as
stated before, that have more than one outgoing has-
subclass - arc. This holds for all father nodes (in-
cluding the root-node) that have more than one child.
Since the formula is given correctly and it counts in-
coming has-subclass - arcs in the denominator, we as-
sume that there is just a mistake in Gangemi’s metric
description.
Another problem occurs if the node set defined for
KEOD2013-InternationalConferenceonKnowledgeEngineeringandOntologyDevelopment
52

Figure 2: Graph of Description ODP.
the denominator is empty. Hence, there is no node
with multiple incoming has-subclass - arcs within the
graph. The metric would have an undefined value.
Additionally, intuition expect higher values of tan-
gledness for more complex graphs. Thus, denomina-
tor and numerator should be switched. The following
formula is used:
m =
t
∈G∧∃a
1
,a
2
(has subclass(a
1
,m)∧has subclass(a
2
,m))
n
G
Due to the small number of concepts in ODPs and the
seldomness of poly-hierarchical nodes, tangledness is
applicable to ODPs conditionally only.
The metrics of fan-outness and sibling fan-outness
fit almost completely to ODPs. M17-M21 are excep-
tions. The two first of them aim at practices that are
substituted by different ones in OWL (Gangemi et al.,
2005, p. 16). The two
5
latter of them give useful re-
sults only for large ontologies.
No formula has been given for density. Thus, it is
not further investigated. Additionally, its description
suggests that this metric is only applicable to large
ontologies. The metrics M22-M26 do not seem to be
applicable as well. This is mainly due to the small
number of different concepts with ODPs.
The cycle ratio (M27) is calculated by division of
the absolute depth of cyclic paths and the absolute
depth (M1). Only three out of the ten ODPs con-
tained cycles. Therefore, this metric is considered to
be applicable conditionally only. The metrics of log-
ical adequacy include has-subclass - and conceptual
- arcs according to Gangemi et al. (Gangemi et al.,
2005, p. 18). Therefore, we counted a cycle if a start
at the Thing-node was possible with respect to the arc
direction and if also a path back to that concept ex-
isted
6
. For an example we refer to the Description
ODP which is shown in figure 2. There is only one cy-
cle, starting at Thing, via Description, over one of the
two existing arcs to Concept and back again to Thing.
5
M19 is not defined.
6
Paths are considered as sequences of connected nodes
starting at a root node.
The absolute depth of this cycle path is three. The ab-
solute depth of the graph is four. In consequence, the
cyclic ratio is 0.75. The inverse relations ratio (M28)
and the class/relations ratio (M29) had different val-
ues for different ODPs. Therefore they seem to be
applicable for the evaluation of ODPs.
Measurement of Axioms (M30) is only reasonable
if the number of axioms differs from the number of re-
lations. Hence, if there are additional rules within the
ontology. This is not the case for the selected ODPs.
Individuals (M31) could not be found as well. The
meta-consistency ratio (M32) includes functional as-
pects and is out of focus.
Table 2 shows the calculated values for all applica-
ble structural metrics and the selected Content ODPs.
Significant differences between the calculated values
can be seen, because of the diversity of the ODPs in
structure and size. If concepts are constructed simi-
larly there are small or simply no differences in the
values.
3.3 Usability-profiling Metrics
Out of the three types of annotations that have been
identified earlier, only recognition annotations can be
found in the ten selected ODPs. In consequence, they
are the only existing base for usability-profiling met-
rics. Gangemi et al. suggest presence, completeness,
and reliability for possible metrics. In our setting (cf.
section 4) it is difficult to assess completeness and re-
liability. Therefore, we are restricted to the number
of recognition annotations as usability-profiling met-
ric. Table 2 shows the results of this metric for the
ten selected ODP. In the first place, this metric pro-
vides only information about documentation quality
of the respective ODP. Usability for an human user
is addressed indirectly at the best. A comprehensive
documentation may be helpful, but this metric seems
to have shortcomings with respect to usability mea-
surement.
4 A SURVEY FOR METRICS
VALIDATION
While the selected metrics allow to describe the char-
acteristics of Content ODPs and to distinguish Con-
tent ODPs with respect to these characteristics, in or-
der to evaluate Content ODPs, desired characteristics
or an preferential order for metrics values has to be
determined. Gangemi et al. (Gangemi et al., 2005,
pp. 39) provide principles that may be important in
project context for ontology evaluation. Each princi-
ple is based on a set of metrics that have impact on the
ApplicabilityofQualityMetricsforOntologiesonOntologyDesignPatterns
53

Table 2: Functional and usability-profiling metric calculation for selected Content ODPs.
Metric
AgentRole
Classification
Componency
Constituency
Description
GearWaterArea
Role task
SpeciesConditions
Tagging
Time indexed person role
Absolute depth (M1) 6 2 2 1 4 8 4 11 24 19
Average depth (M2) 3 2 2 1 2 2 2 2,2 3,429 3,8
Maximal depth (M3) 3 2 2 1 2 2 2 3 4 5
Absolute breadth (M4) 5 2 2 1 3 5 3 7 15 12
Average breadth (M5) 1,67 1 1 1 1,5 2,5 1,5 2,34 3,75 2,4
Maximal breadth (M6) 2 1 1 1 2 4 2 5 5 4
Tangledness (M7) 0 0 0 0 0 0 0 0 0,07 0,08
Absolute leaf cardinality (M8) 2 1 1 1 2 4 2 5 6 4
Ratio of leaf fan-outness (M9) 0,4 0,5 0,5 1 0,34 0,8 0,67 0,71 0,4 0,34
Weighted ratio of leaf fan-outness (M10) 0,34 0,5 0,5 1 0,5 0,5 0,5 0,45 0,25 0,21
Maximal leaf fan-outness (M11) 2 1 1 1 2 4 2 4 4 1
Absolute sibling cardinality (M12) 5 2 2 1 3 5 3 7 14 12
Ratio of sibling fan-outness (M13) 1 1 1 1 1 1 1 1 0,93 1
Weight. ratio of sibling fan-outness (M14) 0,67 1 1 1 0,75 0,63 0,75 0,63 0,58 0,63
Average sibling fan-outness (M15) 0,83 1 1 1 1,5 2,5 1,5 2,34 1,75 1,5
Maximal sibling fan-outness (M16) 2 1 1 1 2 4 2 5 5 4
Cycle ratio (M27) 0 0 0 0 0,75 0 0 1,36 1,63 0
Inverse relations ratio (M28) 0 0,5 0,67 1 0,4 0,2 0,34 0,29 0,24 0
Class/relation ratio (M29) 1,25 1 0,67 1 0,6 1 1 0,5 0,6 0,92
Number of annotations 10 10 8 4 4 9 11 9 15 2
fulfillment of the respective principle. Furthermore,
the kind of impact is roughly expressed.
Gangemi et al. look into ontology use in general.
In our case, the intention behind the idea of ODPs is
the starting point. There is a strong focus on reuse
and adaptability. ODPs should present best practices
and should be accessible by a large number of non-
expert users. Thus, user centered aspects like clar-
ity and understandability are important. For example,
Gangemi’s principle of ”cognitive ergonomics” aims
in the same direction.
In order to investigate how the defined metrics cor-
relate with the fulfillment of desired principles, a sur-
vey has been done. In this survey users evaluated se-
lected Content ODPs with respect to
• Clarity: Recognition of all concepts, relation-
ships, and their correspondences
• Understandability: Comprehension of all con-
cepts, relationships, their correspondences, and
their meaning
• Adaptability to a given use case (The users got
the task to adapt the respective pattern prior to
evaluation)
• Reuseability: for example as a part of a larger
pattern
4.1 Setting
We had twelve participants within the survey. All of
them were students in the MSc ”Business Informa-
tions Systems”-program. The participants were fa-
miliar with the purpose, the syntax, and semantics of
ontologies and ontology graphs respectively. How-
ever, the concept of ODPs had been introduced to
them briefly in conjunction with the survey.
The evaluation of the four criteria (Clarity, Under-
standability, Adaptability, and Reusability) based on
an ordinal scale containing the values 1 (very good),
2 (good), 3 (satisfactory), 4 (fair), and 5 (unsatisfac-
tory).
In order to have a certain proof that different met-
ric values correlate with differences in user rating,
the participants have been divided into two groups.
The test group has been interviewed about ODPs that
show different metric values. The average variation
coefficient of the applicable metrics for the selected
ODPs is 0.65.
The control group has been interviewed about
ODPs that show minor differences in metric values.
Here the average variation coefficient is 0.22 here.
The concrete selections are:
KEOD2013-InternationalConferenceonKnowledgeEngineeringandOntologyDevelopment
54
Test Group: Componency, SpeciesCondition,
TimeIndexedPersonRole
Control Group: Componency, RoleTask, Classifi-
cation
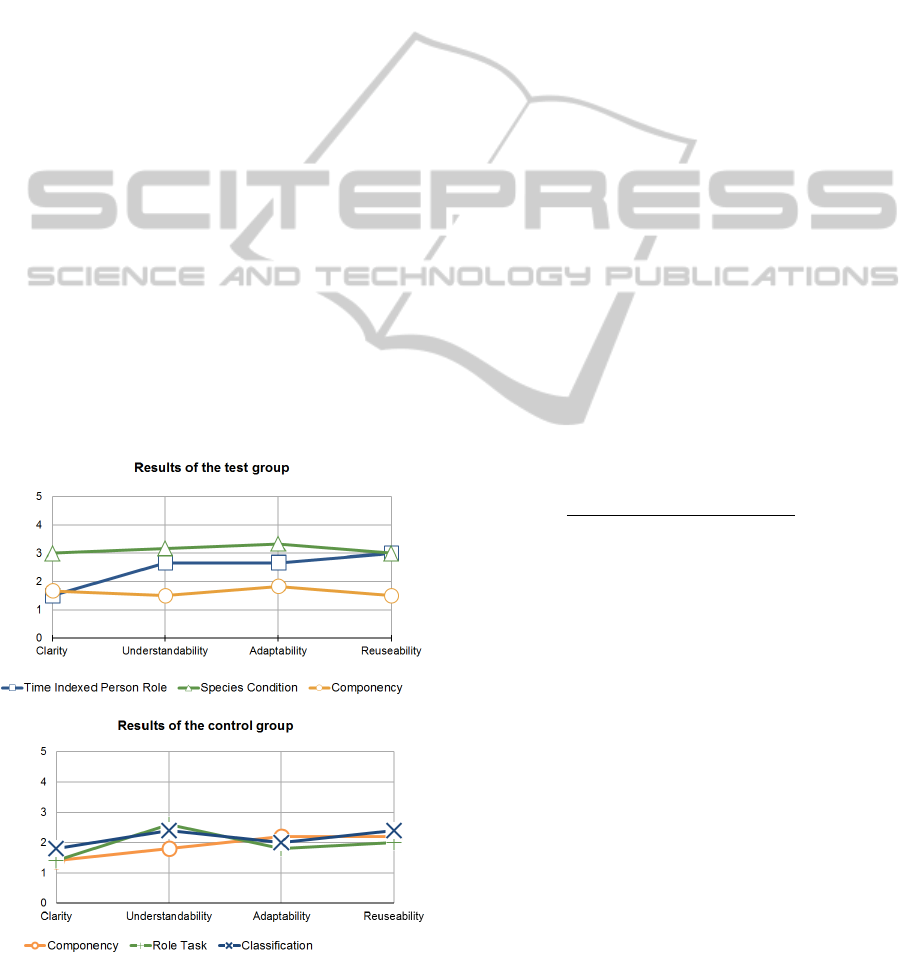
4.2 Results
Figure 3 shows the results for both interviewed
groups. For the test group it is evident that the small-
est ODP ”Componency” has good evaluation results
in all four criteria. ”Time Indexed Person Role” got
also good results in clarity. However the three other
criteria have much worse values. ”Species Condition”
got bad values for all criteria compared to the other
patterns.
Looking into metrics calculation, some correla-
tion reveals. For example, the ”small” pattern ”Com-
ponency” generally shows smaller metric values in
comparison to the other two patterns. Since it got
the best marks in user evaluation this makes evidence
that small metric values correlate positively with all
four criteria. Gangemi et al. formulated a similar cor-
relation for the principle of ”cognitive ergonomics”,
namely for depth, breadth and tangledness metrics
(Gangemi et al., 2005, p. 40).
However, this correlation cannot be seen inde-
pendently from other metrics. The ”Time Indexed
Person Role” pattern shows the worst metrics in
Figure 3: user evaluation of selected ODPs. Scale: 1 (very
good), 2 (good), 3 (satisfactory), 4 (fair), and 5 (unsatisfac-
tory)
terms of depth and breadth, but it’s clarity has
been evaluated significally better by the users than
the clarity of ”Species Condition”. This is due to
the higher complexity and number of relationships
within the ”Species Condition” pattern. The lowest
class/relations ratio shows this circumstance in terms
of metrics. This also supports the correlations for
”cognitive ergonomics” suggested by Gangemi et al.
They refer to class/property ratio which seems to be
synonymous with the class/relation ratio. In general,
it seems that the number of relations per concept lim-
its the influence of breadth, width, or simply the num-
ber of concepts on user rating.
In order to identify candidate metrics for auto-
mated ontology evaluation with respect to the four
formulated principles, we’ve calculated correlation
coefficients r for each metric and the average user rat-
ings per principle. Based on the setting (n = 3 evalu-
ated patterns in the test group) and an error probability
of α = 10%, there is a threshold of |r| ≥ 0.9511 using
a one side test against the hypothesis of no existing
correlation H
0
: ρ = 0.
Table 3: Significant correlations (+ positive / - negative) of
quality metrics and average user rating.
Metric
Clarity
Understandability
Adaptability
Reuseability
M5 +
M6 + + +
M8 + + +
M11 +
M14 - -
M15 +
M16 + + +
M27 +
Table 3 shows the significant correlations accord-
ing to the proposed correlation test. Interestingly,
there are metrics (M11, M27) that show correlation
with clarity only while other metrics (M6, M8, M16)
correlate with all of the other principles. The previ-
ously discussed class/relation ratio lies with a corre-
lation coefficient of -0.86 below the chosen threshold.
The control group gave quite similar ratings for
the patterns with similar metric values (see figure 3).
This additionally supports the hypothesis that user
evaluation results correlate with the metric values.
Further evidence is given by the average variation co-
efficients of the average user ratings. It is 0.35 for the
test group and only 0.13 for the control group.
ApplicabilityofQualityMetricsforOntologiesonOntologyDesignPatterns
55

4.3 Limitations
Generally, the number of evaluated patterns and the
number of participants should be increased in order
to increase the significance level.
Additionally, an outlier had to be removed from
the results. The ratings of the respective person dif-
fered very much from all other ratings. We assume
that this participant misinterpreted the rating scale or
that there was a lack of motivation which resulted in
less accuracy. However, this outlier was in the con-
trol group and thus our interpretation of the metrics
correlation has not been influenced.
The selection of patterns for the survey may also
be seen critically. We selected the patterns based on
our assumption which of them are accessible and un-
derstandable by participants who aren’t domain users.
Additionally, the sequence of patterns in the evalua-
tion process has not been randomized. However, there
was no evidence of a learning effect during the evalua-
tion of patterns. The componency pattern for example
was evaluated in both groups. At first position in the
test group and at second position in the control group.
It showed better evaluations in the test group. Con-
sidering learning effects, one would intuitively expect
the opposite.
5 CONCLUSIONS AND FURTHER
WORK
The goal of this work was to investigate the possi-
bility to apply ontology quality metrics on Content
ODPs and to validate such metrics. Table 3 as a re-
sult shows metrics that can be calculated for Contend
ODPs and that have a significant correlation with en-
gineering principles. Additionally, we found some
ambiguities in metric calculation procedures that need
to be considered in order to make metric based quality
statements comparable.
For future work, the points listed in section 4.3
need to be addressed. Furthermore, it seems to be
worthwhile to investigate correlations between met-
rics and user ratings in more detail. The validation
of additional metrics may be worthwhile too. A tool
support for the selected metrics seems to be desirable
for both, practice and further research.
REFERENCES
Baud, R., Rodrigues, J.-M., Wagner, J., Rassinoux, A.-M.,
Lovis, C., Rush, P., and Trombert-Paviot, B. (1997).
Validation of concept representation using natural lan-
guage generation. AMIA Annu Fall Symp, (841).
Blomqvist, E. (2009). Semi-automatic Ontology Construc-
tion based on Patterns. PhD thesis, Link
¨
oping Uni-
versity, Link
¨
oping.
Blomqvist, E. and Sandkuhl, K. (2005). Patterns in ontol-
ogy engineering – classification of ontology patterns.
In Proc. 7th International Conference on Enterprise
Information Systems, Miami.
Duque-Ramos, A., Fernandez-Breis, J., Stevens, R., and
Aussenac-Gilles, N. (2011). Oquare: A square-
based approach for evaluating the quality of ontolo-
gies. Journal of Research and Practice in Information
Technology, 43(159).
Gangemi, A. (2005). Ontology design patterns for seman-
tic web content. In The Semantic Web ISWC 2005,
volume 3729 of Lecture Notes in Computer Science.
Springer.
Gangemi, A., Catenacci, C., Ciaramita, M., and Lehmann,
J. (2005). Ontology evaluation and validation: an
integrated formal model for the quality diagnostic
task. Technical report, Laboratory of Applied On-
tologies – CNR, Rome, Italy. http://www.loa-cnr.it/
Files/OntoEval4OntoDev Final.pdf.
Gangemi, A. and Presutti, V. (2009). Ontology design pat-
terns. In Staab, S. and Studer, D., editors, Handbook
on Ontologies, International Handbooks on Informa-
tion Systems. Springer, Berlin Heidelberg.
Gorovoy, V. and Gavrilova, T. (2007). Technology for
ontological engineering lifecycle support. Interna-
tional Journal “Information Theories & Applica-
tions”, 14(19).
Gruber, T. (1993). A translation approach to portable on-
tology specifications. Knowledge Acquisition, 5:199–
220.
Guarino, N. and Welty, C. (2009). An overview of onto-
clean. In Staab, S. and Studer, D., editors, Handbook
on Ontologies, International Handbooks on Informa-
tion Systems, pages 201–220. Springer, Berlin Hei-
delberg.
Horridge, M., Parsia, B., and Sattler, U. (2009). xplain-
ing inconsistencies in owl ontologies. In Godo, L.
and Pugliese, A., editors, Scalable Uncertainty Man-
agement, Lecture Notes in Computer Science, pages
124–137. Springer, Berlin Heidelberg.
Maedche, A. and Staab, S. (2002). Measuring similarity be-
tween ontologies. In G
´
omez-P
´
erez, A. and Benjamins,
V., editors, Knowledge Engineering and Knowledge
Management, pages 251–263. Springer, Berlin Hei-
delberg.
Puppe, F. (2000). Knowledge formalization patterns. In
Proceedings of PKAW 2000. Sydney.
Seyed, A. (2012a). Integrating ontoclean’s notion of unity
and identity with a theory of classes and types - to-
wards a method for evaluating ontologies. In Donelly,
M. and Guizzardi, G., editors, Formal Ontology in In-
formation Systems - Proceedings of the Seventh Inter-
national Conference (FOIS 2012), Graz. IOS Press.
Seyed, A. (2012b). A method for evaluating ontologies -
introducing the bfo-rigidity decision tree wizard. In
KEOD2013-InternationalConferenceonKnowledgeEngineeringandOntologyDevelopment
56

Donelly, M. and Guizzardi, G., editors, Formal On-
tology in Information Systems - Proceedings of the
Seventh International Conference (FOIS 2012), Graz.
IOS Press.
Staab, S., Erdmann, M., and Maedche, A. (2001). Engineer-
ing ontologies using semantic patterns. In O’Leary, D.
and Preece, A., editors, Proceedings of the IJCAI-01
Workshop on E-business & The Intelligent Web. Seat-
tle.
Thompson, J., Clark, P., and Porter, B. (2000). Knowledge
patterns. In Cohn, A., Giunchiglia, J., and Selman, B.,
editors, KR2000: Principles of Knowledge Represen-
tation and Reasoning. Morgan Kaufman, San Fran-
cisco.
Vrande
ˇ
ci
´
c, D. and Sure, Y. (2007). How to design better on-
tology metrics. In Franconi, E., Kifer, M., and May,
W., editors, The Semantic Web: Research and Appli-
cations, pages 311–325. Springer, Berlin Heidelberg.
ApplicabilityofQualityMetricsforOntologiesonOntologyDesignPatterns
57
