
Selection of Sensors that Influence Trouble Condition Sign Discovery
based on a One-class Support Kernel Machine for Hydroelectric
Power Plants
Hiroshi Murata, Yasushi Shinohara and Takashi Onoda
System Engineering Research Laboratory, Central Research Institute of Electric Power Industry, Tokyo, Japan
Keywords:
Outlier Detection, Feature Selection, Support Kernel Machine, Hydroelectric Power Plant, Sensor.
Abstract:
Trouble conditions rarely occur in the equipment of hydroelectric power plants. Therefore, it is important to
find indicator signs for trouble conditions. In a previous study, we proposed a trouble condition sign discovery
method, which consists of two detection stages. In the first stage, we can discover trouble condition signs,
which are different from the usual condition data. In the second stage, we can monitor aging degradation, with
plant experts confirm these trouble condition signs in daily operations. Hence, there is a need to detect these
trouble condition signs using a small number of sensors. In this paper, we propose a method for narrowing
down the sensors used in trouble condition sign discovery. This paper shows the experimental results of
trouble condition sign detection for bearing vibration based on the collected data from different sensors using
our proposed method and our previously proposed method. The experimental results show that even if the
number of sensors is reduced, our proposed method can find trouble condition signs, which are different from
the usual condition data. Therefore, the proposed method may be useful for trouble condition sign discovery
in hydroelectric power plants.
1 INTRODUCTION
In order to realize efficient maintenance and re-
duce its cost, electric power companies recently be-
gan attempting to shift from a time-based mainte-
nance (TBM) to condition-based maintenance (CBM)
for electric equipment management (Yamana et al.,
2005), (Jardine et al., 2006). With TBM, equipment
is checked and changed based on the manufacturer’s
guarantee period. In contrast, with CBM, equipment
is checked, repaired and changed based on the state of
the equipment. This state consists of the actual condi-
tion of the equipment, its operation period, the opera-
tional load, etc.
It is important for electric power companies to col-
lect equipment data to realize CBM. In particular, it
is necessary to collect and analyze the previous trou-
ble condition data to discover trouble condition signs
for the power equipment. For instance, this might
include the discovery of trouble condition signs for
bearing vibration from the sensor information of the
hydroelectric power plant and the discovery of trouble
condition signs from the operation data of the power
generation plant. Trouble conditions rarely occur in
power equipment in Japan. Moreover, it is difficult to
construct an experimental power generation plant to
collect trouble condition data.
Thus, Kyushu Electric Power Co.,Inc. and Central
Research Institute of Power Industry are investigating
a detection method for the trouble condition signs of
bearing vibration in hydroelectric power plants. In
our research, we consider that the trouble condition
signs can be given by an increase in the occurrence of
special unusual condition data, because we can only
measure the normal condition data during the regular
operation of a hydroelectric power plant.
Thus, we are developing a detection method for
the occurrence of unusual condition data in the regu-
lar condition data, along with a management method
for trends in the generation of special unusual condi-
tion data related to bearing vibration from the regular
condition data for a hydroelectric power plant (Onoda
et al., 2009). This method consists of two detection
stages. In the first stage, we can discover trouble con-
dition signs, which are different from the usual condi-
tion data. In the second stage, we can monitor aging
degradation. Our proposed method is based on a one-
class support vector machine (one-class SVM) and a
normal support vector machine (SVM).
In the first stage, the detection method determines
466
Murata H., Shinohara Y. and Onoda T..
Selection of Sensors that Influence Trouble Condition Sign Discovery based on a One-class Support Kernel Machine for Hydroelectric Power Plants.
DOI: 10.5220/0004542704660473
In Proceedings of the 5th International Joint Conference on Computational Intelligence (NCTA-2013), pages 466-473
ISBN: 978-989-8565-77-8
Copyright
c
2013 SCITEPRESS (Science and Technology Publications, Lda.)
the relevance between the degree of an unusual con-
dition and various pieces of sensor information using
the weights of the one-class SVM. However, it is dif-
ficult for plant experts to evaluate whether or not sen-
sors that have weights close to zero affect an unusual
condition. If our detection method is introduced in
an actual plant, plant experts will have to confirm the
trouble condition signs in daily operations. Hence,
there is a need to be able to confirm the trouble con-
dition signs using a small number of sensors.
In this paper, we propose a method for narrowing
down the sensors that influence an unusual condition.
This method is based on the one-class support kernel
machine (one-class SKM).
In Section 2 of this paper, we briefly explain our
proposed method for discovering a trouble condition
sign. We briefly describe the previously proposed
method to detect unusual condition data, and we pro-
pose a new method for the selecting sensors that influ-
ence an unusual condition. The experimental results
are shown in Section 3. Finally, we present conclu-
sions in Section 4.
2 PROPOSED METHOD
In this section, we give an outline of the trouble condi-
tion sign discovery method using the special unusual
condition data. In addition, we explain the previously
proposed method for detecting an unusual condition
pattern. Finally, we propose a new method for com-
bining the unusual condition pattern detection and the
sensor reduction.
2.1 Trouble Condition Sign Discovery
Approach
Generally, the discovery of a trouble condition
sign relies on the detection of a peculiar case that
appears only before an existing trouble condition
by comparing the regular condition data and trouble
condition data. However, it is a fact that the trouble
condition data for electric power equipment are
limited, because electric power plants are designed
with the high safety factors and are appropriately
maintained. Currently, our bearing vibration data for
hydroelectric power plants also do not include trouble
condition data. Therefore, it is impossible to discover
a peculiar case before the occurrence of trouble
condition data, because it is difficult to obtain trouble
condition data, and it is impossible to compare
regular condition data with trouble condition data.
Thus, we believe that the relation between a peculiar
condition before the occurrence of trouble condition
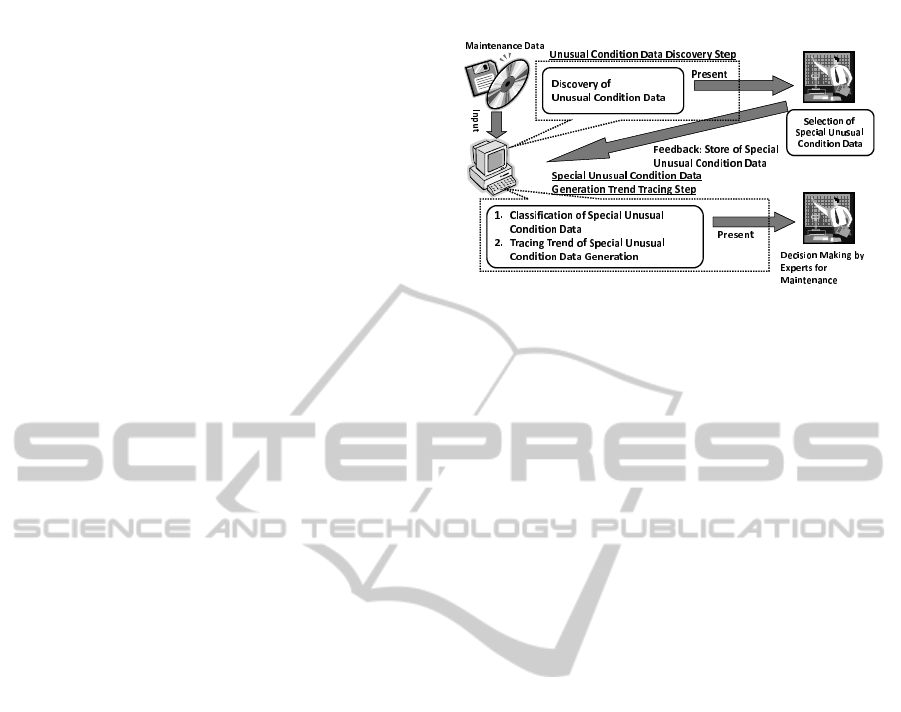
Figure 1: Image of Trouble Condition Sign Discovery.
data (hereafter, we call this the trouble condition
sign) and special unusual condition data is as follows.
The trouble condition sign ≈
A strong rise in the occurrence
of special unusual condition data.
It is possible to change the discovery of the
trouble condition sign to the detection of the special
unusual condition data in the regular condition data.
In other words, we suppose that the special unusual
condition data with a low probability of existing in
the regular condition data has a high probability of
being a trouble condition sign.
For the condition-based maintenance of hydro-
electric power plants, it is very important to discover
trouble condition signs. Our proposed trouble con-
dition data discovery method integrates the detec-
tion method for special unusual condition data and
a method of tracing the trends for the generation of
special unusual condition data.
Figure 1 shows an image of the trouble condition
sign discovery for the condition based maintenance
of hydroelectric power plants. Our proposed trou-
ble condition sign discovery method is an interactive
method. Our system mainly consists of two methods.
The first method is a selection method for the
special unusual condition data, which relate to the
trouble condition sign. This method consists of two
phases. The first phase is an unusual condition pat-
tern detection phase based on the one-class SVM or
one-class SKM. The next phase is the special unusual
condition data selection. The detected unusual con-
dition data may include unusual condition data gener-
ated by sensor faults and so on.
In our method, human experts detect strange data
such as the data generated by sensor faults using their
expertise, operation reports, etc., and then select the
data related to a trouble condition sign in the unusual
condition data. This selected unusual condition data
are defined as the special unusual condition data.
SelectionofSensorsthatInfluenceTroubleConditionSignDiscoverybasedonaOne-classSupportKernelMachinefor
HydroelectricPowerPlants
467

Figure 2: Image of Unusual Condition Data Detection.
The other method is the generation trend tracing
method based on a normal SVM. The unusual con-
dition data detection method detects some rare case
data in the regular condition data and displays these
patterns to experts. From the displayed patterns, the
experts select some data that may indicate a trouble
condition sign and teach them to the computer.
After this, the computer has the regular condition
data and the selected unusual condition data. Now, the
computer can generate an optimal hyperplane, which
can classify the two classes, by using an SVM. The
hyperplane classifies unseen data and finds some data
that are similar to the selected unusual condition data.
Therefore, the computer can trace the trend for the
generation of special unusual condition data.
2.2 Unusual Condition Pattern
Detection
Figure 2 shows the concept for the detection of un-
usual condition data in the regular condition data. In
this figure, the gray area denotes the regular condition
data area. In this research, the unusual condition data
are detected from this regular condition data. From
Figure 2, if we can find a hyper-sphere, that can cover
99% of the regular condition data, we can consider
the other 1% to be unusual condition data. This 99%
of the regular condition data are called “usual condi-
tion data.” In Figure 2, the inside of a circle shown
by a solid black line is the usual condition data area,
and the black stars denote the unusual condition data.
Therefore, if we can correctly find the boundary for
an area of α% in the regular condition area, it is pos-
sible to detect the unusual condition data that do not
belong to this α% area of the regular condition data.
We adopt a one-class SVM or one-class SKM to cor-
rectly find this boundary.
2.3 One-class Support Vector Machine
Sch
¨
olkopf et al. suggested a method of adapting the
SVM methodology to a one-class classification prob-
lem (Sch
¨
olkopf et al., 2000). Essentially, after trans-
forming the feature via a kernel, they treat the origin
as the only member of the second class. By using “re-
laxation parameters,” they separate the image of the
one class from the origin. Then, the standard two-
class SVM techniques are employed.
One-class SVM (Sch
¨
olkopf et al., 2000) returns
a function f that takes the value −1 in a “small” re-
gion, capturing most of the training data points, and
+1 elsewhere.
Let the training data be x
1
, . . . , x
N
, belongs to one
class X, where X is a compact subset of R
N
, and N
is the number of observations. Let Φ : X → H be a
kernel map that transforms the training examples into
a feature space. The dot product in the image of Φ
can be computed by evaluating some simple kernels,
k(x, y) = (Φ(x) · Φ(y)). (1)
Then, in order to separate the data set from the
origin, one needs to solve the following quadratic pro-
gram:
min
w,ξ,ρ
1
2
∥w∥
2
− νNρ +
∑
N
ξ
i
subject to (w · Φ(x
i
)) ≥ ρ − ξ
i
,
ξ
i
≥ 0.
(2)
Using multipliers α
i
, β
i
≥ 0, we introduce a La-
grangian
L(w, ξ, ρ, α, β) =
1
2
∥w∥
2
− νNρ +
∑
i
ξ
i
−
∑
i
α
i
((w · Φ(x
i
)) − ρ + ξ
i
) −
∑
i
β
i
ξ
i
(3)
and set the derivatives with respect to the primal
variables w, ξ
i
, ρ equal to zero, yielding
w =
∑
i
α
i
Φ(x
i
), (4)
α
i
= 1 − β
i
≤ 1,
∑
i
α
i
= νN. (5)
Substituting Eqs. (4) and (5) into Eq. (3), we obtain
the dual problem:
min
α
1
2
∑
i, j
α
i
α
j
Φ(x
i
) · Φ(x
j
) (6)
= min
α
1
2
∑
i, j
α
i
α
j
k(x
i
, x
j
) (7)
subject to 0 ≤ α
i
≤ 1,
∑
i
α
i
= νN . (8)
All patterns {x
i
: α
i
> 0, i = 1. . . N} are called support
vectors. These patterns correspond to the hyperplane.
From Eq. (8), ν ∈ (0, 1) is an upper bound on the
IJCCI2013-InternationalJointConferenceonComputationalIntelligence
468

fraction of outliers, and a lower bound on the fraction
of support vectors. The decision function
f (x) = sgn((w · Φ(x)) − ρ) (9)
will be positive for most examples of x
i
contained in
the training set, while the fraction of support vectors
will still be small. The actual trade-off between these
two is controlled by ν. For a new point x, the value
of f (x) is determined by evaluating which side of the
hyperplane it falls on. One can show that at the op-
timum, the two inequality constraints of Eq. (2) be-
come equalities if 0 < α
i
< 1. Therefore, we can re-
cover ρ by exploiting the fact that, for any such α
i
,
the corresponding pattern x
i
satisfies
ρ = w · Φ(x
i
) =
∑
j
α
j
k(x
j
, x
i
) (10)
2.4 One-Class Support Kernel Machine
One-class SKM was developed based on support ker-
nel machine (SKM) (Bach et al., 2004). SKM is a
kind of the multiple kernel learning problem defined
by Lanckriet et al. (Lanckriet et al., 2004). SKM is
able to combine feature selection and optimization.
Eq. (6) is transformed into
min
α
∑
j
(
∑
i
α
i
Φ(x
i, j
))
2
. (11)
This square sum is transposed to maximize the square
min
α
max
j
(
∑
i
α
i
Φ(x
i, j
))
2
, (12)
and transposed to maximize the absolute value
min
α
max
j
|
∑
i
α
i
Φ(x
i, j
)|. (13)
Eq. (13) is transformed into
min
α
w
0
subject to |w
j
| = |
∑
i
α
i
Φ(x
i, j
)| ≤ w
0
0 ≤ α
i
≤ 1,
∑
i
α
i
= νN.
(14)
Eq. (14) is a linear programming problem and leads
to a sparse w with good generalization properties.
Therefore, this equation can be solved quickly and it
selects efficient features. Here, the decision function
of the one-class SKM is the same as Eq. (9).
3 EXPERIMENT
In this section, we describe our experiment. In par-
ticular, we briefly introduce the measurement data,
our experimental setup, experimental results, and the
evaluation.
Table 1: Outline of Ooyodo River First Hydroelectric Power
Plant.
Generated Output 13,500kW
Working Water 42m
3
/s
Effective Head 38.40m
Turbine Type Vertical Shaft Francis Turbine
Rated Revolutions 200rpm
Per Minute
Upper Oil Self Contained Type Segment
Bearing Bearing (Oil Feeding)
Bearing Bottom Oil Self Contained Type Cylindrical
Bearing Bearing (Natural Cooling)
Type Turbine Oil Self Contained Type Segment
Bearing Bearing (Natural Cooling)
Thrust Oil Self Contained Type Michell
Bearing Bearing (Natural Cooling)
3.1 Measurement Data
Table 1 shows the outline of the Ooyodo River First
hydroelectric power plant. This hydroelectric power
plant has various sensors to measure data related to
bearing vibration. The measured operation data were
collected from the hydroelectric power plant and an-
alyzed using our proposed method. The measured
operation data related to bearing vibration were col-
lected from June 14, 2006, to January 31, 2008, at the
Ooyodo River First hydroelectric power plant.
One data set was composed of the sensor and
weather information from 38 measurement items for
a measurement interval of 5 s. All of the measurement
data were regular condition data and did not include
the trouble condition data.
3.2 Experimental Setup
Our experiment analyzed the measurement data,
which were explained in 3.1. The measurement data
were composed of 38 measurement items. However,
in order to detect the unusual condition data for bear-
ing vibration, we extracted the measurement items re-
lated to the bearing vibration from all of the measure-
ment items. Therefore, 16 measurement items were
selected based on the bearing vibration knowledge of
the experts to analyze the unusual condition data. Ta-
ble 2 shows these selected 14 measurement items.
The power generator operation consists of the
starting condition, parallel condition, parallel off
condition and stopping condition. The number
of starting condition data points and parallel off
condition data points was relatively very small in our
dataset. The number of parallel operation condition
data points was very large. If we analyzed all of the
measurement data to detect the unusual condition
data, the detected condition data consisted of the
SelectionofSensorsthatInfluenceTroubleConditionSignDiscoverybasedonaOne-classSupportKernelMachinefor
HydroelectricPowerPlants
469

Table 2: Measurement Items.
A. Generated Output (MW) B. Revolutions Per Minute
C. Upper Bearing Oil Temp. − D. Turbine Bearing Oil
Oil Cooler Inlet Air Temp. (
◦
C) Temp. (
◦
C)
E. Thrust Bearing Temp. (
◦
C) F. Bottom Oil Tank Oil
Temp. (
◦
C)
G. Bottom Bearing Inlet Air H. Turbine Shaft Vibration
Temp. (
◦
C) (X axis) (µm)
I. Upper Bearing Vibration J. Upper Bearing Vibration
(Perpendicular) (µm) (Horizon) (µm)
K. Bottom Bearing Vibration L. Bottom Bearing Vibration
(Perpendicular) (µm) (Horizon) (µm)
M. Wheel Cover Vibration N. Wheel Cover Vibration
(Perpendicular) (µm) (Horizon) (µm)
Table 3: Number of Data Points for Each Condition.
Group The number of data points
Stopping condition 2,430,295
Starting condition 6,629
Parallel operation condition 4,346,259
Parallel off condition 672
Total 2,804,113
starting condition data or the parallel off condition
data, which were different from the parallel operation
condition data. This was not a good situation for our
analysis. Therefore, all of the measurement data were
divided into the following four groups based on the
expertise of the experts.
Starting condition:
Generator Voltage (V-W) < 10kV, Guide Vane
Opening ≥ 10% and Revolutions per Minute ≥ 200
rpm.
Parallel operation condition:
Generator Voltage (V-W) ≥ 10kV and
Revolutions per Minute ≥ 200 rpm.
Parallel off condition:
Generator Voltage (V-W) < 10kV, Guide Vane
Opening < 10% and Revolutions per Minute ≥ 200
rpm.
Stopping condition:
Otherwise.
These groups were defined by the experts. Ta-
ble 3 shows the number of data points in each
group.
In the stopping condition group, the bearing does
not rotate. Moreover, only one or less than one paral-
lel off condition data point was found for each actual
parallel off condition. Therefore, these data groups
were omitted from the analyzed data. In other words,
the unusual condition data were detected in the other
group, which were the starting condition and paral-
lel operation condition. We use a linear kernel in our
experiments because it is impossible to tune the ker-
nel parameters using only the regular condition data.
In order to ignore the different measurement units
and define the unsafe condition, the measurement
data were normalized using the following equation for
each measurement item for the one-class SVM.
value = −
actual value − min. value
max. value − min. value
+ 1
For the hydroelectric power plant, a high value for
any sensor denotes an unsafe condition. Therefore,
our method adopted the normalization.
The one-class SKM is equivalent to a one-class
SVM that applies optimized scaling. Therefore, the
measurement data were normalized to maintain the
variances of the features, and the origin became the
high value of each sensor. Additionally, the measure-
ment data points were multiplied by −1.
3.3 Unusual Condition Discovery
Experiment
The unusual condition data were discovered in the
starting condition data and the parallel condition data
by applying the one-class SVM or one-class SKM.
This experiment used the operation data measured
from June 14, 2006, to May 31, 2007, to find the
special unusual condition data. The discovered un-
usual condition data were determined to be special
unusual condition data based on the knowledge of hu-
man experts. In the starting condition, 0.1% of the
starting operation condition data was determined to
be unusual condition data. In the parallel condition,
0.002% of the parallel operation condition data was
determined to be unusual condition data. Tables 4
and 5 show the detected unusual condition data from
the starting operation condition data from the Ooyodo
River First hydroelectric power plant. The unusual
condition data that were detected by our system were
presented to experts to identify special unusual con-
dition data. These human experts pointed out a spe-
cial feature of the detected data. This feature was that
unusual values were detected in data point no. 15 of
Table 4 and data point no. 10 of Table 5. The human
experts checked the daily operation report for this day
and found the following fact. Oil leakage at bearing
was found and repaired on this day. This was a very
rare case and showed a trouble condition sign.
3.4 Discussion
Figures 3 and 4 show the monthly distributions of un-
usual condition data. From these figures, the results
IJCCI2013-InternationalJointConferenceonComputationalIntelligence
470

Table 4: Detected Unusual Condition from Starting Operation Condition using One-class SVM.
Data Point No. 1(1) 2 3 4 5(2) 6(3) 7 8 9(6)
Revolutions Per Minute 197.0 198.8 199.7 196.6 199.8 200.2 199.0 196.1 198.7
Upper Bearing Oil Temp. −
Oil Cooler Inlet Air Temp. (
◦
C) 13.8 10.8 12.4 12.0 12.7 13.4 11.3 12.6 13.4
Turbine Bearing Oil Temp. (
◦
C) 52.4 46.0 48.5 49.8 49.8 50.1 46.6 50.4 47.9
Thrust Bearing Temp. (
◦
C) 50.2 45.0 50.2 49.1 50.1 51.5 49.1 49.9 .48.6
Bottom Oil Tank Oil Temp. (
◦
C) 43.9 40.8 45.8 45.8 45.8 45.9 45.2 46.0 43.3
Bottom Bearing Inlet Air Temp. (
◦
C) 29.8 29.1 31.0 30.6 30.1 29.8 30.8 31.2 27.6
Turbine Shaft Vibration (X axis) (µm) 190 146 139 140 152 155 145 156 139
Upper Bearing Vibration (Perpendicular) (µm) 6 20 8 13 11 9 9 13 16
Upper Bearing Vibration (Horizon) (µm) 19 21 20 18 20 21 20 19 20
Bottom Bearing Vibration (Perpendicular) (µm) 12 14 13 12 13 13 13 12 14
Bottom Bearing Vibration (Horizon) (µm) 1 1 13 12 1 14 14 1 2
Wheel Cover Vibration (Perpendicular) (µm) 2 2 3 6 2 2 2 29 2
Wheel Cover Vibration (Horizon) (µm) 28 23 0 0 28 0 0 0 24
Data Point No. 10 11(7) 12 13 14(8) 15(10) 16 17 18
Revolutions Per Minute 196.3 197.0 202.5 198.2 198.5 198.8 195.6 196.3 196.2
Upper Bearing Oil Temp. −
Oil Cooler Inlet Air Temp. (
◦
C) 13.9 13.8 14.0 14.6 14.7 21.9 22.2 22.4 22.4
Turbine Bearing Oil Temp. (
◦
C) 48.8 48.5 48.6 48.8 38.5 40.0 42.4 43.5 43.8
Thrust Bearing Temp. (
◦
C) 48.0 48.8 46.0 47.2 41.0 41.3 50.0 49.8 49.8
Bottom Oil Tank Oil Temp. (
◦
C) 44.4 44.4 43.0 43.1 36.5 34.0 35.3 36.2 36.3
Bottom Bearing Inlet Air Temp. (
◦
C) 27.8 27.5 27.0 26.5 21.1 13.9 16.2 16.1 16.0
Turbine Shaft Vibration (X axis) (µm) 162 155 133 140 130 126 251 280 278
Upper Bearing Vibration (Perpendicular) (µm) 15 22 3 21 27 22 32 28 29
Upper Bearing Vibration (Horizon) (µm) 18 18 18 19 16 15 21 20 19
Bottom Bearing Vibration (Perpendicular) (µm) 12 13 12 14 15 16 13 13 13
Bottom Bearing Vibration (Horizon) (µm) 2 2 1 2 1 8 1 1 1
Wheel Cover Vibration (Perpendicular) (µm) 2 2 25 2 22 4 2 2 2
Wheel Cover Vibration (Horizon) (µm) 24 26 1 20 0 0 2 2 2
Note: The data point numbers from Table 5 are shown in parentheses.
Table 5: Detected Unusual Condition from Starting Operation Condition using One-class SKM.
Data Point No. 1(1) 2(5) 3(6) 4 5 6(9) 7(11) 8(14) 9
Revolutions Per Minute 197.0 199.8 200.2 198.5 199.1 198.7 197.0 198.5 197.2
Upper Bearing Oil Temp. −
Oil Cooler Inlet Air Temp. (
◦
C) 13.8 12.7 13.4 12.8 11.5 13.4 13.8 14.7 21.5
Turbine Bearing Oil Temp. (
◦
C) 52.4 49.8 50.1 50.1 46.8 47.9 48.5 38.5 39.8
Thrust Bearing Temp. (
◦
C) 50.2 50.1 51.5 50.0 50.0 .48.6 48.8 41.0 40.8
Bottom Oil Tank Oil Temp. (
◦
C) 43.9 45.8 45.9 46.3 44.8 43.3 44.4 36.5 33.9
Bottom Bearing Inlet Air Temp. (
◦
C) 29.8 30.1 29.8 30.8 31.2 27.6 27.5 21.1 14.1
Turbine Shaft Vibration (X axis) (µm) 190 152 155 168 140 139 155 130 130
Upper Bearing Vibration (Perpendicular) (µm) 6 11 9 7 7 16 22 27 15
Upper Bearing Vibration (Horizon) (µm) 19 20 21 20 21 20 18 16 14
Bottom Bearing Vibration (Perpendicular) (µm) 12 13 13 24 26 14 13 15 15
Bottom Bearing Vibration (Horizon) (µm) 1 1 14 2 1 2 2 1 1
Wheel Cover Vibration (Perpendicular) (µm) 2 2 2 0 0 2 2 22 16
Wheel Cover Vibration (Horizon) (µm) 28 28 0 2 2 24 26 0 3
Data Point No. 10(15) 11 12 13 14 15 16 17 18
Revolutions Per Minute 198.8 198.7 196.0 203.3 199.1 200.7 198.7 199.0 197.2
Upper Bearing Oil Temp. −
Oil Cooler Inlet Air Temp. (
◦
C) 21.9 23.7 22.2 20.5 13.8 16.1 15.4 11.3 11.2
Turbine Bearing Oil Temp. (
◦
C) 40.0 37.9 42.2 43.9 29.2 35.7 43.0 28.8 27.8
Thrust Bearing Temp. (
◦
C) 41.3 40.5 50.1 43.1 37.2 42.8 45.9 39.8 39.3
Bottom Oil Tank Oil Temp. (
◦
C) 34.0 31.8 35.2 35.8 30.2 35.2 39.3 32.6 31.9
Bottom Bearing Inlet Air Temp. (
◦
C) 13.9 11.4 16.2 17.2 17.9 19.8 22.3 22.9 23.8
Turbine Shaft Vibration (X axis) (µm) 126 120 295 135 73 86 111 65 72
Upper Bearing Vibration (Perpendicular) (µm) 22 14 23 4 6 22 9 8 14
Upper Bearing Vibration (Horizon) (µm) 15 12 20 14 14 16 15 14 15
Bottom Bearing Vibration (Perpendicular) (µm) 16 16 14 15 19 17 17 29 29
Bottom Bearing Vibration (Horizon) (µm) 8 0 1 9 1 1 11 1 1
Wheel Cover Vibration (Perpendicular) (µm) 4 14 2 3 19 20 2 0 0
Wheel Cover Vibration (Horizon) (µm) 0 2 2 0 2 0 0 1 1
Note: The data point numbers from Table 4 are shown in parentheses.
for the one-class SVM (OCSVM) were highly biased
in summer. On the other hand, the one-class SKM
(OCSKM) reduced this bias.
Tables 6 and 7 show the weight factors w for the
starting condition data and parallel condition data. In
OCSKM, the turbine bearing oil temperature, thrust
bearing temperature, and bottom oil tank oil temper-
ature are zero. These temperature features reach high
values in summer. Therefore, the unusual condition
data of OCSVM increase in summer.
4 CONCLUSIONS
There are two kinds of trouble condition signs. The
first indicates an accidental trouble condition, where
the data are different from the usual condition data.
The other kind of trouble condition sign indicates
SelectionofSensorsthatInfluenceTroubleConditionSignDiscoverybasedonaOne-classSupportKernelMachinefor
HydroelectricPowerPlants
471
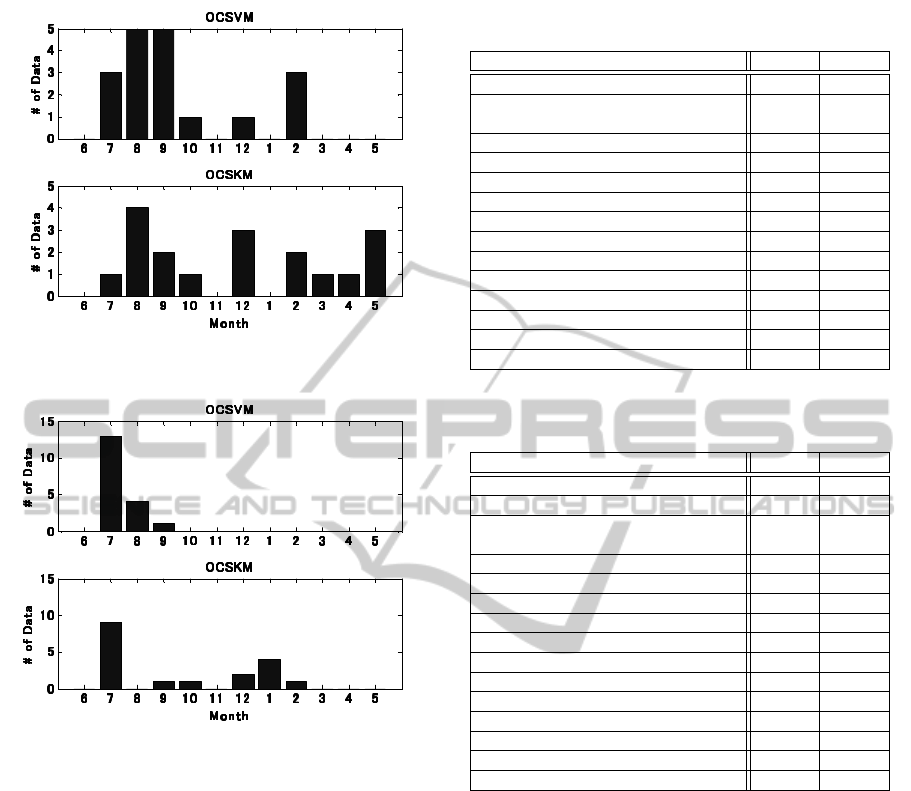
Figure 3: Monthly Distribution of Unusual Condition Data
(Starting Operation Condition).
Figure 4: Monthly Distribution of Unusual Condition Data
(Parallel Operation Condition).
aging degradation. If aging degradation occurs in
a hydroelectric power plant, then this second kind
of trouble condition sign increases year by year. In
our method, we identified this second kind of trou-
ble condition sign using special unusual condition
data, which were discovered by an interaction be-
tween computers and human experts. However, it is
difficult for human experts to evaluate whether or not
sensors with weights of nearly zero affect an unusual
condition. If our detection method is introduced in
actual plant, human experts will need to confirm the
trouble condition signs in daily operations. Hence,
there is a need to be able to confirm trouble condition
signs using a small number of sensors. In this paper,
we proposed a method for narrowing down the sen-
sors that indicate an unusual condition. This method
was based on a one-class SKM.
Our unusual condition discovery experiment
showed that the one-class SKM found the trouble con-
dition signs in a hydroelectric power plant by using a
Table 6: Weighting Factors for Starting Operation Condi-
tion.
OCSVM OCSKM
Revolutions Per Minute 8.13 0.54
Upper Bearing Oil Temp. −
Oil Cooler Inlet Air Temp. (
◦
C) 9.16 0.72
Turbine Bearing Oil Temp. (
◦
C) 2.62 0
Thrust Bearing Temp. (
◦
C) 2.02 0
Bottom Oil Tank Oil Temp. (
◦
C) 2.38 0
Bottom Bearing Inlet Air Temp. (
◦
C) 4.22 0
Turbine Shaft Vibration (X axis) (µm) 7.70 1.68
Upper Bearing Vibration (Perpendicular) (µm) 9.22 0.29
Upper Bearing Vibration (Horizon) (µm) 3.45 0
Bottom Bearing Vibration (Perpendicular) (µm) 10.33 2.98
Bottom Bearing Vibration (Horizon) (µm) 11.81 2.15
Wheel Cover Vibration (Perpendicular) (µm) 13.23 2.45
Wheel Cover Vibration (Horizon) (µm) 10.86 2.20
ρ 52.72 10.71
Table 7: Weighting Factors for Parallel Operation Condi-
tion.
OCSVM OCSKM
Generated Output (MW) 1.58 0.09
Revolutions Per Minute 3.34 1.26
Upper Bearing Oil Temp. −
Oil Cooler Inlet Air Temp. (
◦
C) 9.83 3.35
Turbine Bearing Oil Temp. (
◦
C) 0.73 0
Thrust Bearing Temp. (
◦
C) 1.20 0
Bottom Oil Tank Oil Temp. (
◦
C) 1.49 0
Bottom Bearing Inlet Air Temp. (
◦
C) 2.09 1.72
Turbine Shaft Vibration (X axis) (µm) 7.72 0.75
Upper Bearing Vibration (Perpendicular) (µm) 9.68 1.20
Upper Bearing Vibration (Horizon) (µm) 6.17 0.24
Bottom Bearing Vibration (Perpendicular) (µm) 9.80 1.36
Bottom Bearing Vibration (Horizon) (µm) 10.50 1.37
Wheel Cover Vibration (Perpendicular) (µm) 10.59 1.39
Wheel Cover Vibration (Horizon) (µm) 9.76 1.27
ρ 48.65 11.95
large quantity of usual condition data. In addition,
a one-class SKM was found to reduce the extraction
bias in summer for the one-class SVM.
In future work, we plan to apply our method to
evaluate the soundness of real hydroelectric power
plants in Japan and verify the effectiveness of our
method for risk management in hydroelectric power
plants.
REFERENCES
Bach, F. R., Lanckriet, G. R. G., and Jordan, M. I. (2004).
Multiple kernel learning, conic duality, and the SMO
algorithm. In Proceedings of the twenty-first interna-
tional conference on Machine learning, ICML ’04.
Jardine, A. K., Lin, D., and Banjevic, D. (2006). A review
on machinery diagnostics and prognostics implement-
IJCCI2013-InternationalJointConferenceonComputationalIntelligence
472

ing condition-based maintenance. Mechanical Sys-
tems and Signal Processing, 20(7):1483 – 1510.
Lanckriet, G. R. G., Cristianini, N., Bartlett, P., Ghaoui,
L. E., and Jordan, M. I. (2004). Learning the ker-
nel matrix with semidefinite programming. Journal of
Machine Learning Research, (5):27–72.
Onoda, T., Ito, N., and Hironobu, Y. (2009). Trouble condi-
tion sign discovery based on support vector machines
for hydroelectric power plants. In Proceedings of the
2009 international joint conference on Neural Net-
works, IJCNN’09, pages 1201–1208.
Sch
¨
olkopf, B., Smola, A. J., Williamson, R. C., and Bartlett,
P. L. (2000). New support vector algorithms. Neural
Computation, 12(5):1207–1245.
Yamana, M., Murata, H., Onoda, T., Ohashi, T., and Kato,
S. (2005). Development of system for crossarm reuse
judgment on the basis of classification of rust images
using support vector machine. In Proceedings of the
17th IEEE International Conference on Tools with Ar-
tificial Intelligence, ICTAI ’05, pages 402–406, Wash-
ington, DC, USA. IEEE Computer Society.
SelectionofSensorsthatInfluenceTroubleConditionSignDiscoverybasedonaOne-classSupportKernelMachinefor
HydroelectricPowerPlants
473
