
Analysis of Mexican Research Production
Exploring a Scientifical Database
Silvia B. González-Brambila
1
, Mihaela Juganaru-Mathieu
2
and Claudia N. González-Brambila
3
1
Departamento de Sistemas, Universidad Autónoma Metropolitana, Unidad Azcapotzalco,
Av. San Pablo 180, Col. Reynosa Tamaulipas, México D.F., C.P. 02200, Mexico
2
Departement ISCOD, Institut Henri Fayol, Ecole Nationale Supérieure des Mines de Saint Etienne,
158, cours Fauriel, 42023-F, Saint Etienne, France
3
Department of Business Administration, Instituto Tecnológico Autónomo de Mexico,
Río Hondo 1, Col. Atizapan San Angel, México, D.F. C.P. 01080, Mexico
Keywords: Text Mining, Analysis, Clustering, Scientific Field.
Abstract: This paper presents an exploring analysis of the research activity of a country using ISI web of Science
Collection. We decided to focus the work on Mexican research in computer science. The aim of this text
mining work is to extract the main direction in this scientific field. The focal exploring axe is: clustering.
We have done two folds analysis: the first one on frequency representation of the extracted terms, and the
second, much larger and difficult, on mining the document representations with the aim of finding clusters
of documents, using the most used terms in the title. The cluster algorithms applied were hierarchical,
kmeans, DIANA, SOM, SOTA, PAM, AGNES and model. Experiments with different number of terms and
with the complete dataset were realized, but results were not satisfactory. We conclude that the best model
for this type of analysis is model based, because it gives a better classification, but still it needs better
performance algorithms. Results show that very few areas are developed by Mexicans.
1 INTRODUCTION
This paper presents an analysis of a research activity
in the field of computer science. We have chosen to
work with the Mexican production in the field of
computer science during the years 2009-2011 (our
choice of this field was induced by our own
competencies). Naturally, our work is easy
translatable in to other science fields with a weak
condition of a domain expert presence.
Document classification has a lot of different
applications, like sentimental analysis in social
media, e-mail spam, news monitoring, and sorting
out useful documents from documents that are not of
interest. Document classification can be coarsely
divided in supervised and unsupervised (clustering).
One of the disadvantages of the supervised
classification is that it is necessary to assign the
categories in advance. In general, the classification
of research papers is done manually by the authors
or by specialized people.
Computer Sciences have a lot of subareas, and is
one of the disciplines with highest growth. The most
used classifications are from ACM and Microsoft
Research Search. It would be desirable to find
something similar to these classifications.
The Association for Computing Machinery
(ACM) is a U.S. –based international learned society
for computing. Founded in 1947, it´s the world’s
largest and most prestigious scientific and
educational computing society. The 2012 ACM
Computing Classification System (ACM, 2012) was
created by a group of volunteers. It serves as a
standard classification system in the computing
field, and has been developed as a poly-hierarchical
ontology that can be utilized in semantic web
applications. The main areas considered are eleven:
Hardware, Computer Systems Organization,
Networks, Software and its engineering, Theory of
Computation, Mathematics of Computing,
Information Systems, Security and Privacy, Human-
Centered Computing, Computing Methodologies
and Applied Computing.
Microsoft Academic Search (Microsoft, 2012) is
a service developed by Microsoft Research to find
academic content, researchers, institutions and
177
González Brambila S., Juganaru-Mathieu M. and González-Brambila C..
Analysis of Mexican Research Production - Exploring a Scientifical Database.
DOI: 10.5220/0004548201770182
In Proceedings of the International Conference on Knowledge Discovery and Information Retrieval and the International Conference on Knowledge
Management and Information Sharing (KDIR-2013), pages 177-182
ISBN: 978-989-8565-75-4
Copyright
c
2013 SCITEPRESS (Science and Technology Publications, Lda.)

activities. It indexes academic papers and authors.
The main areas considered are: Algorithms,
Artificial Intelligence, Bioinformatics &
Computational Biology, Computer Education,
Computer Vision, Data Mining, Databases,
Distributed & Parallel Computing, Graphics,
Hardware & Architecture, Human-Computer
Interaction, Information Retrieval, Machine
Learning & Pattern Recognition, Multimedia,
Natural Language & Speech, Networks &
Communications, Operating Systems, Programming
Languages, Real-time & Embedded Systems,
Scientific Computing, Security & Privacy,
Simulation, Software Engineering and World Wide
Web.
The main contribution of this paper is that it
shows that some human experience is needed in
order to interpret the results obtained by different
data mining techniques, because they produce
different results when the same database is
considered. Also, that there are only few areas in
which Mexicans are working in. In this paper we
analyzed all titles of ISI research papers written by
Mexican researchers during 2009, 2010 and 2011.
The obtained results are completely no satisfactory,
and we need to improve and refine some of the
existing clustering algorithms.
The ISI database that is used in this analysis
contains all publication in Science and Social
Science Citation Indexes, in which at least one
Mexican researcher participates. The data was
produced by Thomson Reuters in April, 2012.
In the second section of this paper we present the
related work and give more detail about our
exploring directions. Section 3 presents the
collection we used and the pre-processing steps.
Section 4 briefly describes the clustering algorithms
used and the measures for validating results. Section
5 is dedicated to present the results of the
experiments and their interpretation. We finish
presenting some conclusions and future work.
2 RELATED PAPERS
Without any doubt, the development of the web and
the development of the representation of the textual
documents in numerical format have a lot of effects
in the way to publish, organize, ask for, treat and
save information. Scientific information also is
growing in a significant way. According to (Laakso
and Björk, 2012) the study about the open access
publishing, some 340,000 articles were published
during 2011.
Websites have indexes and offer partial access.
Some are organized by domain, like ACM and
BioMed Central, for example, or by publisher like
ScienceDirect or IEEE, and all of these can provide
references and also complete contents; other type of
web sites collect an important part of references of
scientific publications and have enormous directory
of references. That is the case of ISI Web of Science
or DLP. In this case, any reference is associated with
the link of the source on the web site containing the
whole paper.
The references or complete papers collection has
a specific access for institutions like universities,
research departments of companies or governmental
agencies. A user may be a scientist interested in his
own domain, or a connected or a general domain
like statistics; a user may also be a scientist in
human or social sciences interested in detecting
much more knowledge, or also a governmental user
interested in the quality, the volume, the main
domains or sub-domains that need to be encouraged
or strongly supported.
All these websites contain powerful information
retrieval tools, but the last type user is much more
interested in “synthetically” (aggregate) information
and knowledge. Text mining has an important role to
play into detecting potentially interesting
information and knowledge.
On the other hand, the collections of scientific
publications are often used as experimental
collection to illustrate text mining techniques,
measures and algorithms like (Sebastiani, 2005) and
(Hazewinkel, 2002). Also a large amount of specific
text mining algorithms, pre-treatment processes and
techniques were involved like in (Balys et al., 2010),
(Galindo et al, 2010), (Taheriyan, 2011). Balys and
Rudzkis in (Balys et al., 2010) have suggested a
classifier adapted to scientific papers, their classifier
is based on some probabilistic models in the aim to
choose the positions of the terms to take into account
(the same for all document), these positions are
called projection on a set of indices; the
classification was done inside the classes of applied
mathematics and statistics. In (Galindo et al., 2010)
only the punctuation signs are used to classify inside
huge classes of domains like medicine, engineering,
and social science. Taheriyan (Taheriyan, 2011)
have worked on a text mining technique based on a
construction of a directed graph within scientific
documents.
Sometimes, the scientific articles or research
projects mining process use external semantic
resources like WordNet lexical categories (Gharib et
al., 2010) or specific ontologies (Ma et al., 2012).
KDIR2013-InternationalConferenceonKnowledgeDiscoveryandInformationRetrieval
178

Our choice was to treat all the papers in the large
domain of the computer science extracted from ISI
Web of Science. We have analyzed a three year
window of publications using generic techniques of
data and text mining. Our deliberate choice to work
with a fixed in time collection has induced a finite
set of terms, in opposite with (Hazewinkel, 2002)
which considers the evolution of the set of terms
detecting some probabilistic laws of growing. The
aim of our analysis is to detect some potential
interesting information for research governmental
agencies like ConaCyT (National Council for
Science and Technology in Mexico).
3 DATA PREPROCESSING
We originally extract 1,585 papers with 4,183
different terms of the ISI Database. The maximum
and minimum length of a title was 27 and one
words, respectively.
In order to make the analysis we make a
preprocess that consisted in convert all the words in
lower case, remove some punctuation and stop
words, and extract the root of the words. We review
several times by hand the dictionary and made some
adjustments; trying to put together different patterns
that usually refer to the same concept; see Table 1.
After this process, the terms were reduced to 2,765.
We can interpret a term as important according
to a simple counting of frequencies. The root terms
with highest frequency are “system” (203), “model”
(188), “control” (167), “network” (156), “fuzzy”
(132), “algorithm” (118), “neural” (116), “optim”
(108), “design” (96) and “applic” (89) (see Fig. 1).
We can conclude that there is a lot of work in
systems, modeling, control, networks, fuzzy and
algorithms.
Table 1: Some terms replaced by others.
Pattern Replaced with
3-d, three-dimensional 3d
2-d, two-dimensional 2d
ga, genetic-algorithm, genetic algorithm
neural-network, nn neural network
multi-objective, multiobjective multi objective
real-time real time
agent-based agent based
data set, data-base database
Table 2 shows the high correlation between the
most frequency root terms. This gives us
information about “neural networks”, “fuzzy logic”
and “genetic algorithms”. However the correlations
are very small. Fig. 1 and Table 2 give us an idea
that most of the research work doing in Mexico is
about Artificial Intelligence and much of the titles
are about control or optimization, perhaps with
neural networks and genetic algorithms.
Figure 1: Cloud Word with the 100 most frequently root
terms with a frequency minimum of five.
After the cleaning phase we obtained a
1,585*2,765 matrix. An idea was to do a
dimensionality reduction (DR). In (Sebastiani, 2002)
for a problem of classification the author define a
supervised DR using controlled vocabulary as some
parts of terms inside a sub-domain or the whole
subdomain. We couldn’t use this approach because
we didn’t use any external resource. We have
intended some unsupervised DR eliminating terms
based on the frequency inside the collection and
respecting a threshold. The clusters obtained were
(very often) really different for very closed threshold
values and also some document representations
became empty.
Table 2: Correlation between high frequency root terms.
Root term Higher correlations
System
linear (0.23), suboptim (0.17), central (0.15),
stochast (0.15)
model
transact (0.14), dock (0.14), probabilist (0.13)
Control
bar (0.23), chart (0.23), synthetic-(x) (0.23),
robot (0.22), time (0.22), fuzzi (0.20)
Network
neural (0.62), recur (0.28), social (0.24),
modular (0.22)
Fuzzi
logic (0.49), type (0.36), interv (0.29), infer
(0.24),backlash (0.20), control (0.20)
algorithm
genet (0.36), memetic (0.20), pso (0.19)
neural
network (0.62), recur (0.28), modular (0.24),
decentr (0.21)
Optim
swarm (0.28), particl (0.20), electrostat
(0.19), weld (0.19)
design
suboptim (0.22), analogu (0.21), central
(0.20), infin (0.19)
applic
chao (0.35), moment (0.35), ration (0.35),
adms (0.35), short (0.29)
AnalysisofMexicanResearchProduction-ExploringaScientificalDatabase
179

4 TEXT MINING PROCESS
Clustering is an unsupervised technique used to
group together objects which are “close” to one
another. In this paper we try to group the titles in
several clusters that represent the subareas worked
by Mexican researchers.
Deciding which clustering method to use can be
a complex task. Additionally, determining the
number of clusters that are most appropriate for the
data can be a hard problem. Ideally, resulting
clusters should have good statistical properties and
also give relevant results. Cluster analysis is an
exploratory data analysis tool for organizing
observed data into meaningful clusters, trying to
maximize the similarity of cases within each cluster
and maximizing the dissimilarity between those
clusters.
There are several measures for validating results
of a cluster analysis (Brock et al, 2008). This
validation can be based on the internal properties of
the data or on some external reference. We applied
internal cluster validation and consider connectivity,
Dunn index and silhouette width. Connectivity must
be minimized and the other two maximized. For
validate the cluster analysis we used the R package
clValid (Brock et al, 2011).
The clustering methods were: hierarchical,
kmeans, DIANA, SOM, SOTA, PAM, AGNES and
model. Hierarchical clustering is an agglomerative
clustering algorithm, where clusters are successively
joined together in order of their “closeness”. K-
means is an iterative method which minimizes the
within-class sum of squares for a given number of
clusters. DIANA is a divisive hierarchical algorithm
that starts with all observations in a single cluster,
and successively divides the clusters until each
cluster contains a single observation. SOM (Self-
organizing maps) is an unsupervised learning
technique based on neural networks. SOTA (Self-
organizing tree algorithm) is an unsupervised
network with a divisive hierarchical binary tree
structure. PAM (Partitioning around medoids) is
similar to K-means, but admits the use of other
dissimilarities. AGNES (Agglomerative Nesting) is
a hierarchical clustering method which works
bottom-up, initially each element is a cluster on its
own, and then merges two closest clusters into one,
until there is one remaining cluster which contains
all the elements. In model-based clustering, a
statistical model consisting of a finite mixture of
Gaussian distributions is fit to the data where each
mixture component represents a cluster, and the
mixture components and group membership are
estimated using maximum likelihood (EM
algorithm).
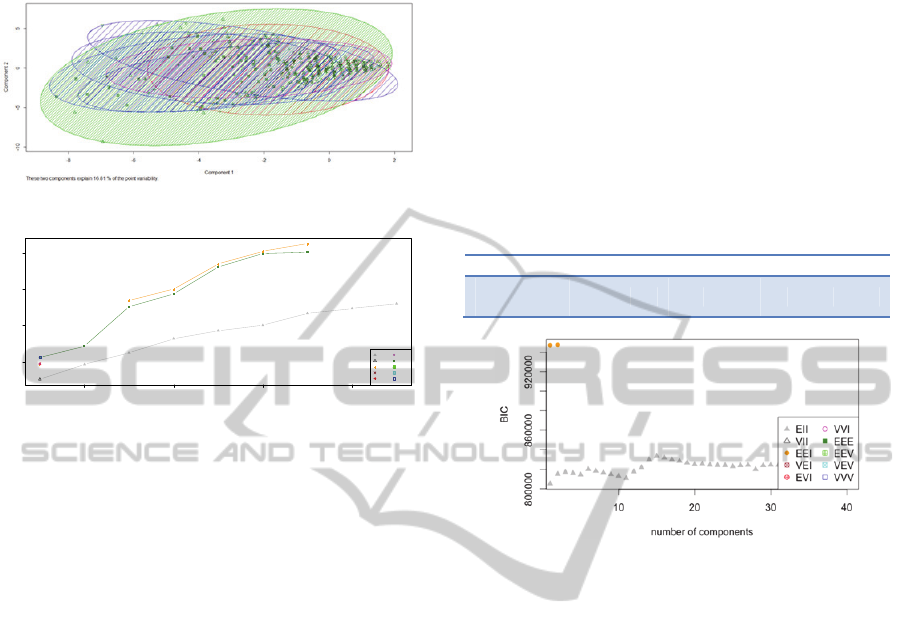
Figure 2: Validation internal measures for all root terms
data.
5 RESULTS
For internal cluster validation we consider from two
to twenty clusters. We remove sparse terms and
form, group A with 19 terms, group B with 45 terms
and group C with 147 with minimum frequency of
48, 32, 16, respectively.
For group A the optimal scores are for
hierarchical with 2 clusters in Connectivity with
2.9290 and Silhouette with 0.1816 and hierarchical
with 19 with 1.0196 for Dunn. So in this particular
case hierarchical clustering with two clusters
performs the best. The Dunn index of 19 represents
that each word is in a cluster.
We used hierarchical clustering (Zhao et al,
2005) with the ward’s minimum variance method,
which denotes the increase in variance when two
clusters are merged. Regrettably almost everything
is in one cluster.
These results suggest that the Mexican Research
in Computer Science community is working in two
main areas.
We repeat the same experiment with group B and
group C. Both results are much similar to the group
A. For group B the optimal scores are for
hierarchical with two clusters in Connectivity with
2.9290 and Silhouette with 0.3077 and hierarchical
with 18 with 0.8914 for Dunn. For group C the
optimal scores are for hierarchical with two clusters
1
1
1
11
1
1
11
0 200 400 600
Internal validation
Number of Clusters
Connectivity
22
22
2
2
2
22
3
3
3
33
3
3
3
3
4
4
4
4
4
4
44
4
5
5
5555555
66
6
6
66
6
6
6
7
7
7
77
7
7
77
2345678910
1
1
1
1
1
1
1
11
0.20.40.60.8
Internal validation
Number of Clusters
Dunn
2
2
2
2
2
2
2
2
2
3
3
3
3
3
3
3
3
3
4
4
4
4
4
4
4
4
4
555
555
555
66
6
6
6
66
6
6
7
7
7
7
7
7
7
77
2345678910
1
1
1
1
1
1
1
11
0.2 0.4 0.6 0.8
Internal validation
Number of Clusters
Silhouette
2
2
2
2
2
2
2
22
3
3
3
33
3
3
3
3
4
4
4
4
4
44
4
4
5
5555555
5
66
666
6
666
7
7
7
7
7
7
7
77
2345678910
1
2
3
4
5
6
7
hierarchical
kmeans
diana
som
sota
pam
agnes
KDIR2013-InternationalConferenceonKnowledgeDiscoveryandInformationRetrieval
180
in Connectivity with 2.9290 and Silhouette with
0.4723 and hierarchical with 4 with. 0.8221.
Figure 3: Selection of the EEI like best model.
Figure 4: Cluster plot of the model.
Finally we run the experiment with all the 2765
root terms and the results confirm the three previous.
The optimal scores in this case were hierarchical
with two clusters in connectivity with a score of
2.9290, hierarchical with four clusters in the Dunn
index with a score of 0.8149 and hierarchical with
two clusters in Silhouette with a score of 0.8265 (see
Fig. 2). The best five algorithms rank are,
hierarchical-2 hierarchical-4 hierarchical-2 diana-2
and diana-4. So, we these results the best candidate
is hierarchical with two clusters.
Model based approaches assume several data
models and apply likelihood estimation and Bayes
criteria. We used Mclust() function in the mclust
package of R that selects the optimal model
according to Bayesian Information Criterion (BIC)
(Schwarz, 1978). This function selected the “EEI”
model, where clusters has equal volume and shape
with 7 components. See fig. 3.
The number of titles in each cluster is show in
table 3 and the plot in Fig. 4. From this table we can
observed that cluster number 2 has more than the
half of all the titles.
The model based approach has more clusters, so
it seems to be more appropriate this division in order
to try to find some tendency or classification in the
research work.
One last calculi we done were about the most
appropriate model to our collection and the ideal
number of clusters. We have supposed that our
collection is a mixture of the same model for all the
clusters, every cluster having the same model class
(implicitly the same shape) and various parameters.
In base of the works of (Fraley and al, 2007) and
Fraley et al, 2002) and using the package mclust of
R, we have obtained that the BIC values (a measure
of the fitness of the model) are best only for 2 or 3
clusters in the hypothesis of model of type EEI and
also for each k number of clusters between 2 and 40
a model of type EII (more restricted and each matrix
is the matrix of eigenvalues). See figure 5 to
illustrate this. In conclusion, the number of clusters
is between two and four.
Table 3: Clustering table.
Cluster 1 2 3 4 5 6 7
Numberof
Elements
71 894 119 172 95 110 127
Figure 5: Variation of BIC value upon the numbers of
clusters and the most fit models.
6 CONCLUSIONS AND
PERSPECTIVE
Deeping our understanding of the state of art of the
Mexican research in Computer could be can be
worthwhile in order to identify the gap of knowledge
among Mexican researcher and for government
agencies to support or not research and funding in
some areas and for students and new researchers
because they can consider work or not in a subarea.
In order to know where Mexican researchers are
working in we analyze different clustering algorithm
in order to regroup the titles of the indexed papers
during 2009, 2010 and 2011.
The highest frequent results give us only few
information, for example we can’t know what area
of networks are working in, computer networks,
neural networks or social networks. High correlation
results show that most of the papers of Mexican
researchers in Computer Science are related with
neural networks, fuzzy logic and genetic algorithms
and there is also a significant amount of work in
control and optimization systems.
2468
0 5000 10000 15000
Number of components
BIC
EII
VII
EEI
VEI
EVI
VVI
EEE
EEV
VEV
VVV
AnalysisofMexicanResearchProduction-ExploringaScientificalDatabase
181

We analyse different algorithms with different
number of clusters, terms and internal properties and
the results shows that the most appropriate number
of clusters is between two and four. However this
number of clusters (areas) is very small compared
with ACM or Microsoft. Analyzing the titles in these
clusters, the papers of the collection can be grouped
in Artificial Intelligence and Modeling Systems, but
this conclusion requires some human analysis, so we
need apply some contextual information to produce
computer science meaningful clusters.
It is needed to do more experiments in order to
try to select one or a few clustering algorithms that
automatically classify the titles of scientific papers.
As a future work we are going to apply these
algorithms to the keywords and abstracts of the
papers in order to compare the results obtained.
Also we are planning consider the membership
of several areas, two or three. This is natural because
computer science is an interdisciplinary science and
there is a lot trying to resolve problem of other areas.
We also think that would be interesting to work in a
window time of two or five year in order to analyse
the evolution of the research in one country as with
several ones.
Our approach is also applicable for any scientific
field.
REFERENCES
ACM (2012). Retrieved January 8, 2013, from
dl.acm.org/ccs.cfm.
Vaidas Balys, Rimantas Rudzkis (2010) Statistical
Classification of Scientific Publications, Informatica,
Volume 21, Issue 4, pp 471 – 486.
Guy Brock, Vasyl Pihur, Susmita Datta and Somnath
Datta (2008). clValid: An R Package for Cluster
Validation, Journal of Statistical Software. March
2008, Volume 25, Issue 4. http://www.jstatsoft.org.
Guy Brock, Vasyl Pihur, Susmita Datta and Somnath
Datta (2011). clValid: Validation of Clustering
Results. R package version 0.6-4. http://CRAN.R-
project.org/package=clValid.
G. Csardi, T Nepusz (2006). The igraph software package
for complex network research, InterJournal, Complex
Systems 1695. 2006. http://igraph.sf.net.
Ingo Feinerer, Kurt Hornik, and David Meyer (2008). Text
Mining Infrastructure in R. Journal of Statistical
Software 25(5): 1-54. URL: http://www.jstatsoft.org/
v25/i05/.
Ingo Feinerer and Kurt Hornik (2013). tm: Text Mining
Package. R package version 0.5-8.3. http://CRAN.R-
project.org/package=tm.
Ian Fellows (2012). wordcloud: Word Clouds. R package
ver2.2 http://CRAN.R-project.org/package=wordcloud
C. Fraley, A. E. Raftery (2007). Bayesian regularization
for normal mixture estimation and model-based
clustering. Journal of Classification, Vol. 24, Issue2,
pp. 155-181.
C. Fraley, A. E. Raftery (2002). Model-based clustering,
discriminant analysis and density estimation. Journal
of the American Statistical Association, Vol. 97, pages
611-631.
Cristal-Karina Galindo Duran, Mihaela Juganaru-Mathieu,
Carlos Aviles Cruz, Héctor Javier Vazquez (2010).
Desarrollo de una aplicación destinada a la
clasificación de información textual y su evaluación
por simulación, Administración y Organizaciones
25:13, pages 119-131.
Tarek Gharib, Mohammed Fouad, Mostafa Aref (2010)
Fuzzy Document Clustering Approach using WordNet
Lexical Categories. In Advanced Techniques in
Computing Sciences and Software Engineering,
Khaled Elleithy (editor), Springer, pp 181-186.
Michiel Hazewinkel (2005) Dynamic Stochastic Models
for Indexes and Thesauri, Identification Clouds, and
Information Retrieval and Storage, In Recent
Advances in Applied Probability, Ricardo Baeza-Yates
et al (editors), Springer US, 2005, pp 181-204.
Mikael Laakso, Bo-Christer Björk (2012). Anatomy of
open access publishing: a study of longitudinal
development and internal structure, BMC Medicine,
10:124, pp 1-9.
Jian Ma; Wei Xu; Yong-hong Sun; Turban, E.; Shouyang
Wang; Ou Liu (2012) "An Ontology-Based Text-
Mining Method to Cluster Proposals for Research
Project Selection," Systems, Man and Cybernetics,
Part A: Systems and Humans, IEEE Transactions on ,
vol.42, no.3, pp 784-790.
M. Maechler, P Rousseeuw, A. Struyf, M. Hubert, K.
Hornik, (2012). cluster: Cluster Analysis Basics and
Extensions. R package version 1.14.3.
Microsoft Academic Search (2012). Retrieved January 22,
2013, from academic.research.microsoft.com.
R. Core Team (2013). R: A language and environment for
statistical computing.
R Foundation for Statistical
Computing, Vienna, Austria. ISBN 3-900051-07-0,
URL htttp://www.R-project.org/.
G. Schwarz (1978). Estimating the dimension of a model.
The Annals of Statistics, 6:461-464, 1978.
Fabrizio Sebastiani (2002) Machine learning in automated
text categorization, Journal ACM Computing Surveys,
Volume 34 Issue 1, pages 1 – 47.
Mohsen Taheriyan (2011) Subject classification of
research papers based on interrelationships analysis. In
Proceedings of the 2011 Workshop on Knowledge
Discovery, Modeling and Simulation (San Diego,
California, USA, August 2011). KDMS '11. ACM,
New York, NY, pages 39-44.
H. Wickham (2009) ggplot2: elegant graphics for data
analysis. Springer New York.
Ying Zhao, George Karypis, Usama Flayyad (2005),
Hierarchical Clustering Algorithms for Document
Datasets, Data Mining and Knowledge Discovery,
Volume 10, Issue 2, March 2005, pages 141-168.
KDIR2013-InternationalConferenceonKnowledgeDiscoveryandInformationRetrieval
182
