
Wood Piece Quality Evaluation using Choquet Integral and Fuzzy
Merging
Jeremy Jover
1,2
, Vincent Bombardier
1,2
and Andre Thomas
1,2
1
Universit
´
e de Lorraine, CRAN, UMR 7039, Campus Sciences, BP 70239,
54506, Vandœuvre-l
`
es-Nancy Cedex, France
2
CNRS, CRAN, UMR 7039, Vandœuvre-l
`
es-Nancy Cedex, France
Keywords:
Virtual Quality, RX Computed Tomography, Information Fusion, Fuzzy Operators, Choquet Integral,
Divergent Process.
Abstract:
This paper presents a way to evaluate the wood product quality according to his tomographic image. The use
of X ray computed tomography and ad-hoc software allows to have a representation of an item (a product)
before the first cutting operation. From this representation, we aim to obtain an honest evaluation of their
aesthetic quality. To do that singularity features are extracted and their impact on the product visual quality
is assesed thanks to the Choquet integral. Next, the visual quality is evaluated by merging singularity impacts
and singularity number criterion using suitable operators. Three operators are compared to the mean operator
which is the commonly used one when there are few knowledge on the decision process.
1 INTRODUCTION
Divergent processes have always presented a diffi-
culty for the traceability implementation. The raw
material cutting leads two problems:
• The link between material and production infor-
mation is difficult to establish and to maintain all
along the product cycle life.
• Foresee the finish products features, which are
very useful for traceability and production man-
agement, is full of uncertainty.
Some solutions are proposed to overcome this
problem especially in the food industry. These solu-
tions are based on marking and documenting batches
(Dupuy, 2004). However a part of the root informa-
tion is lost and an unique identification is not still pos-
sible (what is ideally expected).
The wood industry is also concerned by these di-
vergent process problems. From a tree, products sat-
isfying the end customer’s needs must be produced.
Moreover the product origin traces have to be con-
served for traceability reasons (PEFC1, 2010).The
wood, being a heterogeneous material, increases com-
plexity. Structurally, the wood is composed of aligned
fibres following a longitudinal axe. It not reacts in the
same way following the different axes (longitudinal,
radial, tangential). The wood colour is not homoge-
neous too: the growing rings , the singularity presence
or the fungal attacks (blue stain) create heterogeneity
on visual and mechanical points of view.
In sawmills, the optimization, in order to have the
right products, is an important and complicated task.
Sawyers have to saw products which have characteris-
tics needed by customers, from a raw material which
internal characteristics are unknown. Dimensionally,
it is easy to foresee and have the right product dimen-
sion (apply the cutting pattern), but other features as
the colour or the mechanical resistance are more com-
plicated to estimate and to characterize before the log
is sawed due to their subjectivity character and the
wood heterogeneity.
Our researches is concerned by the information
loss reduction in the wood industry. We have pro-
posed a solution to mark and maintain the origin in-
formation of the trees (Jover et al., 2011). In this
study, we propose a way to determine the wood prod-
uct characteristics before sawing operation in order to
satisfy the customer needs and the optimal determi-
nation of the production element (net requirement for
each product quality class). The proposed approach
aims to automate the product qualification process
(quality product estimation) usually done by an op-
erator. The global process is described Fig. 1.
In this article, we shortly present the wood qual-
ity notion, the sawing optimization process and the
249
Jover J., Bombardier V. and Thomas A..
Wood Piece Quality Evaluation using Choquet Integral and Fuzzy Merging.
DOI: 10.5220/0004553002490256
In Proceedings of the 5th International Joint Conference on Computational Intelligence (FCTA-2013), pages 249-256
ISBN: 978-989-8565-77-8
Copyright
c
2013 SCITEPRESS (Science and Technology Publications, Lda.)

virtual sawing concept allowing to extract the virtual
product. Then we explain how we characterise sin-
gularities and calculate their impact on product with
the Choquet integral. Impact calculation is improved
by using learning process to calculate the Choquet ca-
pacities. To finish, we describe a way to estimate the
wood products quality by using the impact singulari-
ties. We demonstrate the feasibility with distinguish
wood pieces.
2 PRODUCTION FORESEE IN
SAWMILL
2.1 The Visual Quality of Wood
Products
Concerning the needs of the first transformation cus-
tomers
1
, there are three kinds of quality: the dimen-
sional quality, the mechanical quality and the visual
(aesthetic) quality. The dimensional quality is easy
to characterize (dimension piece precision). The me-
chanical quality is more skillful to evaluate. The clear
wood has a mechanical resistance which can be re-
duced by the singularities presence (knots, crack, rot
). Techniques based on the vibrations give results as
explained in (Guillot et al., 1996).
The last one is the visual quality. It is the most
complicated to evaluate because the visual quality is
a subjective decision. The visual quality is defined
in the standard NF EN 1611. This standard defines
different classes of qualities based on the singularity
features measurement (size, numbers, type,...). But
the evaluation is done by a Human Expert which has
to estimate the quality within a short time (accord-
ing to the sawmill high production rate). In this short
time, the expert cannot evaluate singularity features
as precisely as the standard define them. So standard
definition is not adapted to the evaluation. More over
the wood is ”intrinsically fuzzy” (Bombardier et al.,
2007). Boundaries between clear wood and singular-
ities are not so easy to determine and impact the char-
acteristic measures. A big part of the price is based
on the quality, so its determination is important for
customer and sawyers.
2.2 Raw Material Optimization
Sawyers optimise wood by estimating which cutting
plan allows to have the best material yield and satisfy
1
The first transformation of the wood is relative to the
first steps of the wood value chain; that is to say, activities
from the living tree in the forest to the output of the sawmill.
the customer requirement. That is why it is essential
to foresee product features which would be cut in the
log.
The Expert (present at the optimization post) es-
timates product features (dimension, mechanical re-
sistance, visual quality) according to the external log
features and his experiment. He is able to determine
approximately which defects are present in the wood
(according to the external log features) and decides
which cutting plan is the most appropriate to obtain
the customer requirement. So final product aspect
and quality are more or less well determined. We
easily understand that all singularities are not visi-
ble on the surface and singularities which are visible
give only incomplete information on their shapes in
wood. Lot of researches have proposed solutions tak-
ing into account the external shapes of logs (Todor-
oki and R
¨
onnqvist, 2002). But these optimisations are
only based on the log dimensional features and do not
take into account the visual and mechanical charac-
teristics. This paper proposed a way (virtual sawing)
to address this issue.
2.3 Virtual Sawing
The use of non destructive control techniques (Bu-
cur, 2003), in particular X ray computed tomography,
allows to have a 3D representation of the log (inter-
nal and external) to be cut. (Almecija et al., 2012)
use volumetric information to improve part log qual-
ity determination and their sorting. In our proposition
we investigate this step and the global process is de-
scribed in the figure 1.
Figure 1: Extraction and exploitation process of virtual
products.
The log representation is virtually sawed with an
ad-hoc software according to a cutting plan. This
leads to obtain a numerical view of all product faces
which should be obtained. The figure 2 shows one
face for one product. The obtained image represents
the face of a product according to the density data.
IJCCI2013-InternationalJointConferenceonComputationalIntelligence
250

Some information cannot be obtained (the colour) and
the distinction between detected object is not so easy.
All of these add imperfection, imprecision and uncer-
tainty and make the quality determination harder.
Figure 2: Example of a face extracted with the virtual saw-
ing.
2.4 Problematic
Our aim is to propose a process to estimate the wood
product quality according to the face picture extracted
by the virtual sawing stage. We consider that the sin-
gularity features are computed in a similar way as
(Bombardier et al., 2007). So we propose a way to
determine quality products from these measurements.
As obtained information is uncertain, incomplete and
imprecise, we use methods allowing taking into ac-
count this imperfection especially the Choquet Inte-
gral and fuzzy fusion operators. In this paper, we de-
cide to estimate the singularity impact on the product
and then to determine the piece quality.
3 SINGULARITY IMPACT
EVALUATION
L
p
Product length
l
p
Product width
I
p
Product grey level
T
s
Singularity size
X
s
Singularity position on product length
Y
s
Singularity position on product width
I
s
Singularity grey level
3.1 Singularity Criterion Measurement
In our study, we evaluate the visual quality of the
wood. So the criteria have to reflect singularity im-
pact on the visual quality. (Almecija et al., 2012) de-
fines forty criteria to evaluate quality. From this forty
criteria, only around twenty concern the final product
and only a dozen the visual quality. To evaluate sin-
gularity impact on density data, we only use the four
of them which are measurable on a grey scale image.
The first criterion u
t
, described by the equation
(1), reflects the singularity size. More a singularity is
big, more the visual quality is down grading. More-
over the expert judgement stipulates a singularity
higher than 50 mm is considered as highly critical.
If l
p
≤ 50 mm,u
t
= 1 −
T
s
l
p
If l
p
> 50 mm and T
s
≤ 50 mm,u
t
= 1 −
T
s
50
If l
p
> 50 mm and T
s
> 50 mm,u
t
= 0
(1)
The second criterion u
x
, described by the equation
(2), reflects the position of the singularity on the prod-
uct length. More a singularity is close to the prod-
uct end, more this singularity lost importance and the
quality becomes higher.
u
x
=
|L
p
/2 − X
s
|
L
p
/2
(2)
The third criterion u
y
, described by the equation
(3), reflects the position of the singularity on the prod-
uct width. More a singularity is close to the prod-
uct edge, more this singularity lost important and the
quality becomes higher.
u
y
=
|l
p
/2 −Y
s
|
l
p
/2
(3)
The last criterion u
c
, described by the equation (4),
reflects contrast between the singularity and the prod-
uct background. More the contrast is weak, less this
singularity is visible and more the quality increases.
u
c
= 1 −
|I
s
− I
p
|
I
p
(4)
In the following part, we proposed a method using
Choquet integral according to the fact that the singu-
larity characteristic measurements are full of imper-
fection and imprecision (see section 2).
3.2 Impact Calculation using the
Choquet Integral
The Choquet integral was proposed by Gustave Cho-
quet in 1954 (Choquet, 1953). Their use in the
multi-criteria decision making domain appears in the
nineties in different context (car industry, strategical
placement, ) and similar classification problems are
usually process with the Choquet integrals (Grabisch
and Labreuche, 2008). They allow taking into con-
sideration importance of each criterion and the inter-
actions existing between each of them.
Let {X} : {x
1
,...,x
n
} be a set of normalized crite-
ria, consider a capacity µ : ℘(X ) → [0,1] on this set,
verifying:
µ(
/
0) = 0
µ(X) = 1
µ(A) < µ(B), ∀A ⊂ B and ∀B ⊂ X
(5)
The capacity defines all weights and interactions.
Then Choquet integral is defined as follow:
C
µ
(u
1
,..., u
n
) =
n
∑
i=1
(u
σk
− u
σk−1
)µ(A
σk
) (6)
WoodPieceQualityEvaluationusingChoquetIntegralandFuzzyMerging
251

Where σ is the indices permutation satisfying:
0 = u
σ0
≤ u
σ1
≤ ... ≤ u
σn−1
≤ u
σn
≤ 1
u
σ1
= Min(u
i
) et u
σn
= Max(u
i
)
(7)
and A
σk
= {g
σk
,..., g
σn
} the features non used in pre-
vious steps.
In our case, C
µ
(u) corresponds to the measure of
the singularity impact on the product when the Cho-
quet integral is apply on the criteria (µ
i
). More the
value tends to 1, less the singularity is important (our
own standards). The Choquet integral is useful when
the knowledge and the learning batches are low. The
greatest challenge is the definition of the capacities
(Grabisch et al., 2008). To do so, some approaches
were developed to learn the capacities. We detail
them in the next subsection.
3.3 Learning Process of the Capacities
In order to have a better definition of the capacities
used in the Choquet integral, we decide to use a learn-
ing process. Different approaches can be used to iden-
tify capacities (Grabisch et al., 2008):
• The Least Square approach (LS): based on the
expert knowledge on each element. The expert
attributes a target impact value to each element
(experted value) in the learning lot and system
searches capacities values that minimise the dif-
ference square between the computed value and
the expected value.
MinF
LS
(µ) :=
∑
x∈O
[C
µ
(u(x)) − y(x)]
2
(8)
• The Linear Programming approach (LP): pro-
posed by Marichal and Roubens in (Marichal and
Roubens, 2000), it is based on the expert knowl-
edge on the global ranking of the batch elements.
The approach looks for the value which satisfy as
closely as possible the ranking establish by the ex-
pert.
MaxF
LP
(ε) := ε
subj. to
∑
T ⊆S
m
ν
(T ∪ i) ≥ 0, ∀i,∀S
∑
T ⊆N
m
ν
(T ) = 1
C
ν
(u(A)) −C
ν
(u(B)) ≥ δ
C
.
.
.
(9)
In (Grabisch et al., 2008), authors explain that the
least square approach is appropriate when it is pos-
sible to attribute precisely the desired value. They
explain too that the linear programming is better for
cases which it is easy to give a pre-order between the
learning lot element. This is our case for the evalu-
ation of the singularity impact because it is hard for
the expert to give a score for each singularities (due
to number and variation of the cases). The expert de-
cides of a pre-order between elements composing the
learning batch (with a δ
C
corresponding to the mini-
mum margin to respect the ranking) . This constraint,
noted E, can be translate by:
C
µ
(a) > C
µ
(b) > ... > C
µ
(k)
with C
µ
(u(i)) ≥ C
µ
(u(i + 1)) + δ
C
(10)
Some conditions can be imposed, over the element
pre-order, on the criterion importance and/or interac-
tion. The expert can expressed the criterion impor-
tance against one another. By the used of the Shapley
indices φ (which indicates the global importance of
each criterion), the expert expresses the equality be-
tween two criteria. The value δ
φ
is the maximal dis-
tance between two Shapley values to consider two cri-
teria are equal. This constraint, noted S, can express
for a couple of criteria A and B as:
−δ
φ
≤ φ
ν
(µ
A
) − φ
ν
(µ
B
) ≤ δ
φ
(11)
More over the Expert can express constraints on
the interaction between the criteria. The interaction
between two criteria can be easily expressed by the
expert because the phenomena is understandable.But
the interaction between more than two criteria is
harder to understand and express. The last condition
(apply on the interaction indices) is only expressed on
interaction between a pair of criteria. This constraint,
noted I, can be:
• negative (redundancy) : I
ν
({A,B}) < 0 − δ
I
• positive (synergies) : I
ν
({A,B}) > 0 + δ
I
• null (no interaction) : I
ν
({A,B}) = 0 ± δ
I
δ
I
is the minimum threshold value in absolute value
to consider the interaction as significant.
Using the software R and the Kappalab R pack-
age, we compute the LP approach in order to deter-
mine the capacities and influence of the calculated
values on the Choquet integral results.
3.4 Result of the Learning Process LP
The learning batch described in the table 1, is com-
posed of singularities which are commonly found in
the wood.
Expert constraints are describe below:
• On the elements batch (E): The singularities are
ranked as they are stored in the table 1 from the
best to the worst with δ
C
= 0.05.
IJCCI2013-InternationalJointConferenceonComputationalIntelligence
252
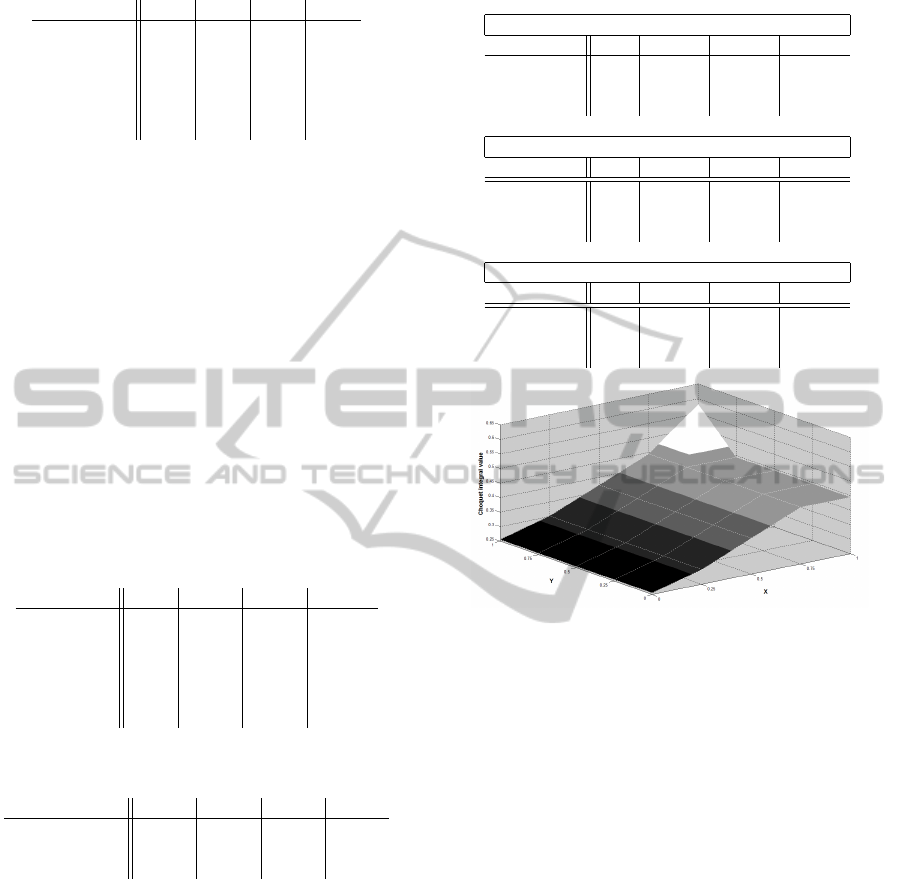
Table 1: Learning batch.
Singularity T X Y C
a 0.75 0.72 0.2 0.93
b 0.41 0.09 0 0.98
c 0.39 0.27 0.24 0.9
d 0.69 0.36 0.8 0.37
e 0.42 0.75 0.32 0.3
f 0.75 0.81 0.52 0.09
• On the importance criterion (S): criteria [µ
t
,µ
c
]
have the same importance, criteria [µ
x
,µ
y
] too and
criteria [µ
t
,µ
c
] are more important than [µ
x
,µ
y
]
(δ
φ
= 0.1): φ
ν
(µ
t
) = φ
ν
(µ
c
) > φ
ν
(µ
x
) = φ
ν
(µ
y
).
• On the influence among criterion (I): criteria
[µ
t
,µ
c
] are in synergy and [µ
x
,µ
y
] too (δ
I
= 0.05):
I
ν
({µ
t
,µ
c
}) > 0 and I
ν
({µ
x
,µ
y
}) > 0.
The results of the Choquet value, the Shapley val-
ues and the interaction indices are respectively pre-
sented in the table 2, 3 and 4. In table2, the sec-
ond column corresponds to values obtained without
any importance( singleton capacity equal to 0.25) and
constraints (other capacity equal to the sum of the sin-
gleton capacities) between criteria.
Table 2: Results for the LP approach for the different con-
straints.
Singularity
/
0 E E+S E+S+I
a 0.65 0.878 0.878 0.873
b 0.37 0.815 0.815 0.799
c 0.45 0.753 0.753 0.738
d 0.55 0.450 0.569 0.593
e 0.46 0.387 0.422 0.532
f 0.49 0.325 0.359 0.471
Table 3: Shapley indices for the different constraints.
Shapley value T X Y C
E 0.152 0.117 0.069 0.662
E+S 0.397 0.074 0.045 0.484
E+S+I 0.322 0.169 0.098 0.411
Imposed Constraints are respected at each steps
(E, E+S,E+S+I). We can see in the table 2 the order
of the singularity is the same as the expert ranking.
The first constraint (based on the elements rank-
ing) accords lot of importance to the contrast (Shap-
ley value φ
ν
(µ
c
) =0.762) and few on the other cri-
teria. Moreover interaction between the criteria [T
C] is negative (that is not corresponding to the expert
choice). The figure 3 shows the variation of the Cho-
quet integral value function of [X Y]. The criterion Y
have few influence except up to 0.75. This translate
an expert view: the singularity position on the width
upgrade the singularity only when it is very close to
the side.
Table 4: Interaction indices for the different constraints
(symmetric matrix).
↓ constraints: E ↓
Interaction T X Y C
T NA 0.006 -0.138 -0.119
X NA 0.131 -0.137
Y NA 0.007
↓ constraints: E+S ↓
Interaction T X Y C
T NA -0.133 -0.090 0.113
X NA 0.179 -0.133
Y NA -0.090
↓ constraints: E+S+I ↓
Interaction T X Y C
T NA -0.219 0.032 0.050
X NA 0.050 -0.285
Y NA -0.226
Figure 3: Influence of the X and Y criteria modification
on the Choquet value with the weights obtained under E
constrain and no variation of the T and C criteria (u =
(0.75,4(X),4(Y ),0.09)).
The addition of the constraint S (on Shapley in-
dices) offers a positive interaction between [T,C] but
not on [X,Y]. Moreover the importance of the criteria
[X,Y] are so little that they have few influence on the
Choquet value. The figure 4 shows the Choquet value
variation function of X and Y variation for a singular-
ity (u = (0.75,4(X),4(Y ),0.09)). The criteria have
no action when theirs values are bellow 0.75. This
comportment means that singularity position is im-
portant only when a singularity is close to the end and
the side of the product.
The addition of the last constraint gives capacities
which allow the respect of the constraints given by
the expert. Moreover all criteria have impact on the
calculation result. The figure5 translates the [X,Y]
impact. Thereafter we use this weight for the product
quality estimation.
WoodPieceQualityEvaluationusingChoquetIntegralandFuzzyMerging
253

Figure 4: Influence of the X and Y criteria modification
on the Choquet value with the weights obtained under E+S
constrains and no variation of the T and C criteria (u =
(0.75,4(X),4(Y ),0.09)).
Figure 5: Influence of the X and Y criteria modification on
the Choquet value with the weights obtained under E+S+I
constrains and no variation of the T and C criteria (u =
(0.75,4(X),4(Y ),0.09)).
4 PRODUCT QUALITY
EVALUATION
Once singularity impacts are determined, an estima-
tion of the quality product is evaluated by merging
these impact and the criterion evaluating the singular-
ity number. In this part, we describe this criterion and
the fusion operation.
4.1 Singularity Number Criterion
In the quality evaluation, the number of singularities
is important. A product with a lot of singularities is
more down grading because the clear wood homo-
geneity is broken.
To evaluate the number, we used the criterion R
nb
defined by (12). This criterion represents the expert
vision: more there are singularities, more the product
is down grading. Moreover when the number reaches
towards a particular value, the criterion reaches to-
wards 0. We choose to used an exponential function.
Following the particular number of singularities fixed
by the expert, the k coefficient can be changed. In
our case we determine that up to 20 singularities, the
value starts to become constant (k=1.1).
u
nb
= k
−(NB
s
)
with k = 1.1 (12)
4.2 Quality Determination by Data
Fusion
In order to determine the quality product, we merge
singularity impacts and the singularity number cri-
terion. There are three kinds of merging operators
(Bloch, 1996):
• The severe operators which satisfy
F(a,b) ≤ Min(a, b)
• The indulgent operators which satisfy
F(a,b) ≥ Max(a, b)
• The compromise operator which satisfy
a ≤ Fa,b ≤ b, if a ≤ b
b ≤ Fa,b ≤ a, if b ≤ a
In the quality evaluation, Expert never evaluates
products on the best singularities. So indulgent oper-
ators cannot be used. The two others operators trans-
late different visions from the expert in the quality
evaluation. We propose to compare different opera-
tors which appear us to be well adapted to the used
and Expert quality evaluation.
The first operator which can be used is the opera-
tor defined by Perez-Orama in (Perez Oramas, 2000)
and describe by 13. This operator (PO) is a compro-
mise operator when the minimum value is under 0.5,
otherwise it is an indulgent operator. This character-
istic can be interesting to isolate product with few sin-
gularities and evaluate the worst product.
F(a,b) = Min(1,
min(a,b)
1 − Min(a,b)
) (13)
The Hamacher operator, described in 14, is a se-
vere operator. That means this operator gives result
under the worst singularity. This can be useful to eval-
uate quality for product where visual quality is very
important (joinery, cabinet, ...) because only products
with high quality are highlighted.
F(a,b) =
ab
a + b − ab
(14)
The Ordered Weight Average(OWA) adapted to
our situation too, described in 15, is a compromised
operator. Usually the product quality is based on a
part of the worst singularities (represented by the α
which represent the percent of product fusion). The
OWA allows to attribute weight only on this part of
the singularities impact C
i
.
F(C
1
,...C
n
) =
n
∑
i=1
w
i
C
i
and C
1
≥ C
2
≥ ... ≥ C
n−1
≥ C
n
with
w
i
= 0, ∀i ∈ [1, bαnc]
w
i
=
1
α∗NB
s
∀i ∈ [dαne, n]
(15)
IJCCI2013-InternationalJointConferenceonComputationalIntelligence
254

The results provided by these three operators will
be compared to the arithmetic mean (used as a bench-
mark) which is a classical operator when the aggrega-
tion comportment is unknown.
4.3 Operators Comparison by the use of
Real Case Study
The proposed methodology is then applied on the
batch described in the table 5. These data is taken
in into our partner sawmill. The first column indi-
cates the piece number, the second the criterion R
nb
(function of the number of singularities), the third, all
the singularities impact present on the product and the
last the product aesthetics class gives by the sawmill
Expert. The aim is to compare some fusion operators
to the expert vision so as to find the closest.
Table 5: Pieces used to compare fusion operators.
Prod R
nb
C
u
Q
a 0.91 0.888 0
b 0.91 0.439 1
c 0.42 0.888 0.866 0.826 0.776 1
0.748 0.746 0.674 0.601
0.520
d 0.75 0.814 0.740 0.259 1
e 0.75 0.888 0.372 0.332 2
f 0.51 0.814 0.740 0.694 0.601 2
0.565 0.432 0.312
g 0.51 0.725 0.667 0.587 0.479 3
0.423 0.372 0.332
• Piece 1: only one singularity with few impact
(value close to 1), used for cabinet work.
• Piece 2: only one singularity with high im-
pact,used for joinery work.
• Piece 3: lot of singularity with few impact, func-
tion of the use, the quality can be high or not
thanks to the singularities number. in our case the
expert class the product for joinery.
• Piece 4 and 5: the same number of singularities
but one with more singularities with few impact
(4) used for joinery work and the other the oppo-
site (5) used in industrial carpentry.
• Piece 6 and 7: more singularities than 4 and 5.
Used respectively in industrial carpentry and tra-
ditional carpentry.
To compare the operators, two features are stud-
ied: the products ranking (cf. table 6) and the dis-
tance between them (cf. figure 6). Operators have
to be compared on the distance between ranked prod-
uct and the products groups they do. If the ranking is
good but groups are totally different from the Expert
choice (two products by in the same aesthetic class
on the Expert judgement have to be close one to the
other) the operator is less efficient than an operator
which wrong ranks but keeps the right group of prod-
ucts.
Table 6: Piece ranking for each fusion operator.
Rank Exp Hama OWA OWA PO Mean
(α =.2) (α =.8)
1 a a (.82) a (.89) a(.90) a (1) a (.90)
2 b b (.42) c (.47) b(.67) b (.43) c (.71)
3 c c (.05) b (.44) c(.66) c (.43) b (.67)
4 d e (.04) f (.37) d(.64) e (.31) d (.64)
5 e c (.0) g (.35) e(.59) g (.31) e (.59)
6 f f (.0) e (.33) f(.55) f (.29) f (.58)
7 g g (.0) d (.26) g(.48) d (.23) g (.51)
The Hamacher operator, as it is the only pessimist
operator, gives the lowest results. This operator his
very efficient to highlight product which have good
features. When there is a lot of singularities, this oper-
ator reaches towards highly downgrade product (up to
2 singularities, maximum value is 0.5). Three groups
of product are made: (a,b) on the top as the expert,
(e,d) and (c,f,g) on the low. These seconds two groups
mix quality product express by the Expert.So this op-
erator is useful to evaluate high quality products.
The Perez-Orama operator gives high importance
to product with all singularity impacts up to 0.5 and
downgrade the others. It assumes that products with
less than 8 singularities with an impact up to 0.5, have
a quality equal to 1. This operator is particularly use-
ful for a first ranking and extracts products described
above (less than 8 singularities with impact up to 0.5).
The operator place on opposite ends a and d and does
two groups, (b,c) and (e,f,g). This classification is
close to the expert choice (apart for d). This opera-
tor is efficient to class low quality products.
The α factor in the OWA operator may change
value. We propose to compare α = 0.2 and α = 0.8.
In the α = 0.2 case, the ranking gives, as the PO op-
erator, four classes ((a),(c,b),(e,f,g,) and (d)) and the
same observation as the previous operator. In the
α = 0.8 case, the ranking is the same than the ex-
pert one. Moreover, product groups provided by this
operator are the same than the expert classification
((a),(b,c,d),(e,f),(g)). Classes are close to one another
but allowed to classify product as the expert estima-
tion. The Expert which choose this ranking should
have a decision process following this vision.
The last is the mean operator. It gives differ-
ent ranking than the expert ranking but the products
groups are respected. This operator may be used to
group product with the same features without respect
the ranking. This behaviour is interesting for carpen-
try product for which the ranking is not important.
WoodPieceQualityEvaluationusingChoquetIntegralandFuzzyMerging
255
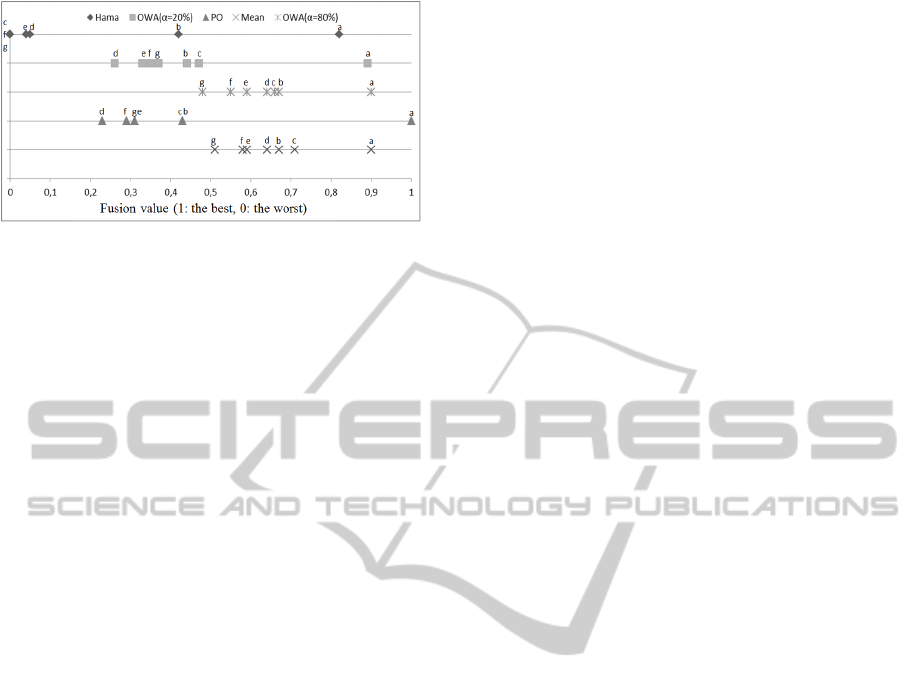
Figure 6: Product ranking for each operator.
5 CONCLUSIONS
In this article, we present a way to determine the prod-
uct quality in the wood industry. We decided to base
the product quality evaluation on the singularities im-
pact. As the information used to determine the sin-
gularity impact and the quality product are uncertain,
imprecise, imperfect, we have to use operators which
take into account of them.
The singularity impact is evaluated on criteria
which are linked by interaction. Moreover, the poor-
ness of the sample and the knowledge on the process
decision, lead us to use the Choquet integral to de-
termine impact. The quality determination is done by
merging the singularity impact and the number of sin-
gularities. The use of different operators allows us
to cover the majority of cases concerning the prod-
uct quality determination. The comparison with the
expert ranking and classification allows to conclude
OWA operator with α = 0.8 reflects his choice.
This quality have a virtual nature. Moreover it is
expressed with a regression value while Experts use
linguistics quality classes. To take into account the
virtual nature and the linguistics class representation,
a fuzzyfication step may be used to obtain the belong-
ing to quality classes as expressed by Expert.
All of that allows to conclude to the pertinence of
our proposition. In perspective, other decision ways
will be used and in particular the evaluation of the
quality from the singularity characteristics (only one
step). To do so, other fusion operators will be used as
the Fuzzy Rule Classifier or classification operators.
ACKNOWLEDGEMENTS
The authors gratefully acknowledge the financial sup-
port of the CPER 2007-2013 Structuration du P
ˆ
ole de
Comp
´
etitivit
´
e Fibres GrandEst (Competitiveness Fi-
bre Cluster), through local (Conseil G
´
en
´
eral des Vos-
ges), regional (R
´
egion Lorraine), national (DRRT and
FNADT) and European (FEDER) funds.
REFERENCES
Almecija, B., Bombardier, V., and Charpentier, P. (2012).
Modeling quality knowledge to design log sorting sys-
tem by x rays tomography. In Information Control
Problems in Manufacturing, volume 14, pages 1190–
1195.
Bloch, I. (1996). Information combination operators for
data fusion: A comparative review with classification.
Systems, Man and Cybernetics, Part A: Systems and
Humans, IEEE Transactions on, 26(1):52–67.
Bombardier, V., Mazaud, C., Lhoste, P., and Vogrig, R.
(2007). Contribution of fuzzy reasoning method to
knowledge integration in a defect recognition system.
Computers in industry, 58(4):355–366.
Bucur, V. (2003). Techniques for high resolution imaging of
wood structure: a review. Measurement Science and
Technology, 14(12):R91.
Choquet, G. (1953). Theory of capacities. In Annales de
l’institut Fourier, volume 5, page 87.
Dupuy, C. (2004). Analyse et conception d’outils
pour la trac¸abilit
´
e de produits agroalimentaire afin
d’optimiser la dispersion des lots de fabrication. PhD
thesis, Institue National des Sciences Appliqu
´
ees de
lyon.
Grabisch, M., Kojadinovic, I., and Meyer, P. (2008). A re-
view of methods for capacity identification in choquet
integral based multi-attribute utility theory: Applica-
tions of the kappalab r package. European journal of
operational research, 186(2):766–785.
Grabisch, M. and Labreuche, C. (2008). A decade of ap-
plication of the choquet and sugeno integrals in multi-
criteria decision aid. 4OR: A Quarterly Journal of Op-
erations Research, 6(1):1–44.
Guillot, J., Lanvin, J., and Sandoz, J. (1996). Classement
structure du sapin/
´
epic
´
ea par r
´
eseaux neuronaux
`
a par-
tir des mesures sylvatest. In Sciences et industries du
bois. Colloque, pages 377–384.
Jover, J., Thomas, A., and Bombardier, V. (2011). Mar-
quage du bois dans la masse : int
´
er
ˆ
ets et perspectives.
In 9e Congr
`
es International de G
´
enie Industriel, CIGI
2011, St Sauveur, Canada.
Marichal, J.-L. and Roubens, M. (2000). Determina-
tion of weights of interacting criteria from a refer-
ence set. European journal of operational Research,
124(3):641–650.
PEFC1 (2010). Pefc st 1003:2010: Sustainable forest man-
agement.
Perez Oramas, O. (2000). Contribution une m
´
ethodologie
d’int
´
egration de connaissances pour le traitement
d’images. Application
`
a la d
´
etection de contours par
r
´
egles linguistiques floues. PhD thesis, universit
´
e
Henry Poincar
´
e.
Todoroki, C. and R
¨
onnqvist, M. (2002). Dynamic control
of timber production at a sawmill with log sawing op-
timization. Scandinavian Journal of Forest Research,
17(1):79–89.
IJCCI2013-InternationalJointConferenceonComputationalIntelligence
256
