
Morphological ECG Analysis for Attention Detection
Carlos Carreiras
1
, Andr
´
e Lourenc¸o
1,2
, Helena Aidos
1
, Hugo Silva
1
and Ana Fred
1
1
Instituto de Telecomunicac¸
˜
oes, Instituto Superior T
´
ecnico, Lisbon, Portugal
2
Instituto Superior de Engenharia de Lisboa, Lisbon, Portugal
Keywords:
Physiological Computing, Attention, ECG, EEG, Unsupervised Learning, Cluster Validation.
Abstract:
The electroencephalogram (EEG) signal, acquired on the scalp, has been extensively used to understand cog-
nitive function, and in particular attention. However, this type of signal has several drawbacks in a context
of Physiological Computing, being susceptible to noise and requiring the use of impractical head-mounted
apparatuses, which impacts normal human-computer interaction. For these reasons, the electrocardiogram
(ECG) has been proposed as an alternative source to assess emotion, which is also continuously available,
and related with the psychophysiological state of the subject. In this paper we present a study focused on the
morphological analysis of the ECG signal acquired from subjects performing a task demanding high levels of
attention. The analysis is made using various unsupervised learning techniques, which are validated against
evidence found in a previous study by our team, where EEG signals collected for the same task exhibit distinct
patterns as the subjects progress in the task.
1 INTRODUCTION
Standard methods for communication between hu-
mans and computing systems, using a keyboard and
mouse, or a touch screen, provide a very limited in-
formation bandwidth when compared to the richness
of the user’s psychophysiological state (Fairclough,
2009). Indeed, in natural human communication, the
speaker’s attitude, posture, tone, and facial expres-
sions, among others, strongly influence the semantic
interpretation done by the receiver (Pell et al., 2011).
These characteristics are often related with the emo-
tional state of the speaker, adding an extra layer of
information that a computer cannot yet easily under-
stand. The integration of this psychophysiological in-
formation into computer systems, by continuous, real-
time monitoring of the user, is known as Physiological
Computing (Fairclough, 2009).
Straightforward approaches to physiological com-
puting, requiring no extra hardware, are, for example,
keystroke dynamics (Epp et al., 2011), speech anal-
ysis (Murray and Arnott, 1993), and automatic facial
expression recognition (Zheng et al., 2006). However,
all these examples exhibit serious problems to their
usefulness. Keystroke dynamics requires continuous
typing, speech analysis requires continuous speech, in
addition to disclosing sensitive and/or private infor-
mation to possible eavesdroppers, and a facial expres-
sion is a vague concept to be described objectively,
with its usefulness for behavioral science being ques-
tioned in (Aviezer et al., 2012). One possible alter-
native to these modalities, although requiring extra
hardware, is the use of the subject’s biosignals (e.g.
electrodermal activity, peripheral temperature, blood
volume pulse, electrocardiogram, electroencephalo-
gram signals), acquiring them during normal human-
computer interaction tasks (Canento et al., 2011; Silva
et al., 2012). These signals have the twofold advan-
tage of being always available, and measuring the nat-
ural physiological responses of the body to a given
affective state, which cannot be voluntarily masked.
The electroencephalogram (EEG) signal, acquired
on the scalp, has been extensively used to understand
cognitive function, and in particular emotion (Ahern
and Schwartz, 1985; Coan and Allen, 2007), being a
noninvasive, cost-effective technique, with good tem-
poral resolution (Mak and Wolpaw, 2009). However,
it has various drawbacks, such as susceptibility to
noise (in particular motion artifacts and eye blinks)
and, most importantly, requires the use of some kind
of head-mounted equipment to support the (typically
wet) electrodes, which becomes impractical for con-
tinued use. In this context, the electrocardiogram
(ECG) signal has been suggested as a possible option
(Medina, 2009; Belle et al., 2010). Nevertheless, the
usefulness of the EEG as source of ground-truth in-
381
Carreiras C., Lourenço A., Aidos H., Plácido da Silva H. and Fred A..
Morphological ECG Analysis for Attention Detection.
DOI: 10.5220/0004554403810390
In Proceedings of the 5th International Joint Conference on Computational Intelligence (NCTA-2013), pages 381-390
ISBN: 978-989-8565-77-8
Copyright
c
2013 SCITEPRESS (Science and Technology Publications, Lda.)
formation has not been discarded (Belle et al., 2012).
In this paper, we make a morphological analy-
sis, using unsupervised learning techniques, of the
ECG acquired from subjects performing a task that
demands high levels of attention over a long period
of time. This experiment simulates what may happen,
for instance, during an interactive educational game,
extended work hours, repetitive daily tasks, or sleep
deprivation, where attention levels fluctuate through-
out the execution of the task. This is particularly im-
portant in various professions, such as doctors, pilots,
drivers or industrial equipment operators, for which
momentary or prolonged lapses of attention may be
catastrophic (Belle et al., 2012). In addition, we com-
pare the results obtained with the ECG signal to our
previous work using the EEG, which provided evi-
dence that the subjects indeed exhibit distinct affec-
tive states throughout the completion of the task (Car-
reiras et al., 2013).
The remainder of the paper is organized as fol-
lows: Section 2 describes the experimental setup.
Section 3 details the proposed methodology, includ-
ing the description of the clustering methods used,
as well as several clustering validation metrics. Sec-
tion 4 presents the obtained results, which are dis-
cussed in Section 5. Finally, Section 6 concludes the
paper.
2 AFFECTIVE ELICITATION
AND DATA ACQUISITION
The ECG signal presents several attributes that make
it especially interesting in a physiological comput-
ing framework. Specifically, it is continuously avail-
able, providing a rich wellbeing indicator, is related
with the psychophysiological state of the subject, and
is easy to acquire unobtrusively with wearable de-
vices. This is further enhanced by following an off-
the-person approach, where the sensors are seam-
lessly integrated into objects with which subjects reg-
ularly interact, such as a keyboard, a video game con-
troller, or a mobile device, without the need to change
normal interaction patterns (Silva et al., 2011).
It is widely known that the basic function of the
heart is to pump blood throughout the body, de-
manding a highly synchronized sequence of muscu-
lar contractions. These contractions are initiated by
small electrical currents that propagate through the
heart’s muscle cells, generating an electrical signal
that can be recorded at the body surface (the ECG).
In healthy individuals, the electrical activity of the
heart is guided by the self-excitatory nature of the
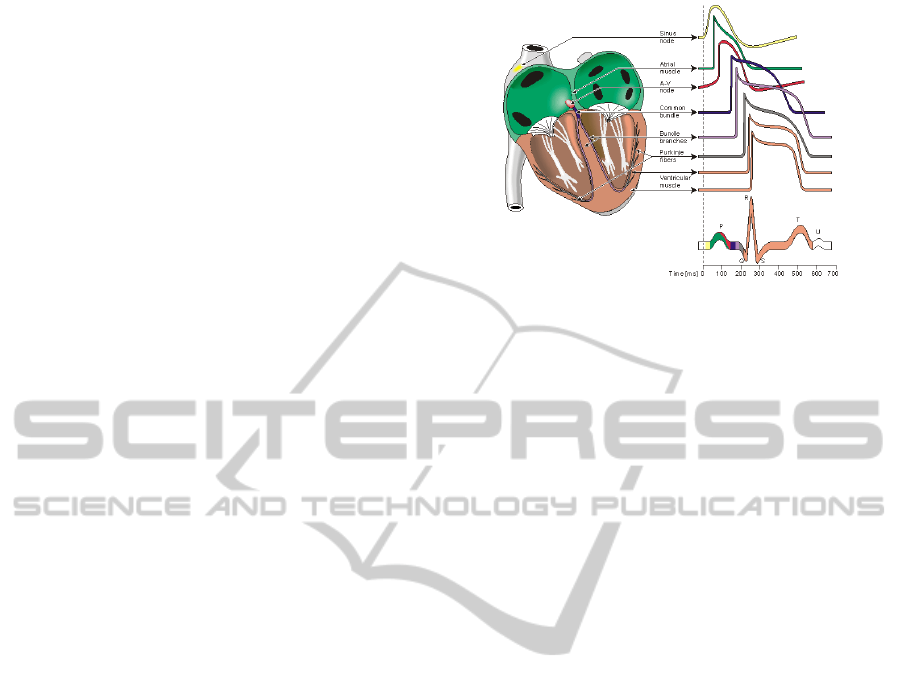
sinus node on the left atrium (see Figure 1), which
Figure 1: Schematic representation of the heart compart-
ments and its electric system, showing the contribution
of each component to the prototypical heartbeat signal
recorded at the body surface (used with permission from
(Malmivuo and Plonsey, 1995)).
naturally produces electrical depolarizations at a rate
of about 100 beats per minute. However, the si-
nus node is under systemic control by the endocrine
system and the Autonomic Nervous System (ANS).
The ANS is composed by two complementing, self-
balancing subsystems, the Sympathetic and Parasym-
pathetic Nervous Systems (SNS and PSNS, respec-
tively). While the SNS is typically responsible for the
promotion of fight-or-flight responses in the organism
(e.g. by increasing the heart rate), the PSNS is respon-
sible for the promotion of rest-and-digest responses,
which induce relaxation and a return to normal func-
tion. As a whole, the ANS provides an access route
to the affective state of a person (Levenson, 1992), by
analyzing the patterns of physiological activity initi-
ated by both the SNS and PSNS. In particular for the
ECG, the amplitude and latency of the P-QRS-T com-
plexes is influenced by multiple psychophysiological
factors, and some changes in the user’s behavior re-
sult in slight variations in the heart rate and waveform
morphology.
The ECG and EEG signals analyzed here were ac-
quired in the context of the HiMotion project (Gam-
boa et al., 2007), an experiment to acquire informa-
tion related to human-computer interaction and phys-
iological signals on different cognitive activities. Dur-
ing the experimental session, the subjects were asked
to execute various interactive cognitive tasks. Partic-
ularly, a concentration task was performed, adapted
from a similar test from the MENSA set (Fulton,
1999). In this test, the subject is presented with a
matrix of 800 integers (20 lines by 40 columns), as
shown in Figure 2. The goal of the game is to iden-
tify, line by line, all the pairs of consecutive numbers
that add to 10. This task requires high levels of atten-
tion, as the pairs may overlap (i.e. the same number
IJCCI2013-InternationalJointConferenceonComputationalIntelligence
382

may belong to two pairs), measuring the capacity of
the subject to maintain an attentive state over a long
period of time.
Figure 2: Example matrix of the concentration test; the user
selects, line by line, the pairs of consecutive numbers that
add to 10.
Biosignal data was obtained from 24 subjects (17
males and 7 females) with ages in the range 23.3±2.4
years, using a Thought Technology ProComp2 acqui-
sition system, with a sampling rate of 256 Hz. The
ECG was acquired with Ag/AgCl electrodes placed
on the chest (4th intercostal space in the mid clavic-
ular line), while the EEG was acquired at four scalp
locations according to the 10-20 system (F
p1
, F
z
, F
p2
,
and O
z
), as shown in Figure 3.
Figure 3: Locations of the acquired EEG electrodes on the
scalp (red).
3 PROPOSED METHODOLOGY
It should be noted that each person has different char-
acteristics in terms of attention span and, as such,
aside from the temporal information regarding the
start and the end of each line of the attention game, no
more information is available for this data set. Partic-
ularly, there is no ground-truth information regarding
the time instants in which the affective state of each
test subject has really changed. For this reason, we
propose the use of unsupervised learning techniques
to analyze the ECG data.
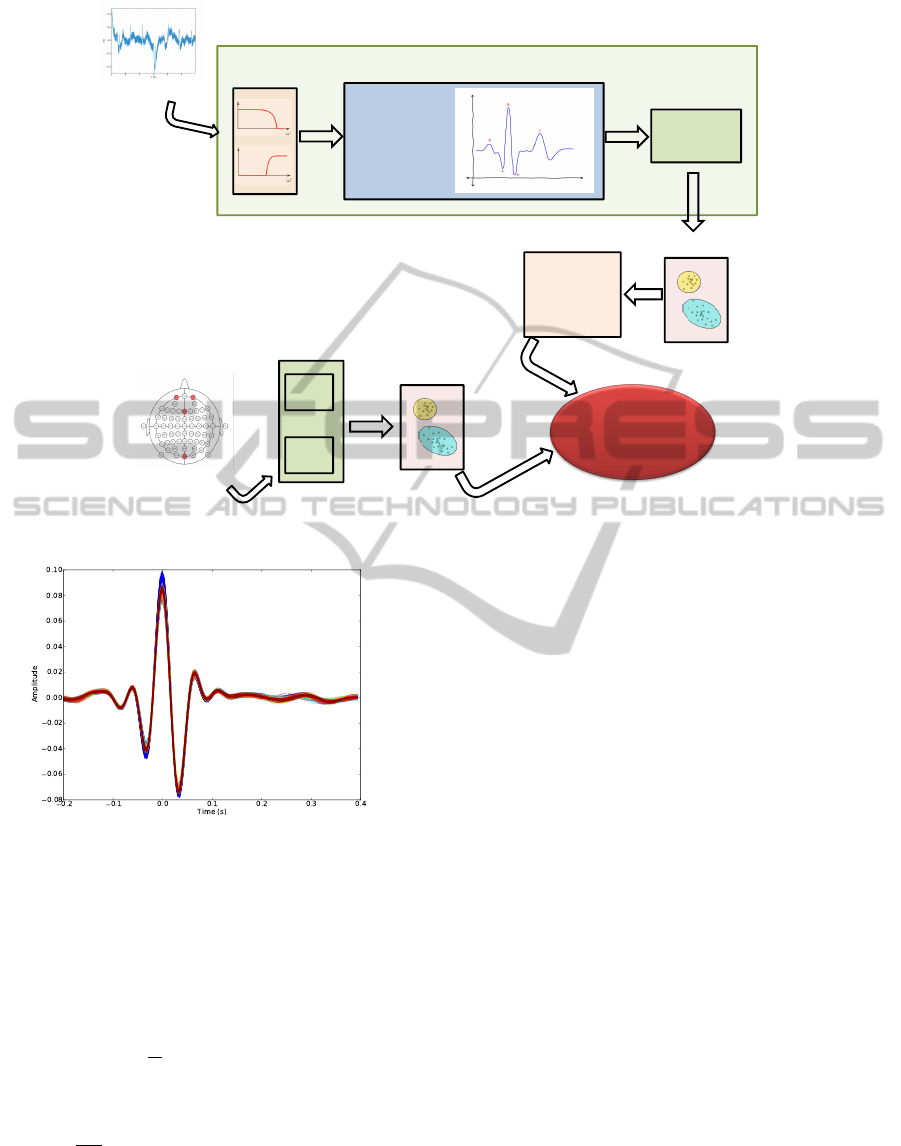
The proposed methodology is presented in Fig-
ure 4 and it is divided in three main stages: feature
extraction, clustering, and validation of the cluster-
ing results. We start by filtering and segmenting the
raw ECG, and then we apply clustering techniques to
analyze the data. Subsequently, the results of those
clustering algorithms are validated using several met-
rics, exploiting our previous analysis of the same
data set with the EEG signal (Carreiras et al., 2013).
This somewhat follows the methodology proposed in
(Belle et al., 2012), where the EEG signal is used as
a benchmark against which the performance of atten-
tion recognition via the ECG is compared. All these
stages are explained in the following subsections.
3.1 ECG Feature Extraction
Raw ECG signals are typically affected by various
noise sources such as motion artifacts, power line in-
terference, and electromyographic noise. To enhance
the signal-to-noise ratio (SNR), and to reduce the in-
fluence of the cited noise sources, we used a band-
pass Finite Impulse Response (FIR) filter with a Ham-
ming window of 300ms, and cutoff frequencies of
5 −20 Hz. The filtered signal was then fed to a seg-
mentation algorithm, with the purpose of identifying
the locations of the R peaks. For that we used the
algorithm by Engelse and Zeelenberg (Engelse and
Zeelenberg, 1979), with the modifications proposed
in (Canento et al., 2013). Individual heartbeat seg-
ments of 600 ms were extracted from the filtered sig-
nal, between 200ms before and 400 ms after the R
peak. Finally, in order to further improve the SNR,
heartbeat templates were formed using sequences of 5
consecutive heartbeats, computing their element-wise
mean (an example of these templates can be seen in
Figure 5). These templates form the feature space
used by the clustering algorithms, described in Sec-
tion 3.3.
3.2 EEG Feature Extraction
Our previous work, focusing on the EEG signal, is
based on two distinct feature extraction techniques.
The first follows the traditional approach of analyz-
ing the various EEG frequency bands, the Band Power
Features (BPF). Specifically, we used the theta (from
4 to 8 Hz), lower alpha (from 8 to 10 Hz), upper al-
pha (from 10 to 13 Hz), beta (from 13 to 25 Hz), and
gamma (from 25 to 40 Hz) bands. The second ap-
proach uses a method of synchronization quantifica-
MorphologicalECGAnalysisforAttentionDetection
383
EEG data
BPF
PLF
Feature
Extraction
ECG data
Filtering
Feature Extraction
Segmentation
Algorithm by
Engelese with
some
modifications to
identify R peaks
Means of 5
heartbeats
Clustering
Clustering
Clustering
External
Validation
using EEG
Choose a
representative
cluster for
each line
Post-process
Figure 4: The proposed methodology.
Figure 5: ECG templates obtained for subject 11.
tion, the Phase-Locking Factor (PLF), which lever-
ages the fact that EEG signals exhibit an oscillatory
behavior whose phase dynamics are modulated by the
neurological tasks (Pfurtscheller and Lopes da Silva,
1999). The PLF between two signals is defined as
(Almeida et al., 2009):
ρ
ik
=
1
T
T
∑
n=1
e
j(φ
i
[n]−φ
k
[n])
, (1)
where φ
i
[n] and φ
k
[n], n = 1, ..., T are the phases of
the signals, T is the number of discrete time samples,
and j =
√
−1 is the imaginary unit. This measure
ranges from 0 to 1, with a value of ρ
ik
= 1 corre-
sponding to perfect synchronization between the two
signals (constant phase lag), while the value ρ
ik
= 0
corresponds to no synchronization. These two feature
extraction methods form distinct feature spaces, upon
which clustering methods were applied.
3.3 Unsupervised Learning
3.3.1 Clustering
Clustering is one of the central problems in Pattern
Recognition and Machine Learning. Hundreds of
clustering algorithms exist, differently handling is-
sues such as cluster shape, density, and noise, among
other aspects. These techniques require the definition
of a similarity measure between patterns, be it geo-
metrical or probabilistic, which is not easy to specify
in the absence of any prior knowledge about cluster
shapes and structure.
One of the classical approaches for clustering is
the use of hierarchical agglomerative algorithms (Jain
and Dubes, 1988), which produce a tree of nested
objects (the dendrogram) that establishes the hierar-
chy between the clusters. These methods only re-
quire a measure of (dis)similarity and a linkage cri-
terion between instances, while partitional methods
(e.g. k−means or k−medoids) also require a pri-
ori the number of clusters, and an initial assignment
of data to clusters. The linkage criterion allows to
chose how to define intergroup similarity. In partic-
ular, we apply the Average Link (AL) and Ward’s
Linkage (WL) criteria (Theodoridis and Koutroum-
bas, 1999). Furthermore, to obtain a partition of the
IJCCI2013-InternationalJointConferenceonComputationalIntelligence
384

data from a dendrogram, we use the largest lifetime
criterion (Fred and Jain, 2002).
Moreover, we use a new high order dissimilarity
measure, called dissimilarity increments, proposed by
(Fred and Leit
˜
ao, 2003). This measure is computed
over triplets of nearest neighbor patterns and is de-
fined as:
d
inc
(x
i
, x
j
, x
k
) = |D
∗
(x
i
, x
j
) −D
∗
(x
j
, x
k
)|, (2)
where x
j
is the nearest neighbor of x
i
, and x
k
is the
nearest neighbor of x
j
, different from x
i
. In equation
(2), D
∗
(·, ·) can be any dissimilarity measure, such as
the Euclidean distance. The dissimilarity increments
measure can give more information about patterns be-
longing to the same cluster, since it changes smoothly
if the patterns are in the same cluster. In (Aidos and
Fred, 2011), an agglomerative hierarchical algorithm,
called SLDID, was proposed. This algorithm is a vari-
ant of the Single Link (SL) criterion using the dissim-
ilarity increments distribution (DID), which was de-
rived under mild approximations in (Aidos and Fred,
2012), to modify the way that clusters are merged.
In this paper we used a family of DID algorithms:
ALDID and WLDID. They are variants of the tradi-
tional hierarchical clustering algorithms AL and WL,
respectively. The main difference between AL and
ALDID is that in AL, in each iteration the pair of
clusters with the highest cohesion is always merged;
in ALDID some tests are made using the minimum
description length (MDL) criterion between two pos-
sibilities. These two possibilities consist in the DID
of the two clusters combined, and the DID of the two
clusters separated. One advantage in using an algo-
rithm from this family is that it stops merging clusters
before all the data is merged into one cluster, reveal-
ing intrinsic cluster structure in the data when the true
number of clusters is unknown.
3.3.2 Consensus Clustering
Consensus clustering, also known as Clustering com-
bination, is a powerful technique that combines the
information of multiple clustering partitions, form-
ing a clustering ensemble (P), and creating a con-
sensus partition that leverages the results of individ-
ual clustering algorithms. Recent surveys present an
overview on this research topic (Ghosh and Acharya,
2011; Vega-Pons and Ruiz-Shulcloper, 2011). One of
the significant approaches is the Evidence Accumu-
lation Clustering (EAC) (Fred and Jain, 2005). This
framework is based on the aggregation of object co-
occurences, and the consensus partition is obtained
through a voting process among the objects. Specif-
ically, the consensus clustering problem is addressed
by summarizing the information of the ensemble into
a pairwise co-association matrix, where each entry
holds the fraction of clusterings in the ensemble in
which a given pair of objects is placed in the same
cluster:
C (i, j) =
n
i j
N
, i, j ∈ 1, . . . , N. (3)
For the construction of the ensemble, we use the
k-means algorithm (Jain and Dubes, 1988) with dif-
ferent parameters and initializations. We created a
set of N = 100 partitions
1
by randomly choosing the
number of clusters, following the work by (Lourenc¸o
et al., 2010) where the minimum and maximum num-
ber of clusters per partition depends on the number of
objects n, and is bound to the interval [
√
n
2
,
√
n].
The extraction of the consensus partition can
be performed using several approaches based on
the induced co-association matrix: i) as a new
(dis)similarity-based representation of objects, where
the intrinsic structure of the data is enhanced through
the evidence accumulation process, enabling the de-
termination of the consensus partition using algo-
rithms that explicitly use similarities as input, such
as hierarchical linkage methods (as classically per-
formed in (Fred and Jain, 2005)); ii) as a new vector-
based object description, considering each line of the
matrix a new feature vector representation, and us-
ing it as input to a clustering algorithm such as the
k-means (Kuncheva and Vetrov, 2006); iii) as a new
probabilistic distribution characterized by the prob-
ability of pairs of objects being in the same cluster
(Lourenc¸o et al., 2013).
3.3.3 Application to EEG and ECG
The focus of this work was the unsupervised analy-
sis of the ECG signals, and for that we applied all the
described techniques: i) hierarchical agglomerative
algorithms; ii) hierarchical agglomerative algorithms
with dissimilarity increments; iii) consensus cluster-
ing based on evidence accumulation clustering, us-
ing as extraction criterion the average linkage method
with the number of clusters automatically determined
by the life-time criterion.
The clustering of the ECG heartbeats was per-
formed over the means of 5 consecutive heartbeats.
Since we are willing to compare these partitions with
the ones obtained on the context of EEG, where for
each line of the test there is only one cluster, it
was necessary to post-process the obtained partitions,
choosing as representative cluster for each line the
one with highest cardinality (largest time span).
1
This is the number typically proposed in the reference
literature.
MorphologicalECGAnalysisforAttentionDetection
385

In the context of EEG clustering, we applied the
hierarchical agglomerative methods with and without
dissimilarity increments.
3.4 Cluster Validation
Cluster validation techniques have been developed to
guide the design of clustering experiments and to as-
sess the quality of the outcome. There are three types
of cluster validity measures (Dubes and Jain, 1979;
Halkidi et al., 2001; Meil
˘
a, 2007; Ben-Hur et al.,
2002; Luo et al., 2009): i) External: used to measure
the goodness of a clustering structure with respect to
external information; ii) Internal: used to measure
the goodness of a clustering structure without supply-
ing any class labels; and iii) Relative: used to com-
pare different clusterings.
We adopt an external clustering validation per-
spective, using as external source of information the
clusterings obtained with the EEG. There is a long
list of external validation indices proposed in the lit-
erature (Meil
˘
a, 2007; Fowlkes and Mallows, 1983;
Ben-Hur et al., 2002; Dom, 2001), which can be
categorized as follows: i) Counting Pairs Methods:
a class of criteria based on counting the pairs of
points on which two clusterings agree/disagree, Wal-
lace (Wallace, 1983), Fowlkes and Mallows (Fowlkes
and Mallows, 1983), and Rand’s (Rand, 1971) are the
most representatives of this class; ii) Set Matching:
based on set matching cardinality, H criterion (Meil
˘
a,
2007), and consistency index (Ci) (Fred, 2001; Duarte
et al., 2011) are representative of this class; iii) In-
formation Theoretic: based on information theoretic
concepts (entropy and mutual information); represen-
tatives of this class of criteria are the Variation of In-
formation (VI) index (Meil
˘
a, 2007) and Dom’s index
(Dom, 2001)
In this work, we compare the partitions obtained
with the ECG with the ones obtained with the EEG
(taken as ground-truth), and following the idea pro-
posed in (Belle et al., 2012). We use indices of the
three categories, to verify the consistency of the re-
sults in several perspectives, namely: Rand (Rand,
1971), a modified version of the Consistency Index
entitled Average Cluster Consistency (ACC) (Duarte
et al., 2011), and VI (Meil
˘
a, 2007). All the three in-
dices take values between 0 and 1. Rand’s index and
the ACC take the value 1 for a perfect match between
partitions, and for the VI index, 0 corresponds to a
perfect match.
Figure 6: Clustering obtained for subject 11, using the clus-
tering combination method, where each color represents a
cluster, with a total of 8 clusters; Bck denotes the back-
ground color of the matrix.
4 EXPERIMENTAL RESULTS
Figure 6 exemplifies the clustering of the ECG tem-
plates obtained for one of the subjects, using the clus-
tering combination (CC) method. It shows, for each
line of the concentration task, the clusters to which
the templates in that line belong to. The first observa-
tion to note is that the lines are not characterized by a
single cluster, but rather by two or three clusters that
alternate between them. However, it is possible to per-
ceive the existence of different groups of lines. In this
particular case, lines 0 to 2 are mainly composed by
clusters 1, 2, and 3, lines 4 to 7 are composed by clus-
ters 7 and 8, and the remaining lines are composed by
clusters 4, 5, and 6. Another interesting note is the
fact that the number of templates per line decreases
throughout the completion of the task, implying that
the first few lines of the task take longer to complete
than the last lines. These observations are valid for
the majority of the subjects, although the number of
clusters and their distribution differs from subject to
subject, forming different groups of lines.
Inter-subject variability is evidenced in Figure 7,
where the clustering obtained, across all subjects,
with the EEG (using PLF features and ALDID clus-
tering – Figure 7(a)) is compared to the clustering
obtained with the ECG (using CC clustering – Fig-
ure 7(b)). Remember that, in the case of the ECG,
each line is represented by the most frequent cluster
in that line. It is possible to observe that the ECG
produces a higher number of clusters than the EEG,
where each cluster tends to form groups of contigu-
ous lines. Contrastingly, in the ECG it is frequent to
have transitions to clusters seen in previous lines.
The results of the cluster validation are shown in
Tables 1, 2, and 3 for the Average Cluster Consistency
IJCCI2013-InternationalJointConferenceonComputationalIntelligence
386
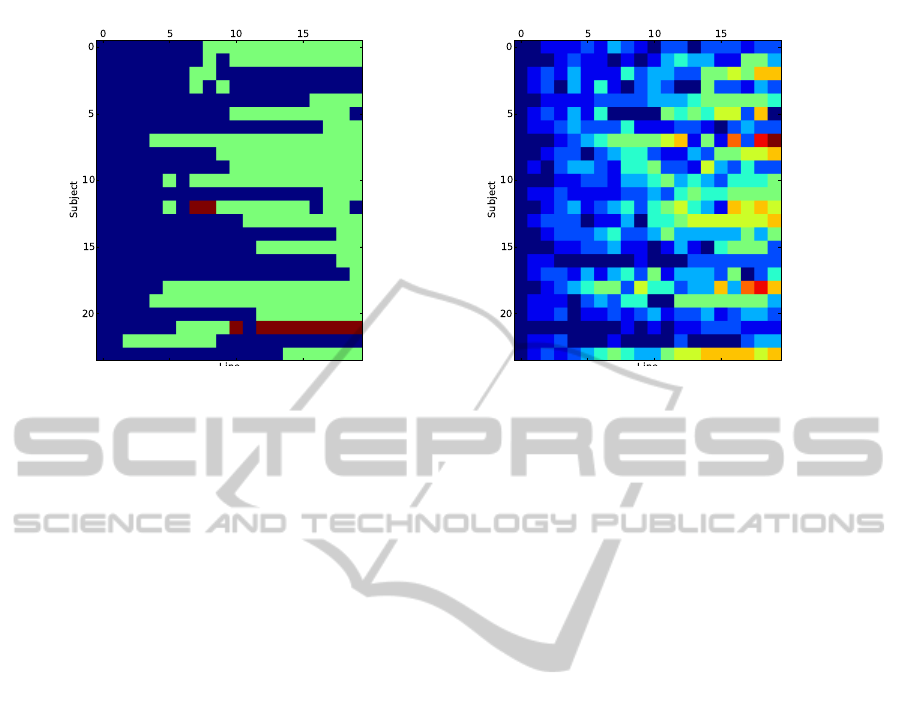
(a) EEG clustering (ALDID) using PLF features. (b) ECG clustering (CC).
Figure 7: Comparison of the clustering obtained with the EEG to the one obtained with the ECG, across all subjects; each
color represents one cluster.
(ACC), Variation of Information (VI), and Rand’s in-
dex, respectively. For the ACC criterion, the high-
est agreement is obtained between the ECG clustering
with CC and both the EEG clustering using AL (BPF)
and ALDID (PLF), with a value of 0.79. Regarding
the VI measure, the strongest agreements are seen for
the ECG clustering using the AL algorithm, in partic-
ular with the ALDID method applied to the PLF fea-
tures from the EEG, with a value of 0.20. Concerning
Rand’s index, the highest value, 0.63, is obtained be-
tween the ECG clustering through CC with the EEG
clustering using WLDID (BPF).
5 DISCUSSION
Our work addresses the following questions: i) “Is
ECG morphological analysis capable of identifying
affective states throughout the realization of a task
that demands a high attention span?”; ii) “Are the
obtained states related to the ones found while ana-
lyzing EEG data?”; and iii) “What techniques can be
considered to be more suitable for the analysis of the
ECG?”
The validation of the partitions found using ECG,
when considering the EEG partitions as ground-truth,
shows that there is evidence of correlation between
them, revealing that ECG can be used to infer affec-
tive states. The ECG partitions have a much higher
number of partitions than the EEG ones, leading
to distinct results over the various validation crite-
ria (considering the different perspectives), associated
with moderate to high matching. This was mainly due
to small variations over time of the ECG heartbeats,
that lead to slow time transitions between the different
clusters.
The clustering technique that presents the best re-
sults varies depending on the validation index. When
considering the average cluster consistency (ACC),
the consensus clustering (CC) obtains partitions that
lead to a best match; when using variation of infor-
mation (VI) criterion, the Average Link (AL) method
is the one that leads to best match; and when using
the Rand’s index there is not a method which can be
considered a clear winner. The situations with best
results are partitions with high number of clusters,
which correspond to Average linkage and Consensus
Clustering.
6 CONCLUSIONS
In this work we present a methodology for atten-
tion detection based on the morphological analysis of
ECG signals, using data collected during the course
of a task requiring a high level of attention span. We
compare the ECG morphology results with the anal-
ysis performed using the EEG. This comparison was
accomplished using clustering validation indices.
The ECG analysis was divided into several steps.
For the feature extraction step, the signal was first dig-
itally filtered, segmented based on the peaks found by
a modification of the Engelse and Zeelenberg algo-
rithm, and templates were formed using means of 5
consecutive heart beats. For the clustering step, sev-
eral state of the art techniques were used, since the
ECG heartbeats have very small variations over time,
leading to touching clusters.
MorphologicalECGAnalysisforAttentionDetection
387

Table 1: Cluster validation results (µ ±σ) using the Average Cluster Consistency (ACC) metric; higher values suggest a
stronger agreement.
ECG Clustering
AL WL ALDID WLDID CC
EEG Clustering
AL
PLF 0.70 ± 0.16 0.72 ± 0.17 0.71 ± 0.14 0.73 ± 0.15 0.78 ± 0.16
BPF 0.70 ± 0.15 0.74 ± 0.15 0.70 ± 0.18 0.72 ± 0.17 0.79 ± 0.15
WL
PLF 0.61 ± 0.12 0.65 ± 0.16 0.62 ± 0.11 0.67 ± 0.13 0.76 ± 0.17
BPF 0.68 ± 0.11 0.72 ± 0.14 0.68 ± 0.13 0.70 ± 0.15 0.78 ± 0.15
ALDID
PLF 0.71 ± 0.16 0.73 ± 0.15 0.73 ± 0.14 0.74 ± 0.15 0.79 ± 0.16
BPF 0.55 ± 0.13 0.60 ± 0.16 0.55 ± 0.14 0.60 ± 0.14 0.69 ± 0.14
WLDID
PLF 0.62 ± 0.16 0.66 ± 0.16 0.64 ± 0.14 0.69 ± 0.16 0.77 ± 0.18
BPF 0.51 ± 0.14 0.56 ± 0.14 0.52 ± 0.14 0.57 ± 0.16 0.65 ± 0.15
Table 2: Cluster validation results (µ ±σ) using the Variation of Information (VI) metric; lower values suggest a stronger
agreement.
ECG Clustering
AL WL ALDID WLDID CC
EEG Clustering
AL
PLF 0.21 ± 0.07 0.33 ± 0.13 0.27 ± 0.11 0.34 ± 0.12 0.55 ± 0.11
BPF 0.22 ± 0.09 0.32 ± 0.11 0.28 ± 0.09 0.35 ± 0.14 0.55 ± 0.11
WL
PLF 0.26 ± 0.06 0.36 ± 0.11 0.32 ± 0.08 0.37 ± 0.11 0.54 ± 0.13
BPF 0.21 ± 0.06 0.32 ± 0.11 0.27 ± 0.06 0.35 ± 0.12 0.55 ± 0.11
ALDID
PLF 0.20 ± 0.07 0.32 ± 0.13 0.26 ± 0.11 0.34 ± 0.11 0.55 ± 0.11
BPF 0.34 ± 0.10 0.40 ± 0.13 0.38 ± 0.09 0.43 ± 0.12 0.55 ± 0.10
WLDID
PLF 0.25 ± 0.08 0.36 ± 0.12 0.31 ± 0.10 0.36 ± 0.12 0.55 ± 0.11
BPF 0.35 ± 0.10 0.42 ± 0.12 0.40 ± 0.09 0.45 ± 0.11 0.56 ± 0.09
Table 3: Cluster validation results (µ ±σ) using Rand’s metric; higher values suggest a stronger agreement.
ECG Clustering
AL WL ALDID WLDID CC
EEG Clustering
AL
PLF 0.59 ± 0.15 0.59 ± 0.14 0.59 ± 0.12 0.54 ± 0.10 0.49 ± 0.11
BPF 0.58 ± 0.16 0.56 ± 0.12 0.54 ± 0.13 0.57 ± 0.11 0.50 ± 0.14
WL
PLF 0.49 ± 0.10 0.54 ± 0.11 0.50 ± 0.08 0.54 ± 0.09 0.57 ± 0.08
BPF 0.56 ± 0.11 0.57 ± 0.13 0.52 ± 0.06 0.55 ± 0.08 0.51 ± 0.11
ALDID
PLF 0.61 ± 0.16 0.59 ± 0.14 0.60 ± 0.13 0.53 ± 0.11 0.48 ± 0.12
BPF 0.42 ± 0.13 0.55 ± 0.13 0.44 ± 0.10 0.53 ± 0.11 0.61 ± 0.10
WLDID
PLF 0.51 ± 0.14 0.55 ± 0.11 0.52 ± 0.12 0.54 ± 0.13 0.54 ± 0.12
BPF 0.39 ± 0.13 0.53 ± 0.13 0.42 ± 0.11 0.51 ± 0.12 0.63 ± 0.10
Several clustering validation indices were used,
trying to compare the partitions using different per-
spectives. Each of the validation indices showed that
there is a high evidence of correlation between the
partitions obtained by the ECG and the EEG. There
is not a clear winner method, but Average Linkage
and Consensus Clustering can be considered suitable
methods for this kind of analysis.
ACKNOWLEDGEMENTS
This work was partially funded by Fundac¸
˜
ao
para a Ci
ˆ
encia e Tecnologia (FCT) under grants
PTDC/EEI-SII/2312/2012, SFRH/BD/65248/2009
and SFRH/PROTEC/49512/2009, and by
´
Area
Departamental de Engenharia Electr
´
onica e
Telecomunicac¸
˜
oes e de Computadores (ISEL),
IJCCI2013-InternationalJointConferenceonComputationalIntelligence
388

whose support the authors gratefully acknowledge.
REFERENCES
Ahern, G. L. and Schwartz, G. E. (1985). Differential later-
alization for positive and negative emotion in the hu-
man brain: Eeg spectral analysis. Neuropsychologia,
23(6):745–755.
Aidos, H. and Fred, A. (2011). Hierarchical clustering with
high order dissimilarities. In Proceedings of the 7th
International Conference on Machine Learning and
Data Mining (MLDM 2011), volume 6871 of Lec-
ture Notes in Computer Science, pages 280–293, New
York, USA.
Aidos, H. and Fred, A. (2012). Statistical modeling of dis-
similarity increments for d-dimensional data: Appli-
cation in partitional clustering. Pattern Recognition,
45(9):3061–3071.
Almeida, M., Bioucas-Dias, J., and Vig
´
ario, R. (2009).
Source separation of phase-locked subspaces. In Pro-
ceedings of the International Conference on Indepen-
dent Component Analysis and Signal Separation, vol-
ume 5441, pages 203–210.
Aviezer, H., Trope, Y., and Todorov, A. (2012). Body
cues, not facial expressions, discriminate between
intense positive and negative emotions. Science,
338(6111):1225–1229.
Belle, A., Hargraves, R. H., and Najarian, K. (2012). An au-
tomated optimal engagement and attention detection
system using electrocardiogram. Computational and
Mathematical Methods in Medicine, 2012.
Belle, A., Ji, S.-Y., Ansari, S., Hakimzadeh, R., Ward, K.,
and Najarian, K. (2010). Frustration detection with
electrocardiograph signal using wavelet transform. In
IEEE International Conference on Biosciences (BIO-
SCIENCESWORLD), pages 91–94. IEEE.
Ben-Hur, A., Elisseeff, A., and Guyon, I. (2002). A stabil-
ity based method for discovering structure in clustered
data. In Pacific Symposium on Biocomputing.
Canento, F., Fred, A., Silva, H., Gamboa, H., and Lourenc¸o,
A. (2011). Multimodal biosignal sensor data handling
for emotion recognition. In Proceedings of the IEEE
Sensors Conference.
Canento, F., Lourenc¸o, A., Silva, H., Fred, A., and Raposo,
N. (2013). On real time ECG algorithms for biometric
applications. In Proceedings of the 6th Conference on
Bio-Inspired Systems and Signal Processing (BIOSIG-
NALS).
Carreiras, C., Aidos, H., Silva, H., and Fred, A. (2013).
Exploratory eeg analysis using clustering and phase-
locking factor. In Proceedings of the 6th Confer-
ence on Bio-Inspired Systems and Signal Processing
(BIOSIGNALS 2013).
Coan, J. A. and Allen, J. J. (2007). Handbook of emotion
elicitation and assessment. Oxford University Press,
USA.
Dom, B. E. (2001). An information-theoretic external
cluster-validity measure. Technical Report IBM Re-
search Report RJ 10219, IBM Research Report.
Duarte, F., Duarte, J., Fred, A., and Rodrigues, M. (2011).
Average cluster consistency for cluster ensemble se-
lection. In Fred, A., Dietz, J., Liu, K., and Filipe, J.,
editors, Knowledge Discovery, Knowlege Engineering
and Knowledge Management, volume 128 of Commu-
nications in Computer and Information Science, pages
133–148. Springer Berlin Heidelberg.
Dubes, R. and Jain, A. (1979). Validity studies in clustering
methodologies. Pattern Recognition, 11:235–254.
Engelse, W. A. H. and Zeelenberg, C. (1979). A single scan
algorithm for QRS-detection and feature extraction.
Computers in Cardiology, 6:37–42.
Epp, C., Lippold, M., and Mandryk, R. L. (2011). Identi-
fying emotional states using keystroke dynamics. In
Proceedings of the 2011 annual conference on Human
factors in computing systems, pages 715–724. ACM.
Fairclough, S. H. (2009). Fundamentals of physiological
computing. Interacting with computers, 21(1):133–
145.
Fowlkes, E. B. and Mallows, C. L. (1983). A method for
comparing two hierarchical clusterings. Journal of the
American Statistical Association, 78(383):553–569.
Fred, A. (2001). Finding consistent clusters in data par-
titions. In Proceedings of the Second International
Workshop on Multiple Classifier Systems, pages 309–
318, London, UK. Springer-Verlag.
Fred, A. and Jain, A. (2002). Evidence accumulation clus-
tering based on the k-means algorithm. Structural,
syntactic, and statistical pattern recognition, pages
303–333.
Fred, A. and Jain, A. K. (2005). Combining multiple clus-
tering using evidence accumulation. IEEE Trans. Pat-
tern Analysis and Machine Intelligence, 27(6):835–
850.
Fred, A. and Leit
˜
ao, J. (2003). A new cluster isolation cri-
terion based on dissimilarity increments. IEEE Trans-
actions on Pattern Analysis and Machine Intelligence,
25(8):944–958.
Fulton, J. (1999). Mensa book of total genius. Barnes &
Noble Books.
Gamboa, H., Silva, H., and Fred, A. (2007). HiMotion
Project. Technical report, Instituto Superior T
´
ecnico,
Lisbon, Portugal.
Ghosh, J. and Acharya, A. (2011). Cluster ensem-
bles. WIREs Data Mining and Knowledge Discovery,
1(4):305–315.
Halkidi, M., Batistakis, Y., and Vazirgiannis, M. (2001). On
clustering validation techniques. Journal of Intelligent
Information Systems, 17:107–145.
Jain, A. K. and Dubes, R. C. (1988). Algorithms for clus-
tering data. Prentice-Hall, Inc., Upper Saddle River,
NJ, USA.
Kuncheva, L. I. and Vetrov, D. P. (2006). Evaluation of
stability of k-means cluster ensembles with respect
to random initialization. IEEE Trans. Pattern Anal.
Mach. Intell., 28(11):1798–1808.
Levenson, R. W. (1992). Autonomic nervous system dif-
ferences among emotions. Psychological science,
3(1):23–27.
Lourenc¸o, A., Rota Bul
`
o, S., Rebagliati, N., Figueiredo,
M., Fred, A., and Pelillo, M. (2013). Probabilistic
MorphologicalECGAnalysisforAttentionDetection
389

evidence accumulation for clustering ensembles. In
Proc Int. Conf. on Pattern Recognition Applications
and Methods (ICPRAM).
Lourenc¸o, A., Fred, A., and Jain, A. K. (2010). On the scal-
ability of Evidence Accumulation Clustering. In Proc.
20th International Conference on Pattern Recognition
(ICPR), Istanbul Turkey.
Luo, P., Xiong, H., Zhan, G., Wu, J., and Shi, Z. (2009).
Information-theoretic distance measures for clustering
validation: Generalization and normalization. IEEE
Trans. on Knowl. and Data Eng., 21(9):1249–1262.
Mak, J. N. and Wolpaw, J. R. (2009). Clinical applications
of brain-computer interfaces: current state and future
prospects. IEEE Reviews in Biomedical Engineering,
2:187–199.
Malmivuo, J. and Plonsey, R. (1995). Bioelectromagnetism:
Principles and Applications of Bioelectric and Bio-
magnetic Fields. Oxford University Press, USA.
Medina, L. (2009). Identification of stress states from ECG
signals using unsupervised learning methods. Mas-
ter’s thesis, Universidade T
´
ecnica de Lisboa, Instituto
Superior T
´
ecnico.
Meil
˘
a, M. (2007). Comparing clusterings—an information
based distance. J. Multivar. Anal., 98(5):873–895.
Murray, I. R. and Arnott, J. L. (1993). Toward the simula-
tion of emotion in synthetic speech: A review of the
literature on human vocal emotion. The Journal of the
Acoustical Society of America, 93:1097.
Pell, M. D., Jaywant, A., Monetta, L., and Kotz, S. A.
(2011). Emotional speech processing: disentangling
the effects of prosody and semantic cues. Cognition
& Emotion, 25(5):834–853.
Pfurtscheller, G. and Lopes da Silva, F. H. (1999). Event-
related EEG/MEG synchronization and desynchro-
nization: basic principles. Clinical Neurophysiology,
110:1842 – 1857.
Rand, W. M. (1971). Objective criteria for the evaluation of
clustering methods. Journal of the American Statisti-
cal Association, 66(336):pp. 846–850.
Silva, H., Fred, A., Eusebio, S., Torrado, M., and Ouakinin,
S. (2012). Feature extraction for psychophysiological
load assessment in unconstrained scenarios. In Annual
International Conference of the IEEE Engineering in
Medicine and Biology Society (EMBC), pages 4784–
4787. IEEE.
Silva, H., Lourenc¸o, A., Lourenc¸o, R., Leite, P., Coutinho,
D., and Fred, A. (2011). Study and evaluation of a sin-
gle differential sensor design based on electro-textile
electrodes for ECG biometrics applications. In Pro-
ceedings of the IEEE Sensors Conference.
Theodoridis, S. and Koutroumbas, K. (1999). Patern recog-
nition. Academic Press.
Vega-Pons, S. and Ruiz-Shulcloper, J. (2011). A survey of
clustering ensemble algorithms. International Jour-
nal of Pattern Recognition and Artifical Intelligence
(IJPRAI), 25(3):337–372.
Wallace, D. L. (1983). A method for comparing two hierar-
chical clusterings: Comment. Journal of the American
Statistical Association, 78(383):pp. 569–576.
Zheng, W., Zhou, X., Zou, C., and Zhao, L. (2006). Facial
expression recognition using kernel canonical corre-
lation analysis (kcca). IEEE Transactions on Neural
Networks, 17(1):233–238.
IJCCI2013-InternationalJointConferenceonComputationalIntelligence
390
