
Design of Complex Spatio-multidimensional Models with the
ICSOLAP UML Profile
An Implementation in MagicDraw
Sandro Bimonte
1
, Kamal Boulil
1
, Francois Pinet
1
and Myoung-Ah Kang
2
1
Irstea, TSCF, 24 Avenue des Landais, 63178, Aubière, France
2
LIMOS-UMR CNRS 6158, ISIMA, Blaise Pascal University, Campus des CEZEAUX, Aubière, France
Keywords: Spatial Data Warehouse, Spatial OLAP, Multidimensional Modelling, UML.
Abstract: Spatial Data Warehouse and SOLAP systems allow analyzing huge volume of georeferenced data. SOLAP
applications are usually complex needing advanced static and dynamic modelling properties. In particular,
SOLAP applications require: multi-granular measures and complex aggregations based on aggregate
functions depending on dimensions, hierarchies and levels. In this demo paper, motivated by the lack of
conceptual spatio-multidimensional models based on standard languages and supporting such complex
modelling requirements, we present a new UML profile for complex spatial data cubes. We implement our
profile in the commercial CASE tool called MagicDraw. Using a real environmental case study, we show
the theoretical and technical effectiveness of our proposal.
1 INTRODUCTION
Spatial Data Warehouse (SDW) and Spatial OLAP
(SOLAP) systems allow analyzing huge volume of
geo-referenced datasets modelled according to the
spatio-multidimensional model, which represents
decisional data in terms of facts (subjects of
analysis) and dimensions (analysis axis). This model
extends the classical OLAP model with specific
concepts such as spatial dimensions, spatial
measures and spatial aggregate functions (Bédard et
al., 2006). A spatial dimension (respectively a
spatial measure) allows representing facts ‘locations
as axis (respectively as subjects) of analysis using
geometrical attributes. Data aggregation in SOLAP
is an important and frequent task since it permits to
users to compute different analysis indicators by
summarizing factual data (numerical and spatial
measures) along dimension hierarchies using
aggregate functions. This aggregation which is
triggered by SOLAP operators implemented in
SOLAP systems depends on the chosen measure and
hierarchy (i.e. the aggregate function we use
depends on both measure and hierarchy types).
Usually, SOLAP systems integrate OLAP and
Geographic Information Systems functionalities in a
unique and coherent framework. SOLAP systems
are based on a three-tiers architecture composed of:
(i) a Spatial DBMS allowing for storing and
querying SDW data, (ii) a SOLAP server which
implements a set of SOLAP operators (e.g., Spatial
drill-down) dedicated to rapidly defining and
exploring spatial data cubes from the SDW data,
(iii) and finally a SOLAP client that allows
visualizing data cube data in graphical, tabular and
cartographic interactive displays (Bimonte et al.,
2010).
It is widely recognized that SOLAP applications,
such as environmental, health, economic ones
(Bédard et al., 2006), are usually very complex
requiring advanced and complex spatio-
multidimensional modelling issues. Then,
conceptual models are important means to interface
decision-makers with DW designers in order to
define (spatio)multidimensional models reflecting
users’ analysis goals (Torlone, 2003.
In particular, advanced elements’ typing, multi-
granular measures, and complex aggregation rules
for measures along dimensions (for example, the
aggregation of sales’ amounts only along the time
dimension using the average) are mandatory issues
when dealing with real applications (Boulil, 2012).
To the best of our knowledge no existing work
addresses these modelling requirements.
In this demo paper, motivated by the important
expressivity of UML, and its implementation in
310
Bimonte S., Boulil K., Pinet F. and Kang M..
Design of Complex Spatio-multidimensional Models with the ICSOLAP UML Profile - An Implementation in MagicDraw.
DOI: 10.5220/0004556803100315
In Proceedings of the 15th International Conference on Enterprise Information Systems (ICEIS-2013), pages 310-315
ISBN: 978-989-8565-59-4
Copyright
c
2013 SCITEPRESS (Science and Technology Publications, Lda.)

functional CASE tools (such as Eclipse, etc.) we
present a UML profile for designing spatio-
multidimensional models (Boulil, 2012) taking into
account the above described modelling
requirements. A UML profile is an extension of
UML to explicitly represent a particular application
domain semantics by means of stereotypes
(specializations of UML elements), tagged values
(stereotypes’ properties) and OCL constraints.
Finally, the main goal of the demo is to show the
implementation of our profile for SOLAP in the
commercial CASE tool MagicDraw. Using a real
environmental case study, we show the theoretical
and technical effectiveness of our proposal.
2 RELATED WORK
Several conceptual spatio-multidimensional models
for SOLAP have been proposed in the literature,
which are either based on standard or ad hoc
languages. However, until now, no standard model
has emerged. In this section,motivated by the need
of a standard-based conceptual design and an
automatic implementation of SOLAP models, we
present only main UML and ER based models. We
analyse these models according the modelling
requirements described in Section 1.
(Malinowski and Zimányil, 2008) propose an
ER-based model called Spatial MultiDimER. Spatial
MultiDimER represents main static SDW concepts
such complex and multiple spatial hierarchies and
spatial measures, but does not provide any support
for measure aggregation and multi-granular
measures.
To the best of our knowledge, the main UML-
based models for the SDW conceptual design are
proposed in (Glorio and Trujillo, 2008) and (Pinet
and Schneider, 2010). The authors in (Glorio and
Trujillo, 2008) propose a UML profile that
represents main SDW concepts such as multiple data
cubes but that does not support multi-granular
measures. Regarding aggregation, this profile
defines only forbidden aggregate functions for
measures along dimensions using UML notes. This
profile is implemented in the Ecplise IDE. Reference
(Pinet and Schneider, 2010) presents a UML profile
that unify representations of facts and dimensions
for more flexibility in the design process, but this
profile does not offer supports for measure
aggregation and multi-granular measures.
Finally, all of the existing conceptual models
whether spatial or not, standard-based or not, focus
on the design of the DW structures and ignore the
aggregation aspects such as modeling of aggregate
functions and complex aggregation rules. In
addition, these models present some limitations
concerning modeling of multi-granular measures and
automatic implementation.
3 CASE STUDY
In order to present our proposal, we introduce an
environmental case study, adapted from the French
national project DISP’eau (Jacquot et al., 2011). One
of the main goals of this project is the analysis of
some environmental data for the definition of
vineyard irrigation diagnostics. In particular, data
about soil humidity are hourly collected
automatically by a Wireless Sensor Network (WSN),
and precipitation data are manually collected by the
farmers or automatically by sensors. In this way
decision-makers would be able to obtain
cartographic reports of environmental data by hour,
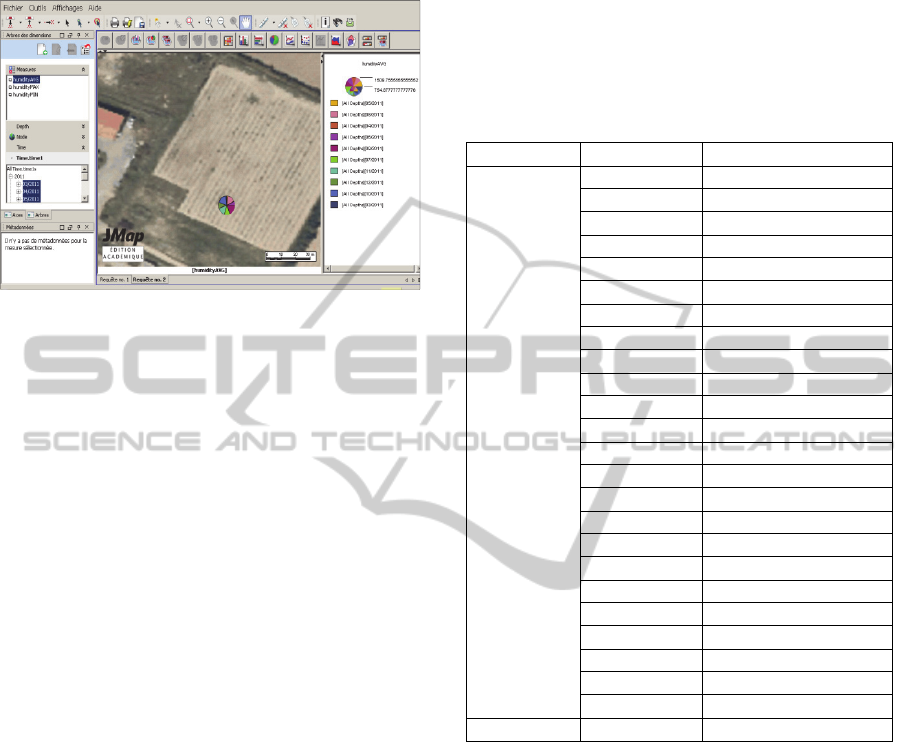
day, sensor and plot. For that reason, we have
deployed a SOLAP system for the analysis of that
data as shown on Figure 1 using the SOLAP system
Map4Decision. This figure represents the average
humidity for one sensor by hours.
However, precipitation data reveals being very
complex to be integrated in the spatial data
warehouse since some farmers could collect data per
day (the total sum of a day) and not per hour. In
other terms the precipitation measures are collected
at different granularities.
4 ICSOLAP UML PROFILE
ICSOLAP profile is organized into two main models
representing the static and dynamic elements of
SOLAP applications: the SDW model and the
Aggregation model (Boulil, 2012).
In particular, the SDW model defines dimensions
and facts using respectively UML package and UML
class elements. Dimensions are composed of levels,
and facts are described by measures that are
represented as attributes. Each element is typed:
spatial, thematic and temporal (e.g.
<<SpatialDimension>> for spatial
dimensions, <<SpatialAggLevel>> for spatial
level, Region for spatial data type, etc.).
Facts are related to any level of a dimension
through the association <<DimRelationship>>
allowing modeling facts at different granularities.
Figure 2 shows the SDW model of our case
DesignofComplexSpatio-multidimensionalModelswiththeICSOLAPUMLProfile-AnImplementationinMagicDraw
311
study. It presents a spatial dimension “Nodes”, a
temporal dimension “Time” and two measures.
Figure 1: Visualization of SOLAP queries using
Map4Decision.
Let us note that as stated in the previous section,
precipitation measure values can be associated to the
“Hour” or “Day” levels. Moreover, it is necessary to
represent what aggregate function (the
ETLoperation tagged value of the measure) is
used when factual data is not associated to the most
detailed level of a dimension in order to correctly
define a way to estimate the measure value for the
detailed level (the Disaggregator tagged value
of the measure). Thus as shown in the fact class of
Figure 2, in our example the measure “precipitation”
is daily collected using the “Sum” and a splitting
function on 24 hours (“24HSplit”) is used to
estimate the hourly precipitation. For example
suppose that we have the precipitation values of two
days, "2011/12/15" and "2011/12/30", respectively
at the "Hour" and "Day" granularities, as shown
Table 1. Then, knowing that these values represent
totals (sums, the ETLOperation = 'Sum'), first if we
want to have precipitation values per hour for the
day "2011/12/30", we simply apply the "24HSplit"
function on the value "68" and get 2.83 mm for each
hour of this day. Secondly, if we want to compute
the average precipitation of these two days, we
should first apply the disaggregate function
"24HSplit" on the value "68" to get the precipitation
values for all the hours of "2011/12/30"; then apply
the average on all the precipitation values of all the
hours of the two days (sum of all values and division
by 48). This is because the average aggregate
function is non-distributive. By proceeding in this
way, we get the average value of 2.71 mm per hour
for these two days, which is more correct than the
sum and division by 25 ((62+2.83)/25=2.6).
Thanks to our solution that considers the
dependency between the aggregate function used in
the ETL process and the aggregate function used in
SOLAP queries, we avoid incorrect summaries. In
this way, our conceptual model is the unique one
that is able to represent measures at different
granularities.
Table 1: An example of precipitation values at "Hour" and
"Day" granularities.
Day Hour Precipitation(in mm)
2011/12/15
Hour 00 0
Hour 01 0
Hour 02 0
Hour 03 0
Hour 04 0
Hour 05 10
Hour 06 22
Hour 07 8
Hour 08 0
Hour 09 0
Hour 10 0
Hour 11 0
Hour 12 0
Hour 13 0
Hour 14 0
Hour 15 0
Hour 16 0
Hour 17 6
Hour 18 16
Hour 19 0
Hour 20 0
Hour 21 0
Hour 22 0
Hour 23 0
2011/12/30 68
The aggregation model allows representing how
measures are aggregated along dimensions
(<<BaseIndicator>>). Aggregation rules can
be defined along dimensions, hierarchies and
between levels. In particular, the used measure is
represented with the aggregatedAttribute
tagged value and the aggregate function,
aggregator, is defined as a parameter of the
aggregation rule (operation) of the indicator class. In
the example of Figure 3 (“AVG-SUMPluviometry”),
the precipitation measure is aggregated using the
sum on the temporal dimension and the average on
the spatial dimension. This indicator allows to
answer to complex SOLAP queries like: “What is
the average precipitation per plot and day (summing
the hourly precipitation)”. Note that, using our UML
profile, users choose the aggregator in a predefined
list (Figure 4) in MagicDraw.
ICEIS2013-15thInternationalConferenceonEnterpriseInformationSystems
312
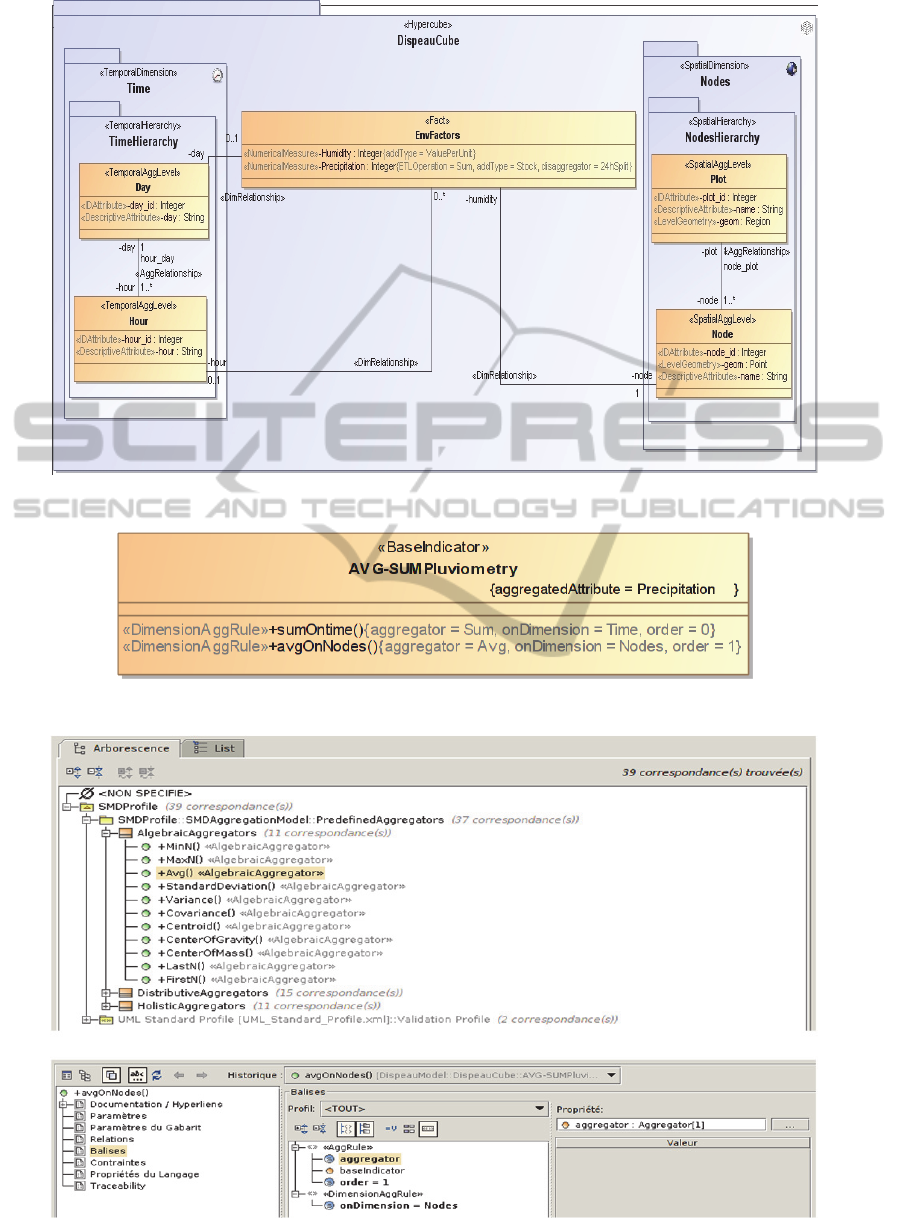
Figure 2: The SDW model: The Dispeau SDW model.
Figure 3: The Aggregation model: An example of a complex indicator.
Figure 4: The Aggregator's choice with our profile.
DesignofComplexSpatio-multidimensionalModelswiththeICSOLAPUMLProfile-AnImplementationinMagicDraw
313
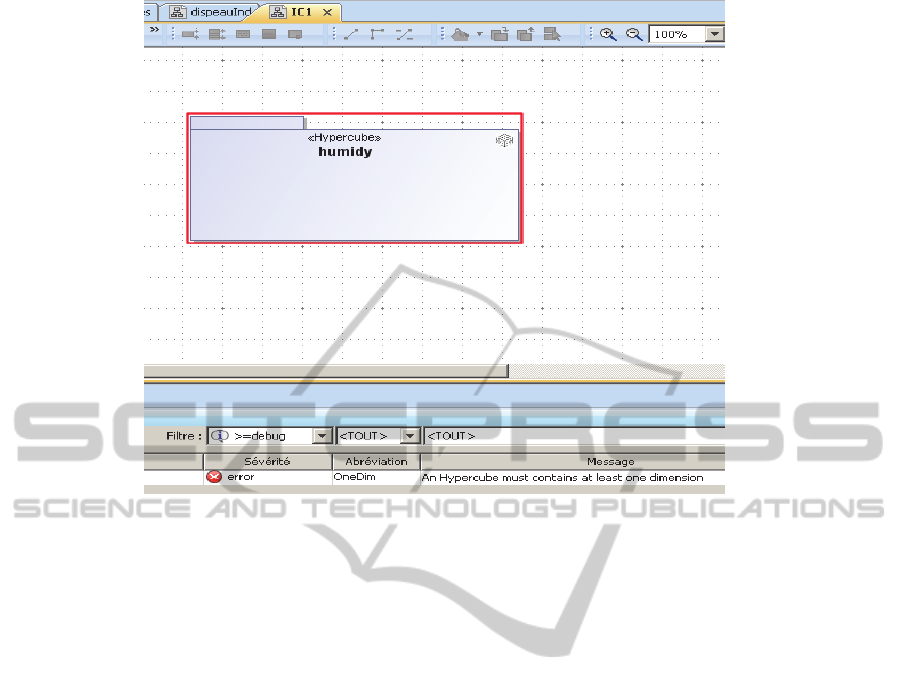
Figure 5: MagicDraw OCL profile checking.
5 IMPLEMENTATION
To the best of our knowledge only the CASE tool
MagicDraw (MagicDraw, 2012) natively
implements OCL constraints of UML profiles (on
the UML metamodel). Thus, we adopt this CASE
tool for our profile. This allows checking OCL
constraints during the design phase. Indeed,
semantic and structural constraints of a UML profile
can be modelled using OCL. For example in our
profile the following OCL statement states that an
hypercube should contain at least one dimension
forcing designers to define well-formed SOLAP
models.
context Hypercube inv
self.ownedMember->select (m |
m.oclIsTypeOf(SpatialDimension) or
m.oclIsTypeOf(TemporalDimension) or
m.oclIsTypeOf(ThematicDimension))-
>size()>0
Figure 5 shows an example of the OCL checking
functionality of MagicDraw where the previously
defined constraint is not satisfied (a representative
subset of the OCL constraints have been
implemented).
6 CONCLUSIONS AND FUTURE
WORK
Real SOLAP applications require complex
modelling requirements such as: advanced typing,
measures at different granularities, and complex
aggregation rules. Thus in this demo paper, we
present our ICSOLAP UML profile that allows
designing complex SOLAP models in terms of the
UML and OCL standard languages. It is
implemented in the CASE tool MagicDraw.
At the moment we are working on the automatic
definition of SOLAP client schemas to complete the
automatic implementation proposed in this paper.
ACKNOWLEDGEMENTS
This work has been funded by Irstea, the French
“Ministère de l'Ecologie, du Développement durable
et de l'Energie” (project Miriphyque), the Disp'eau
project of FUI and the Auvergne Region.
REFERENCE
Bédard, Y., Rivest, S., Proulx, M. (2006). Spatial On-Line
Analytical Processing (SOLAP): Concepts,
ICEIS2013-15thInternationalConferenceonEnterpriseInformationSystems
314

Architectures, and Solutions from a Geomatics
Engineering Perspective. In Wrembel, R. Koncilia, C.
(Eds.), Data Warehouses and OLAP: Concepts,
Architecture, and Solutions, pp. 298-319. Idea Group
Publishing.
Bimonte, S. Tchounikine, A., Miquel, M., Pinet, F. (2010).
When Spatial Analysis Meets OLAP:
Multidimensional Model and Operators. International
Journal of DataWarehousing and Mining, 6(4) pp. 33-
60.
Torlone, R. (2003). Conceptual multidimensional models.
Multidimensional databases , IGI Publishing : 69-90.
Boulil. K. Une Approche Automatisée basée sur des
Contraintes d'Intégrité définies en UML et OCL pour
la Vérification de la Cohérence Logique dans les
Systèmes SOLAP. Applications dans le domaine agri-
environnemental. PhD Thesis, Unversité Blaise
Pascal, Clermont-Ferrand, France, 2012.
Malinowski, E. and E. Zimányi (2008). "Advanced Data
Warehouse Design." Advanced Data Warehouse
Design: From Conventional to Spatial and Temporal
Applications, Data- Centric Systems and Applications,
Volume. ISBN 978-3-540-74404-7. Springer Berlin
Heidelberg, 2008.
Glorio, O. and J. Trujillo (2008). An MDA Approach for
the Development of Spatial Data Warehouses. Data
Warehousing and Knowledge Discovery. I.-Y. Song, J.
Eder and T. Nguyen, Springer Berlin / Heidelberg.
5182: 23-32.
Pinet, F. and M. Schneider (2010). "Precise design of
environmental data warehouses." Operational
Research 10 (3): 349-369.
Jacquot, A. De Sousa, G. Chanet, J.P. Pinet,F. (2011).
Réseau de capteurs sans fil pour le suivi de l'humidité
du sol des vignes ECOTECHS' 2011, Capteurs et
systèmes de mesures pour les applications
environnementales, 17/10/2011-18/10/2011,
Montoldre( 03), FRA pp. 7-10.
MagicDraw, (2012). No Magic, Inc., http://
www.magicdraw.com
DesignofComplexSpatio-multidimensionalModelswiththeICSOLAPUMLProfile-AnImplementationinMagicDraw
315
