
Application of Information Technology for Visualizing
and Optimizing Construction Project Schedule
Hyeon-Seung Kim
1
, So-Yong Moon
1
, Hyoun-Seok Moon
2
and Leen-Seok Kang
3
1
Department of Civil Engineering, Gyeongsang National University, Jinju, Korea
2
ICT Lab. Korea Institute of Construction Technology, Ilsan, Korea
3
Department of Civil Engineering, Gyeongsang National University, Jinju, Korea
Keywords: Virtual Reality, Building Information Modelling, Simulation, Visualization, Construction Progress
Monitoring.
Abstract: Recently, various information technologies such as VR (Virtual Reality) and AR (Augmented Reality) are
being used for visualizing construction information. Specially, BIM (Building Information Modelling) is a
representative tool for IT application in construction industry. Generally, BIM uses VR and nD CAD system
to visualize construction schedule data. This study develops a methodology and system to apply BIM
functions using 4D CAD simulation technique for risk analysis and schedule progress monitoring in the
construction industry.
1 INTRODUCTION
As construction projects grow in scale and
complexity, and new construction methods and
techniques are adopted, the quantity of data
generated at each of the construction phases is
becoming greater. As such, practicality of using VR
(Virtual Reality) and BIM (Building Information
Modelling) based on three-dimensional design is
expanding in the construction industry. Most
recently in particular, use of information technology
(IT) such as VR and BIM in the construction
industry is being an essential item for successful
project management in the construction industry.
4D CAD system is a representative function in
the BIM tool. 4D CAD means that construction
schedule as an another dimension is added in 3D
object. Project manager can visually check the
construction status using 4D CAD system because
3D object for the appearance of finished work is
continually simulated by construction date. Recently,
4D CAD system is being a useful tool for visualizing
construction schedule data. However, use of CAD in
civil engineering projects is relatively low compared
to building projects, which has led to insufficient
application of VR and BIM in real projects (Kang,
2010a, 2010b). Because civil engineering projects
consist of horizontal work area and non-repetitive
activities, it is difficult to make 3D objects of each
activity. Fischer et al. (2005) had suggested 4D
simulation examples and advantages of many large
projects by dividing design phase and construction
phase. Dawood et al. (2002) had developed
PECASO (Patterns Execution and Critical
Assessment of Spatial Organization) model that can
manage space crash and interference between
activities within 4D environment. PECASO model
realizes 4D object through four modules of space
crash process between activities generated in project
execution. This research develops a method and
functions for 4D CAD system using VR tool for
civil engineering projects.
2 VR FUNCTION FOR
CONSTRUCTION PHASE
2.1 IT Application in Construction
Industry
The goal during the construction phase is to reduce
schedule, minimize cost and ensure construction
quality through improved constructability and
mitigation of abortive work. To achieve this,
integrated management of construction information
is required. However, there are further challenges
329
Kim H., Moon S., Moon H. and Kang L..
Application of Information Technology for Visualizing and Optimizing Construction Project Schedule.
DOI: 10.5220/0004565303290332
In Proceedings of the 15th International Conference on Enterprise Information Systems (ICEIS-2013), pages 329-332
ISBN: 978-989-8565-60-0
Copyright
c
2013 SCITEPRESS (Science and Technology Publications, Lda.)

against collection and sharing of construction data as
projects have become larger and more complex, with
greater work scope and increased need for
collaboration between stakeholders including clients,
designers, builders and subcontractors.
As such, this research aims to propose an
operating process for construction VR for collection
and sharing of construction data during the
construction phase. This process first reviews the
project information and designs, and on that basis
establishes a construction plan that can enhance
work efficiency through identification of
information such as work sequencing errors, planned
vs. actual progress and construction risks using 3D
visual simulation applied to existing business
workflows. In particular, this process allows for data
extraction by sequence for expedited identification
of and response to issues analyzed.
The work sequence review simulation can
demonstrate hundreds of activities and their
predecessor/successor relationships to visually
identify errors in work sequencing. The module first
generates a WBS (Work Breakdown Structure), 3D
model and schedule based on the project design, and
integrates them around the WBS.
In this research, we have developed an
automated module of our own for generation and
combined simulation of the WBS, 3D model and
schedule in order to increase usability and
efficiency. 3D and 4D objects can be simulated by
WBS level in this module. It would be helpful for
project managers to visualize project schedule by
work unit. Predecessor and successor relationships
by process can be determined using mouse controls
and the relationship entry module. Then the
activities were executed as simulations that not only
represented each process but also integrated the
overall schedule. By identifying the sequencing
errors in advance and re-adjusting the predecessor
and successor activities for each process
accordingly, the process can prevent abortive works.
The VR functions for current BIM systems are
focused on the simple simulation of finished
appearance by construction schedule. This study
suggests a VR function for visualizing construction
risk by construction schedule. Construction risk
means the risk in constructability of each activity.
VR function in the system represents different colors
of 3D object of each activity by risk level.
2.2 Application of Fuzzy Theory for
Quantifying Construction Risk
Construction risk information of each activity can be
visualized using Fuzzy analysis in the 4D CAD
system. Each activity has a risk degree that is
represented by different color. This study classifies
risk degree with 5 groups and each group has a color
from red color to blue color. Fig 1 shows 4D objects
that simulate the finished work by each risk degree.
Figure 1: Risk identification by Fuzzy analysis.
The fuzzy theory is used to obtain an objective
data from substantial and experienced data of risk
degree of each activity by field engineers. If a
finished activity simulates with red color in 4D
simulation system, project manager should monitor
the activity carefully because the activity has high
risk degree. In this 4D CAD system, all activities are
simulated with each color of 5 colors by each risk
degree that was analyzed using Fuzzy theory. Fuzzy
theory is used for verifying the subjective risk
degree with quantitative data.
The risk of each activity is analyzed by
multiplying risk probability to risk intensity. Project
manager should input those data for analyzing risk.
The developed 4D system in the study has a risk
analysis function using Fuzzy theory.
If project managers use this system, they can take
an intensive management plan for the activities with
risk degree of high level. And they can easily
identify those activities because the activities are
simulated in 4D CAD system with different color
such as red color or green color.
2.3 Visualization of Risk Information
for Construction Project
Fig. 2 shows a VR function for visualizing
construction risk analysis developed in this study.
The construction risk analysis module reviews
various internal and external risks on construction in
order to mitigate them in advance. To achieve this,
the module measured risk levels through Fuzzy and
risk analysis techniques, and simulated those risks
ICEIS2013-15thInternationalConferenceonEnterpriseInformationSystems
330
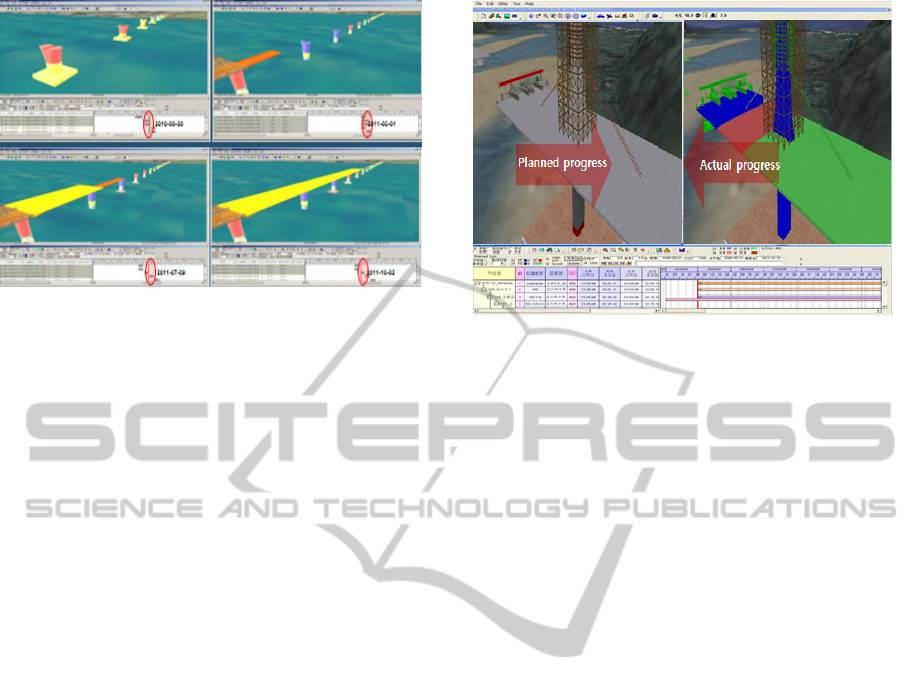
Figure 2: VR function for visualizing construction risk.
visually. Risk evaluation measured risks on factors
of cost, time and work condition in order to identify
activity sequences that had high probability of
schedule delays, cost overruns or accident
occurrence. The evaluation rated each activity on a
scale of five grades and displayed them in different
colors by risk level. This provides for an
understanding of risk management priority by
sequence, while also serving as an effective
communication using a 3D visual simulation
displaying risk levels by color.
3 4D FUNCTION
FOR SIMULATING
CONSTRUCTION PROGRESS
The other VR function in the study is for visualizing
construction progress. Construction schedule,
specially progress situation between planned
schedule and actual schedule, needs to be visualized
for easy understanding of schedule delay. This study
uses to classify some colors by grouping delay
activities, normal activities and earlier activities
comparing with planned schedule. The each
activities are using red color, green color and blue
color in simulation function.
Fig. 3 shows processes of realizing telepresence
to visually compare the simulation realized in the
previous stage based on the planned schedule with
progress status of the construction at the site. 4D
CAD screen module, which is divided to show two
images simultaneously, is generated. These images
make it possible to visually check schedule progress
status in the construction site compared to the
planned schedule as of today.
The progress simulation module in Fig. 3 allows
effective progress management by visually
Figure 3: VR function for visualizing planned schedule
and actual schedule.
simulating the difference between planned and
actual completion over a large site area. Progress of
each activity was calculated using the start date, end
date and the required resource quantities. First,
actual progress was calculated with the schedule
module using the planned dates and actual resources
spent. The calculated progress was categorized into
normal, delayed and ahead vs. planned, and these
results were linked to 3D models and displayed in
blue, red and green to represent the progress status
visually.
4 4D FUNCTION
FOR OPTIMIZING
CONSTRUCTION SCHEDULE
To improve the constructability, the overlapping
between activity schedules should be reduced in
whole construction period. In order to minimize the
number of overlapping activities, a corresponding
analysis should be executed based on specific
constraints. First of all, overlapping duration for a
corresponding activity should be minimized
changing in ‘day’ units within a particular total float.
During this process, the relationships with
predecessor activities should be maintained. In
general, a project has diverse overlapping activities,
and solving the overlapping of individual activities
is meaningless. Therefore, all the overlapping
activities should be moved back and forth in ‘day’
units within the total float to search for an optimal
schedule that minimizes the overlapping level.
Because a series of these types of procedures are
repeated based the number of overlapping activities,
a methodology detects the optimization solutions of
ApplicationofInformationTechnologyforVisualizingandOptimizingConstructionProjectSchedule
331

a schedule as per the change days of the total float is
required. This study suggests a genetic algorithm
methodology to resolve the optimized construction
schedule. That is, the number of a project’s activities
becomes a chromosome for each generation while
movable days for each overlapping activity within
the total float are regarded a gene. After an initial
solution is created, a project’s overall overlapping
level is repeatedly analyzed and an optimal solution
with the minimum overlapping level can be derived.
Thus, an optimal schedule that minimizes
overlapping activities can be created without any
change in the initial project duration. The VR
function for minimizing overlapping schedule using
genetic algorithm needs to be developed in improved
BIM systems.
5 CONCLUSIONS
This research presented a VR system for the
construction phase that can raise the usefulness of
BIM on the construction projects. The proposed VR
process enables integrated management of
construction data through analysis of progress,
sequencing errors and risks. A Fuzzy analysis and a
simple optimization concept that are linked with
BIM functions were suggested in the paper.
Considering that the existing studies for BIM are
focused on the visualization of work condition, this
approach can be a useful function for project
manager. Also as the system uses visual
representation of complex and numerical
information for a construction project, it can be
expected that the system will be actively used as an
effective decision making tool.
ACKNOWLEDGEMENTS
A part of this study was supported by the National
Research Foundation of Korea (NRF) grant funded
by the Korea government (No. 2011-0016064).
REFERENCES
Dawood Nashwan, etc., 2002. Registering space
requirements of construction operations using Site-
PECASO model. Proceedings of CIB W78 Conference
Kang, L. S., Park, S. Y., Moon, H. S., and Kim, C. H.,
2007. Improvement of basic functions for visualizing
schedule and 3D object in 4D CAD system.
Conference Proceedings of CIB 2007, South Africa.
Kang, L. S., Moon, H. S., Park, S. Y., Kim, C. H., and
Lee, T. S., 2010a. Improved link system between
schedule data and 3D object in 4D CAD system by
using WBS code. KSCE Journal of Civil
Engineering, 14(6), 803-814. Seoul Korea
Kang, L. S., Moon, H. S., Dawood, N., and Kang, M. S.,
2010b. Development of methodology and virtual
system for optimized simulation of road design data.
Automation in Construction, 19, 1000-1015.
Martin Fischer et al., 2005. Experiences with 3D and 4D
CAD on building construction projects: benefits for
project success and controllable implementation
factors. Construction Information Digital Library
(http:://itc.scix.net)
Dawood Nashwan and Mallasi Z., 2006. Construction
Workspace Planning: Assignment and Analysis
Utilizing 4D Visualization Technologies. Computer-
Aided Civil and Infrastructure Engineering, 121, 498 –
513
Kamat V. R., 2003. VITASCOPE: Extensible and Scalable
3D Visualization of Simulated Construction
Operations. PhD dissertation, Virginia Polytechnic
Institute and State University, Blacksburg, Virginia.
ICEIS2013-15thInternationalConferenceonEnterpriseInformationSystems
332
