
Mastering ERP Interface Complexity
A Scalable User Interface Concept for ERP Systems
Christian Lambeck and Rainer Groh
Institute of Software and Multimedia Engineering, Chair of Media Design,
Technische Universiät Dresden, 01062 Dresden, Germany
Keywords: Usability, Enterprise Resource Planning, ERP, User Interface Design, User Guidance, Information Access.
Abstract: In recent literature, numerous research efforts addressed the usability of enterprise resource planning (ERP)
systems. Although several heuristics, surveys and interviews provided valuable results to understand and
improve the user satisfaction of ERP, explicit research on the user interface design has been rarely
discussed. As ERP systems have a high dissemination in many enterprise areas, usability issues located in
the user interface have a significant impact on millions of users. This paper gives an overview of the related
work in the fields of usability studies, complexity reduction strategies and visual information presentation in
ERP systems. The conclusion reveals a niche currently not considered in research. Therefore, an abstract
interface model is introduced that aims to establish a new understanding of accessing ERP systems. The
scalable user interface concept attempts to reduce the problem of user guidance and overall system
complexity to ease the user’s system access.
1 INTRODUCTION
Latest research in the field of enterprise resource
planning (ERP) has primarily focused on
technologies and concepts to keep up with a steadily
increasing complexity of business processes and the
volatile market needs. Examples of these
technological improvements are performance
optimizations basing on in-memory and multi-core
computing (Tertilt and Krcmar, 2011), service-
oriented architectures (Seth et al., 2011) or cloud-
based business applications (Ragusa and Puliafito,
2011). In contrast to this technology-focused
research and development, innovation concerning
human-computer interaction in ERP is available, but
obviously less considered. Whereas numerous
research papers in the field of user satisfaction and
usability have focused on the participation of users
in the implementation process, top management
support, self-efficacy or perceived usefulness of the
system (Bin et al., 2010); (Mitakos et al., 2011), the
dedicated investigation of usability barriers located
in the graphical user interface (UI) is rarely
discussed.
This paper addresses an elementary niche in
human-computer interaction in ERP systems. The
authors argue that traditional user interface concepts,
which can be found in most state-of-the-art ERP
systems today, cannot keep up with the rising
requirements. Besides the evolution of business
processes such as real-time supply chains and the
related technologies described before, also the user’s
expectation of visualization and interaction concepts
will significantly change. Nowadays, most users are
already familiar with mobile, multi-touch and
visually rich interfaces that they often use in their
sparse time (e.g. entertainment systems in cars,
smartphones and tablet-PCs, interactive displays in
museums and exhibitions, gesture control in games
etc.). In contrast, the majority of current ERP
systems is still dealing with user interfaces that were
established in the middle of the 1990’s and utilize
forms, tables, standard diagrams and mouse and
keyboard interaction. (cp. (SAP AG, 2012)) Due to
this essential gap between the high requirements and
user expectations on the one hand, and the restricted
UI capabilities on the other hand, users are rather
forced to focus on usability problems than on
fulfilling their actual tasks. (Singh and Wesson,
2009) In consideration of future trends in ERP UI
design, the focus will be laid on web technologies,
social media integration, interactivity and the
differentiation between devices (stationary and
mobile) and user profiles (casual, professional).
170
Lambeck C. and Groh R..
Mastering ERP Interface Complexity - A Scalable User Interface Concept for ERP Systems.
DOI: 10.5220/0004566601700178
In Proceedings of the 15th International Conference on Enterprise Information Systems (ICEIS-2013), pages 170-178
ISBN: 978-989-8565-61-7
Copyright
c
2013 SCITEPRESS (Science and Technology Publications, Lda.)

(Falk, 2012) Therefore, the web-enabled service
orientation will proceed and offers several
potentials. The following section presents related
work in the field of user interface design in ERP
systems and highlights the achievements made so
far. It examines the evolved understanding of the
term user satisfaction within the last years, strategies
to cope with ERP complexity and takes a look at the
role of visual information presentation in ERP.
Herein, also usability related user studies are
addressed. The following section 3 presents our
motivation for a paradigm change in the UI design
of ERP systems. The concluding section 4
introduces an abstract interface model for ERP
systems and thereby incorporates the prior findings.
Section 5 summarizes this paper and gives a brief
view on our future work.
2 RELATED WORK
This section on related work presents research
literature from three relevant fields. The first part is
devoted to related studies on user satisfaction and
usability in the field of ERP. This section presents
chosen definitions of the term user satisfaction and
highlights the insufficient consideration of the
graphical user interface. Furthermore, it describes
prior results from a usability study on manufacturing
enterprises, which was conducted by the authors in
2011. In the second part, strategies to reduce ERP
complexity, such as adaptive UIs and user guidance,
are addressed. These concepts intend assisting the
user in accomplishing his or her current task by
utilizing several supporting strategies. The third part
gives a brief summary of visual information
presentation in the field of ERP, which “seeks to
provide people with better and more effective ways
to understand and analyse these large data sets,
while also enabling them to act upon their findings
immediately”. (Keim et al. (eds.), 2010)
The abstract interface model, which is described
in section 4, comprises the presented concepts of
user guidance and advanced visualizations to
decrease existing usability problems.
2.1 Usability and User Satisfaction
In recent literature, user satisfaction is often referred
to as one of the main user-centered critical success
factors of an ERP system. However, its definition is
manifold. Especially the aspects influencing user
satisfaction vary widely from organizational to
human aspects. In this section, several occurrences
of the term and their meanings are discussed to
illustrate the little consideration of the graphical user
interface.
The term user satisfaction can be often found in
ERP market surveys. This type of survey
benchmarks available (and mostly commercial)
products to support the selection of an ERP system
according to several criteria. Whereas
“...Functionality is still the most important selection
criterion...” for an ERP system (Intelligent systems
solutions GmbH, 2011), user-centered factors are
getting parenthetically summarized to the aspect of
ergonomics. The ergonomical criterion is ranked
fifth in the list of selection criteria, whereas it is not
even mentioned in the list of reasons for
implementing a new ERP installation. In contrast,
further objectives pursued with an ERP
implementation project, such as faster access to
enterprise information, indicate the implicit
necessity of user interface concerns besides the well
discussed performance issues.
An organizational perspective on the term user
satisfaction can be found when it comes to the
implementation and usage of an ERP system. Next
to user-centered factors, such as self-efficacy,
experience and perceived usefulness (Mitakos et al.,
2011), additionally the corporate culture, top
management support (Bin et al., 2010), position in
organizational hierarchy and user participation in
the implementation process (Zviran et al., 2005) are
just as well considered to influence user satisfaction.
User interface aspects are not explicitly declared as a
factor that has impact on user satisfaction.
During the system usage, also UI related
considerations on cognitive and dialog factors
emerge. Next to the aspects stated above, the term is
now enriched by navigation, user guidance, visual
factors, minimal memory load and learnability
(Calisir and Calisir, 2004); (Ozen and Basoglu,
2006). Several years ago, (Topi et al., 2005)
interviewed ERP users to identify critical
deficiencies in their system usage. Major difficulties
existed in the identification of and the access to the
right functionality, support in transaction execution,
system output limitations, terminology and finally
the overall system complexity. Although the results
originate from an interview with only ten
participants, the results indicated concrete user
interface deficiencies.
With the aim of identifying heuristics for ERP
usability, (Singh and Wesson, 2009) classified many
of the common usability criteria found in current
research literature. Five major heuristics resulted,
comprising navigation, learnability, task support,
MasteringERPInterfaceComplexity-AScalableUserInterfaceConceptforERPSystems
171

presentation (input and output) and customization.
Examples for potential usability issues assigned to
the heuristic of navigation are “Information is not
easy to find” and “There is no form of guidance
within the system to aid the user when completing a
business process.” Examples for potential usability
issues assigned to the heuristic of presentation are
“Visual layout is too complex.”, “Output is not easy
to understand and interpret.” and “The UI of the
system is not very intuitive.” (Singh and Wesson,
2009)
In a preliminary and regional survey with 58
participants, we investigated ERP systems
concerning the graphical user interface. The study
was focused on small and medium sized enterprises
(SME) in the manufacturing domain in an eastern
part of Germany and was conducted in 2011.
Whereas 70.0% of the interviewed participants
attested a high functional satisfaction of their ERP
system, significant potentials for improvements
existed with respect to adequate information
presentation. The available interfaces often do not
meet the user’s current needs for task-oriented views
and an appropriate level of detail. Depending on the
ERP system and business branch, various interface
elements are available. Due to its versatility, the
table is the most prevalent type to present
information (90.9%), whereas form-like layouts
were also found very frequently (81.8%). In
contrast, topological and time-based visualizations
such as floor plans and process views in terms of
network diagrams as well as three-dimensional
views have been significantly less mentioned. To
gain a further insight into concrete UI requirements,
the participants were given the choices described in
table 1 below.
The survey revealed that a major problem can be
seen in the task-oriented visualizations (75.0%). In
comparison with the little availability of alternative
visualizations in current ERP applications, this
might be one of the reasons for the high
responsiveness. The fixed presentation type of
enterprise data seems to be insufficient to fulfill the
user’s need of changing the visualization type when
necessary. Similar results have been observed for the
paradigm of detail and overview (59.4%). Current
ERP systems seem to support this aspect
inappropriately, as they offer a fixed and quite
detailed view on the enterprise data (e.g. in a table or
form). These two usability problems of inappropriate
visualization and level of detail have a significant
impact on the graphical user interface. Furthermore,
these problems directly affect accessing the
enterprise information and therefore need special
attention in future research. The remaining aspects
of faceted browsing & semantic search (34.4%), 3D-
views on processes and facilities (25.0%) and
especially multi-touch devices (9.4%) received
significantly less acceptance.
2.2 Reducing ERP Complexity
In current research, three main strategies for coping
ERP complexity exist. The first approach is based on
user guidance during a transaction by utilizing
concepts such as recommending the next steps, auto-
completion of input fields, highlighting mandatory
content or displaying help instructions for error
prevention and treatment. As the complexity remains
constant in this case, the user is less confused and
more confident because of the assistance in
questions of interaction. In most cases, the assistance
is implemented as an additional window or interface
region on top of the underlying standard ERP
system. A second strategy to cope with the
complexity of ERP interfaces is the simplification of
Table 1: A brief description of the choices, which have been supposed to improve the UI and its usage.
Tas
k
-oriented Visualizations
The system offers several visualization types of a process or system state. Examples
are listings (table), network diagrams and floor plans.
D
etail and Overview
It is possible to adjust the level of detail from a fine-grained view to an aggregated
overview and vice versa.
F
aceted Browsing & Semantic
Search
Input of letters or words results in a listing of semantic or textual equivalent items
found in the system. The concept of faceted browsing allows for refining the results
(by category, date, department, priority...)
3D-Views on Processes
and Facilities
Current and upcoming system states and processes are illustrated with the help of
3D-visualizations. Examples for such process information are fill levels, durations,
downtimes and alert situations.
M
ulti-touch Devices
System interaction is supported by touch-sensitive and sensor-equipped devices. The
interaction supports multiple inputs.
ICEIS2013-15thInternationalConferenceonEnterpriseInformationSystems
172

the displayed content itself. This strategy reduces the
UI functionality according to the user role or other
context information. In this case, the guidance is not
explicitly focused but the complexity is reduced to
an amount that the user is able to understand. The
third strategy is based on similarity and utilizes well
known patterns that the user knows from different
standard applications or other domains.
Although these strategies are very powerful in
reducing ERP interface complexity, they can only
make a contribution to minimize the user’s time
spent on learning how to transfer his or her domain
and process knowledge to the ERP system. As most
of the training time is caused by exactly this
mapping from domain knowledge to transaction
identification and execution, the reduction of ERP
interface complexity is an essential precondition for
intuitive ERP systems.
2.2.1 User Guidance
A first example of user guidance is the adaptive
navigation support (ANS) introduced by
(Supulniece, 2012). The proposed ANS meta-model
complements existing models for the development
of user adaptive enterprise applications (UAEA).
Therefore, it comprises several sub-models to
describe the end-user, his or her goals and
expectations, the changing object (trigger of
adaptation), the adapted object itself +and the
adaptation algorithm. The supporting capabilities
address a broad scope which covers process
execution overview, navigation, information,
problem prevention and error handling. The ANS
recommendation system resides next to the standard
functionality in the UI of an ERP and offers links to
recommended next steps, mandatory activities or
already executed forms.
A second example of user guidance is the
history-based playback mechanism from (Babaian
and Lucas, 2012). Assuming that available help
mechanisms in ERP systems are too generic for
concrete user questions regarding enterprise-specific
interaction issues, a log-based playback mechanism
is proposed. The prototype replays interaction
sequences in real-time according to previously
generated usage log data. This approach results in a
more flexible and low-cost alternative to pre-
recorded and generic tutorials or other types of
support.
2.2.2 Content Simplification
Decreasing the complexity by reducing the content
of a system’s interface, such as masking irrelevant
form fields or offering limited functionality
according to context information, is a second major
strategy to handle ERP complexity. In their research
on ephemeral adaptation for ERP menus, (Findlater
et al., 2009) follow the approach of content
reduction by gradually fading-in menu items, which
are predicted to be less important. In contrast, most
important entries are presented right from the
beginning. By gradually revealing the variety of
available items, the user is enabled to easily identify
the high priority functionality immediately. In
particular, this approach involves a temporal
dimension to reduce the user’s cognitive workload.
Investigations regarding the complexity of an
ERP system interface have been recently undertaken
by (Parks, 2012). Substituting an existing standard
ERP UI, a simpler version has been designed to
compare the effects on task success and time
consumption with the traditional user interface. With
the help of an inventory use case, the authors
discussed the question: “What impact does the
complexity of ERP interfaces have on end-user
success and task time while completing a
transaction?” The results for this distinct use case
stated that “complexity was a significant variable
only for time spent working on the task, not success”
(Parks, 2012)
2.2.3 Similarity
The concept of similarity uses well known or de-
facto standards to familiarize the user with the
(probably new or rarely used) ERP system. The
interface has to be at least partially adapted from
another application that most users already learned
to use. The similarity might cover the visual
appearance, grouping of functionality or the
procedure to execute a distinct functionality. One
example for this strategy is Microsoft Dynamics™
which uses the appearance of the Office Suite
(Microsoft Corporation, 2013), which many users
are familiar with.
2.3 Visual Information Presentation
in Enterprise Applications
In (Parush et al., 2007), the hypothesis has been
corroborated, that “graphical visualization can
improve the performance of the human operator
using ERP systems for supply chain management”.
Therefore, the original display design of a
commercial ERP system has been compared with a
prototype which offered radial hyperbolic tree and
tree map visualizations next to the standard table
MasteringERPInterfaceComplexity-AScalableUserInterfaceConceptforERPSystems
173

form. Although the findings date back to 2007, they
revealed, that for “experienced and inexperienced
users, hyperbolic tree and tree maps graphical
visualizations improved performance”. These results
indicated promising potentials of visual information
presentation in native ERP environments.
Pioneering research in the field of visual
analytics has been done by (Card et al., 1999, p.6),
who classified user objectives into exploration,
discovery, explanation and decision making. (Yi et
al., 2007) complemented this research by
introducing primary interactions on information sets
such as filter, connect, select, reconfigure, encode or
detail. The domain of visual analytics is already an
important part of distinct enterprise applications and
in particular in the field of Business Intelligence
(BI). Especially for the domain of BI, several
solutions exist, which offer innovative visualizations
and direct interaction. (Tableau Software, 2012)
However, (Wang et al., 2011) state that “most
domain analytical practices generally vary from
organization to organization. This leads to diverse
designs of visual analytics systems in incorporating
domain analytical processes, making it difficult to
generalize the success from one domain to another.”
This problem is addressed by their proposed design
framework for visual analytics systems in
organizational environments. Herein, the Design
Artifacts Specification is also facilitated which
consists of visualization and interaction
combinations.
3 MOTIVATION
FOR A PARADIGM CHANGE
The non-exhaustive overview of related work
intended to briefly present relevant fields of ERP UI
research. It discussed strategies to reduce the
interface complexity as well as research on visual
information presentation. On the one hand, it can be
concluded that many efforts have been done to guide
the user through his or her current transaction and to
avoid handling errors. On the other hand, visual and
interactive information presentation is already an
essential part of specific enterprise applications
(such as BI), although it is not an essential “core
feature” of standard ERP systems.
The section on user satisfaction and usability
revealed, that the overall system complexity, user
guidance, identification of and the access to the
right functionality, availability of task-oriented
visualizations and detail and overview are essential
user interface challenges in ERP today. The
subsequent presentation of strategies to cope with
the interface complexity as well as the visual
information presentation already addressed these
deficiencies and proposed promising solutions.
However, the authors argue that there is still a niche
which has not been investigated so far. Whereas user
guidance as well as visual information presentation
are considered side by side in current research, the
conjunction of both strategies is not addressed. Since
both aim at reducing complexity and offer a more
intuitive and friction-free system access, their
conjunction could lead to an even better UI design.
The following section discusses two barriers in
current ERP interface design, which motivate the
establishment of the abstract interface model
presented in section 4.
A first major barrier can be seen in the absence
of a navigation guide, which not only leads the user
from one sequential transaction step to the next, but
also from an initial overview to the final place of
editing and execution. As introduced by
(Shneiderman, 1998), this navigation path covers
“Overview first, zoom and filter, then details on
demand.” This visual information seeking mantra
has not been applied to standard ERP systems so far,
and results in very limited capabilities to adjust the
level of detail. The adaptation of the level of detail
and therefore the adjustment of complexity is one of
the user needs identified in section 2.1. Hence,
current systems seem to lack a hierarchical user
interface guide, which actively supports the
navigation from overview to detail and vice versa.
This guide has to utilize mechanisms such as
abstraction, aggregation and reduction to achieve
orientation as well as detailing and selection to
achieve editing and execution.
A second barrier can be seen in the limited set of
available visualizations (see “layouts” and “UI
controls” in (Blankenship, 2008) as an example).
Current ERP systems rely on tables, lists, tree and
context menus, forms and standard diagrams. While
tables and forms are extremely appropriate to
visualize explicit values and to allow for quick
editing, they have limited capabilities to illustrate
complex processes, correlations, consequences,
dependencies, states or other types of implicit
information. “In general, since data in ERP systems
is highly structured, it lends itself to be presented
better graphically.” (Parush et al., 2007) In
consideration of the huge variety of visualization
types known in other domains today (cp. (Lima,
2012)), the limited set of UI elements in ERP
systems is insufficient. Furthermore, existing and
classifying databases for visualizations could be
ICEIS2013-15thInternationalConferenceonEnterpriseInformationSystems
174
easily used to obtain appropriate and task-oriented
interface elements with ease (e.g. (Keck et al.,
2011)). Therefore, current ERP systems seem to lack
extended visualization capabilities, since most of the
available screens are too detailed, inflexible and
utilize only a fractional amount of current UI
potentials.
The authors assume, that existing usability
problems are significantly related to the user
interface and especially to these two barriers.
Nowadays, users are already familiar with
innovative devices and applications in their spare
time, which offer rich visualization and interaction
capabilities. In contrast, users are facing complex,
inflexible and often outdated UIs at work. The
hierarchical assistance in the form of an adaptive
and scalable user interface to adjust the level of
detail as well as the involvement of appropriate
visualizations to compare, explore and process
enterprise information could be able to overcome
current deficiencies.
4 TOWARDS AN ABSTRACT
INTERFACE MODEL
Examining the UI structure of ERP systems from an
interface designer’s point of view, common patterns
emerge. While most ERP systems seem to appear
quite different at first sight, commonalities in the
user objectives and the corresponding visual
modality become apparent. The user objectives can
be classified into three abstraction layers, reaching
from orientation and overview to search and filter
and finally ending up in editing and execution.
While the first layer gives an overview of available
functional categories of the system, the second layer
is focussing on a distinct information subset (e.g.
ERP modules for production, finance or customer).
Herein, the set of domain items can be textually
searched and filtered to identify an item or subset of
interest. The third layer is even more tailored
according to a selected business item type and
allows for editing the object’s properties and status
parameters.
4.1 Visual Modalities
Visual modalities present the enterprise information
in a distinct manner and are related to one of the
user’s objective layers described above. The first
visual modality, which corresponds to the objective
of orientation and overview, offers access to a
functional category primarily in the form of a list,
tree, or (hierarchical) menu. By selecting one of the
items herein, the user accesses the second layer and
its visual modality. This layer presents the desired
domain content (e.g. production orders) for the user
objective search and filter. As one of the most
generic visualizations, this second layer uses mostly
tables to present the items in rows and their
properties in columns. In addition, textual search and
filter mechanisms assist the user in finding the right
business item(s). By selecting one of these items, the
third layer and its visual modality will be entered
and enables the user to view and edit all item and
status parameters in a form.
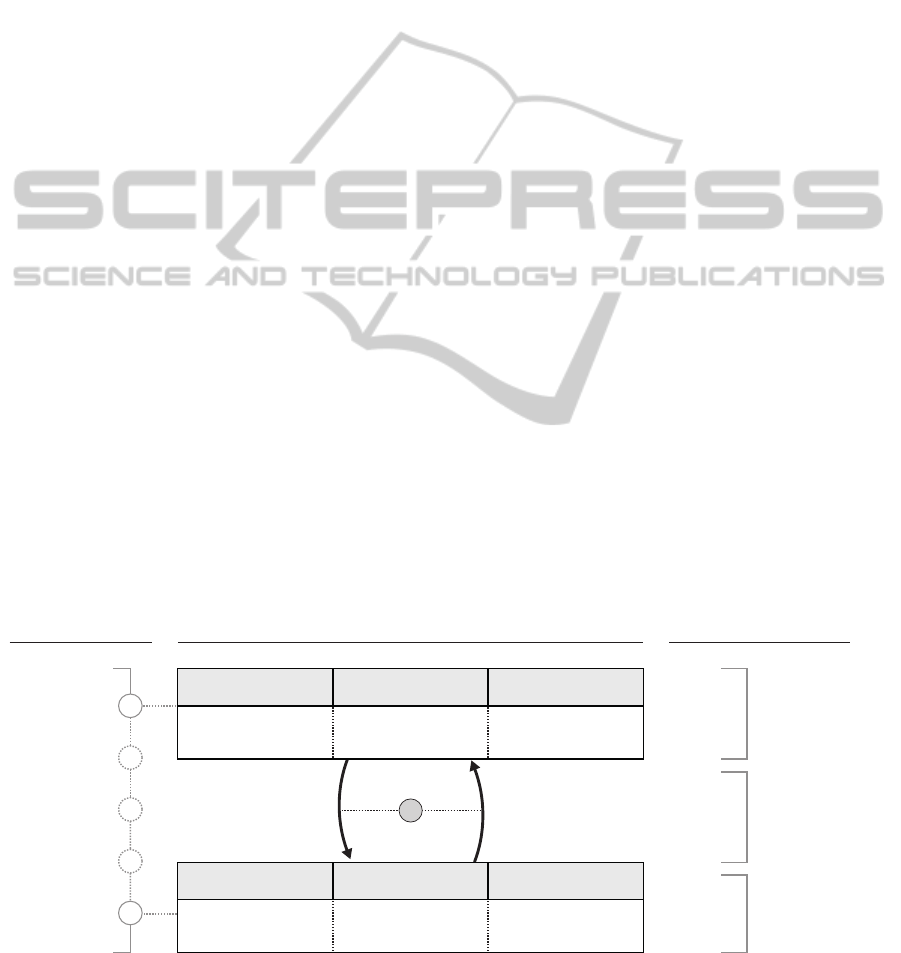
Summarizing, the characteristics of the three
Layers are evolving from the user’s intention of
orientation to the intention of execution. Figure 1
summarizes the findings and illustrates the proposed
abstract interface model. It relates the abstract user
objectives and interactions from (Card et al., 1999,
Figure 1: Proposed abstract user interface model covering the levels of abstraction (left), the related user interactions from
(Yi et al., 2007)
1
and abstract user objectives from (Card et al., 1999, p.6).
2
Orientation
Execution
Intermediate
levels of
abstraction
A
category view wide very low
Modality
Scope Level of detail
item editing narrow very high
Modality
Scope Level of detail
Explore
Filter
Compare
Select
Evaluate
Execute
Decision
Making
Discovery
Encode
Explanation
1
Reconfigure
1,2
1
1
1
Connect
Detailing
11
Elaboration
Abstraction
Aggregation
1
2
2
2
Abstract user objectivesUser interface layer Layer characteristics
MasteringERPInterfaceComplexity-AScalableUserInterfaceConceptforERPSystems
175

p.6)and (Yi et al., 2007) presented in section 3 to the
proposed UI layers. The characteristics of these
layers are described by the modality, the scope of
the information and its level of detail. The main
concept aims to pick up the user by a general and
less complex interface to ease the initial system
access. After the user has been familiarized with the
available categories, a drill-down is executed to
reveal additional, but more specific items and
operations. The authors assume, that the appliance of
mechanisms such as detailing and abstraction, and
especially the encoding and reconfiguring based on
innovative visualization types are suitable to cope
with the complexity of current ERP systems (see
Figure 1, A). The adaptation mechanism addresses
the content, appearance, amount and composition of
the ERP information. According to (Yi et al., 2007),
the interaction across the diverse layers covers:
Select: mark something as interesting
Explore: show me something else
Reconfigure: show me a different arrangement
Encode: show me a different representation
Abstract/Elaborate: show me more or less detail
Filter: show me something conditionally
Connect: show me related items
Hence, the authors propose to extend the meanings
of UI adaptation beyond the concepts discussed in
section 2.2, which was focused on dialog-based user
guidance, content reduction and similarity. Whereas
concepts in the related work addressed the
adaptation of the content by manipulating the
amount of interface items, also the adaptation of the
appearance and its composition should be
considered.
5 SUMMARY & FUTURE WORK
This paper argued a niche in usability research of
ERP systems regarding the graphical user interface.
The enormous number of industry branches and
users that are affected by usability problems has
motivated the further research in this paper. Selected
understandings of the term user satisfaction were
presented and the subsequent section highlighted
concrete usability problems in the field of ERP. The
section “Reducing ERP complexity” presented
promising solutions to cope with the complexity of
ERP user interfaces. The subsequent abstract
interface model addressed two barriers in current
ERP UI design, namely the hierarchical user
interface guide (from overview to execution) and
enhanced visualization capabilities (esp. the
appliance of rich visual interfaces adapted from
related fields such as information visualization and
visual analytics). This research is not fully
accomplished and therefore cannot present a proof
of concept yet. As further research is required, it will
focus on the intuitive implementation of the
“vertical” UI guide and the identification of
appropriate visualizations to bridge the gap between
the layer of overview and the layer of detail. Finally,
it can be concluded, that future ERP systems could
offer two major improvements related to the user
interface:
Offering a hierarchical (“vertical”) UI guide
besides existing guidance approaches (for
“horizontal” dialog steps). Especially untrained
users are uncertain about available functionality
and face a level of detail that might be too high for
their current objective. By offering a simplified
and aggregated entry point to the system, which
extends and concretizes its features, users are
enabled to discover the subsequent (and more
detailed) layers on their own.
Extending the visual capabilities and enhance the
appropriateness for complex correlations of ERP
information. Experienced users who are aware of
the underlying business processes are concluding
decisions based on their knowledge and mental
model. Especially untrained users are often
unaware of potential side-effects which might
result in operating errors and uncertainty. The
mapping of the user’s process and domain
knowledge to system operations and information
can be enhanced by the utilization of innovative
and up-to-date visualization and interaction
techniques.
To achieve these ambitious goals, a prototypical
framework has been designed which is based on the
Silverlight/ .NET platform and programmed in C#. It
allows for the definition of the scalable user
interface and comprises the specification of layers,
their type of visual content (table, map, circular
diagram etc.) and the transitions between these
layers (esp. semantic changes). The data can be
acquired from several types of data source and
combined according to defined join operations. With
the help of an editor, the visualization and data
layers are mapped on each other to specify the final
user interface and its composition, behavior and
appearance.
ICEIS2013-15thInternationalConferenceonEnterpriseInformationSystems
176

ACKNOWLEDGEMENTS
Christian Lambeck would like to thank
the European Union and the Free State
of Saxony/ Germany for funding this
work. Special thanks are also due to
Maria Piechnick, Thomas Lambeck
and Frank Förster for their enthusiastic
participation.
REFERENCES
Babaian, T. and Lucas, W. T. (2012). Leveraging Usage
History to Support Enterprise System Users. In: ICEIS
(3), 2012, p.35–44.
Bin, W., Chu-hong, Z., Qiong-yu, H. and Zhen-peng, L.
(2010). Empirical research on the factor of ERP’s user
customer satisfaction based on triadic reciprocal
determinism. In: Proceedings of the International
Conference on Management Science and Engineering
(ICMSE) 2010, November 2010, IEEE, p.58–66.
Blankenship, E. (2008). SAP Design Guild - SAP’S
Visual Design Vision and Mission. [Online].
Available at: http://www.sapdesignguild.org/
resources/print_visualdesign_strat.asp [Accessed: 4
December 2012].
Calisir, F. and Calisir, F. (2004). The relation of interface
usability characteristics, perceived usefulness, and
perceived ease of use to end-user satisfaction with
enterprise resource planning (ERP) systems.
Computers in Human Behavior, 20 (4), p.505–515.
Card, S. K., Mackinlay, J. D. and Shneiderman, B. (1999).
Readings in information visualization : using vision to
think. San Francisco, Calif.: Morgan Kaufmann
Publishers.
Falk, M. (2012). SAP Product Roadmap - SAP User
Interfaces. SAP AG. [Online]. Available at:
http://www.sdn.sap.com/irj/scn/go/portal/prtroot/docs/
library/uuid/1036f12f-0aab-2e10-29ac-f0a733a16214?
QuickLink=index&overridelayout=true&5398773892
7730.
Findlater, L., Moffatt, K., McGrenere, J. and Dawson, J.
(2009). Ephemeral adaptation: The Use of Gradual
Onset to Improve Menu Selection Performance. In:
2009, ACM Press, p.1655.
Intelligent systems solutions GmbH. (2011). ERP User
Satisfaction Survey: Summary. Zurich.
Keck, M., Kammer, D., Koalick, G., Iwan, R., Taranko, S.
and Wuttig, D. (2011). DelViz - Deep exploration and
lookup of Visualizations. see conference #6,
Wiesbaden.
Keim, D. A., Kohlhammer, J., Ellis, G. and Mansmann, F.
(eds.). (2010). Mastering The Information Age -
Solving Problems with Visual Analytics.
Eurographics.
Lima, M. (2012). visualcomplexity.com | A visual
exploration on mapping complex networks. [Online].
Available at: http://www.visualcomplexity.com/vc/
[Accessed: 10 February 2012].
Microsoft Corporation. (2013). User Experience
Guidelines for Microsoft Dynamics NAV 2013.
[Online]. Available at: http://msdn.microsoft.com/en-
us/library/jj128065(v=nav.70).aspx [Accessed: 2
March 2013].
Mitakos, T., Almaliotis, Ioannis and Demerouti, Anna.
(2011). An Auditing Approach for ERP Systems
Examining Human Factors that Influence ERP User
Satisfaction. Informatica Economica, (14), p.78–92.
Ozen, C. and Basoglu, N. (2006). Impact of Man-Machine
Interaction Factors on Enterprise Resource Planning
(ERP) Software Design. In: Technology Management
for the Global Future, 2006. PICMET 2006, 5, 2006,
p.2335 –2341.
Parks, N. E. (2012). Testing & quantifying ERP usability.
In: Proceedings of the 1st Annual conference on
Research in information technology (RIIT), 2012,
Calgary, Alberta, Canada: ACM Press, p.31–36.
Parush, A., Hod, A. and Shtub, A. (2007). Impact of
visualization type and contextual factors on
performance with enterprise resource planning
systems. Computers & Industrial Engineering, 52 (1),
p.133–142.
Ragusa, C. and Puliafito, A. (2011). Running business
applications in the cloud: a use case perspective. In:
Proceedings of the 2010 conference on Parallel
processing, Euro-Par 2010, 2011, Berlin, Heidelberg:
Springer-Verlag, p.595–602.
SAP AG. (2012). SAP Design Guild -- R/3 History in
Screen Shots. [Online]. Available at: http://www1.
sapdesignguild.org/goodies/r3_history.asp [Accessed:
27 February 2012].
Seth, A., Agarwal, H. and Singla, A. R. (2011). Designing
a SOA based model. ACM SIGSOFT Software
Engineering Notes, 36 (5), p.1–7.
Shneiderman, B. (1998). Designing the user interface :
strategies for effective human-computer-interaction.
Reading, Mass: Addison Wesley Longman.
Singh, A. and Wesson, J. (2009). Evaluation criteria for
assessing the usability of ERP systems. In: 2009, ACM
Press, p.87–95.
Supulniece, I. (2012). Adaptation Algorithm for
Navigation Support in User Adaptive Enterprise
Application. In: Proceedings of the 4th International
Conference on Adaptive and Self-Adaptive Systems
and Applications (ADAPTIVE 2012), 2012, France,
Nice.
Tableau Software. (2012). Tableau Server. [Online].
Available at: http://www.tableausoftware.com/
[Accessed: 8 December 2012].
Tertilt, D. and Krcmar, H. (2011). Generic performance
prediction for ERP and SOA applications. In:
Tuunainen, V. K., Rossi, M. and Nandhakumar, J.
(eds.), ECIS, 2011.
Topi, H., Lucas, W. T. and Babaian, T. (2005). Identifying
Usability Issues with an ERP Implementation. In:
Proceedings of the International Conference on
Enterprise Information Systems (ICEIS), 2005,
MasteringERPInterfaceComplexity-AScalableUserInterfaceConceptforERPSystems
177

p.128–133.
Wang, X., Dou, W., Butkiewicz, T., Bier, E. A. and
Ribarsky, W. (2011). A two-stage framework for
designing visual analytics system in organizational
environments. 2011, IEEE, p.251–260.
Yi, J. S., Kang, Y. ah, Stasko, J. and Jacko, J. (2007).
Toward a Deeper Understanding of the Role of
Interaction in Information Visualization. IEEE
Transactions on Visualization and Computer
Graphics, 13 (6), p.1224–1231.
Zviran, M., Pliskin, N. and Levin, R. (2005). Measuring
user satisfaction and perceived usefulness in the ERP
context. Journal of Computer Information Systems, 45
(3), p.43–52.
ICEIS2013-15thInternationalConferenceonEnterpriseInformationSystems
178
