
Using Discrete-Event Simulation to Forecast the Volume of Hospital
Emergency Services to be delivered at the Regional Level
Bożena Mielczarek
Institute of Industrial Engineering and Management, Wrocław University of Technology,
Wybrzeże Wyspiańskiego 27, Wrocław, Poland
Keywords: Discrete-Event Simulation, Hospital, Emergency Departments, Demand.
Abstract: This paper describes a discrete-event simulation model to estimate the volume of services to be provided by
emergency departments located in one sub-region of Lower Silesia, the southernmost province in Poland.
Forecasts of the predicted categories of services to be delivered in the following year in emergency
departments in the region are formulated based on the simulated demand level. The process of input data
analysis is described in detail, and basic assumptions for the simulation model are formulated. The results
provide some insights into the relation between sub-regional demographic trends and population needs in
relation to hospital emergency arrivals.
1 INTRODUCTION
This paper presents a discrete-event simulation
model (DES) to forecast the next year’s volume of
services to be delivered in hospital admission units
(AU) and hospital emergency wards (EW) located in
one sub-region of Lower Silesia, Poland, to cover
the demand for emergency medical treatment
directed to the AUs/EWs located in the area.
Simulation methods have been used to
successfully analyse the healthcare industry for
many years and different taxonomies of healthcare
simulation models have been proposed by many
authors. Jun et al. (1999) surveyed the application of
simulation models in two domains: patient flow and
allocation of resources. Fone et al. (2003) found that
simulation modelling was used to study a broad
range of healthcare issues including hospital
scheduling, communicable disease, screening, costs
of illness and economic evaluation. Brailsford et al.
(2009) proved that simulation methods are dominant
in planning and system/resource utilisation. Based
on the study conducted by Hulshof et al. (2012),
who focused on resource capacity planning and
control decisions in healthcare, it may be concluded
that computer simulation is applied on each level of
hierarchical decision making (strategic, tactical and
operational) to support every type of healthcare
services (ambulance, emergency, surgical, inpatient,
home and residential).
Mielczarek and Uziałko-Mydlikowska (2012a)
observed that DES is the most common modelling
technique among the different simulation approaches
applied to health services. This method proved to be
an effective tool in the study of complex systems
characterised by uncertain and variable demand, an
unpredictable nature of acute events, and a high
level of human factors. DES is well-suited to
addressing problems in emergency departments,
where the arrivals of patients are highly variable,
resources are scarce, and human involvement in the
performance of systems is significant. This article
attempts to evaluate the capabilities of using the
DES approach when shaping short-term health
policy strategies on the regional level in relation to
the services delivered in AUs/EWs.
In Poland, hospital services are offered to
elective and emergency patients. AUs and EWs
serve as the points of admission where the patient is
qualified for hospital care and, if necessary, medical
treatment is given. AUs/EWs are obliged to serve
every patient who arrives with an acute condition.
Both types of emergency units provide consultancy
and basic medical interventions. EWs may
additionally perform the medical treatment
necessary to stabilise vital functions. Both the AU
and the EW may, after the consultation, qualify the
patient for further hospital treatment.
The total prior-year demand registered in the
hospital AU/EW is one of the main factors
197
Mielczarek B..
Using Discrete-Event Simulation to Forecast the Volume of Hospital Emergency Services to be delivered at the Regional Level.
DOI: 10.5220/0004583601970203
In Proceedings of the 3rd International Conference on Simulation and Modeling Methodologies, Technologies and Applications (SIMULTECH-2013),
pages 197-203
ISBN: 978-989-8565-69-3
Copyright
c
2013 SCITEPRESS (Science and Technology Publications, Lda.)

considered by National Health Fund (NFZ) when
negotiating future contracts. The goal of this paper is
to use a discrete event simulation to estimate the
next year’s demand for hospital emergency services
in the region. This, in turn, will help forecast the
volume of services to be contracted with providers
to cover the future needs of the population.
2 LITERATURE REVIEW
The substantial AU/EW simulation literature has
focused on the patient flows and throughput times
inside emergency departments (ED). Some authors
also incorporate the issue of staff scheduling.
Duguay and Chetouane (2007) used the DES model
to reduce patient waiting times and improve service
delivery in an ED in a regional hospital in Canada.
Based on simulation experiments, the authors
formulated a number of qualitative suggestions.
Ahmed and Alkhamis (2009) integrated simulation
with optimisation to analyse patient flows and
evaluate different staffing distributions. They were
able to find the optimal number of ED staff members
to maximise patient throughput and reduce patient
waiting time. Paul and Lin (2011) utilised the DES
model to identify the main causes of reduced ED
throughput. Zeng et al. (2012) used a discrete
simulation to improve the quality of care at an ED.
A simulation-based decision support system to assist
with planning processes in EDs was presented by
Abo-Hamad and Arisha (2013). The authors tested a
number of scenarios, e.g., variation in medical
staffing and “zero-tolerance” policy regarding
exceeding a 6-hour boarding time. They were able to
define the factors that have a great impact on
reducing the average lengths of stays.
Patient flows and staff scheduling are the
elements of a more complex problem, i.e.,
emergency department overcrowding. Because all
ED patients must be provided with medical
assistance, overcrowding is a serious problem and
simulation has proven to be an effective tool to
improve system performance. Paul and Reddy
(2010) searched the ED simulation literature from
1970 to 2006 and found 43 papers that modelled the
EDs and performed computer simulations. The
majority of the models were stochastic and the
preferred modelling technique was discrete event
simulation. Based on the review, the authors
discussed useful insights into the problems of ED
crowding. They were also able to list important
limitations that had to be addressed by future
simulation models.
In most published papers, the object under study is
an isolated ED unit and the goal is to improve the
unit’s internal processes. These models concentrate
on the current work of EDs, try to identify the causes
of overcrowding and suggest strategies to overcome
them. Our approach may be defined as upper-level
strategic modelling because it concerns the broader
issue of covering the demand for hospital emergency
services in an entire region. Our work makes the
following contributions. First, we try to forecast the
next year’s demand for hospital emergency services
to be met by all EDs in the region. Second, we
estimate the expected volume and structure of the
services to be delivered by particular EDs to cover
the next year’s emergency needs separately for every
ED. The general idea behind the study was described
in (Mielczarek and Uziałko-Mydlikowska, 2012b).
3 REGIONAL EMS SYSTEM
Lower Silesia is the fourth largest region in Poland.
It is divided into 5 sub-regions, 29 administrative
districts and 169 communes. The capital of the
region is Wroclaw, which is a large academic and
industrial centre. In 2010, there were 91 hospitals
located in the area with 39 AUs and 13 hospital
EWs. Our study concerns the services offered in
2010 by AUs and EWs located in 2 (of a total of 5)
sub-regions. These 2 sub-regions are referred to in
the paper as the Wrocław Region (WR). This area
encompasses the capital of Lower Silesia (Wrocław)
and 8 other nearby districts (for a total of 9 districts).
In 2010, 12 AUs and 5 EWs operated in WR.
Data for the study were obtained from the NFZ
regional branch in Wrocław for the year 2010. Two
basic data sets were analysed. The first included
information on 183,517 emergency visits by patients
residing in WR who arrived in AUs/EWs located in
the Lower Silesia area. The records from the second
data set revealed 201,636 patients with any
residence codes who were registered in AUs/EWs
deployed in the WR. To protect anonymity, personal
data were deleted from the files.
Regionalisation is not employed in the Polish
healthcare system. This means that patients can
decide where to go for medical assistance. In most
cases, the neighbourhood hospital is selected.
However, to properly estimate the next year’s
demand for hospital emergency services with regard
to WR units, we had to consider patient choices for
the place of treatment.
SIMULTECH2013-3rdInternationalConferenceonSimulationandModelingMethodologies,Technologiesand
Applications
198
4 MODEL DESCRIPTION
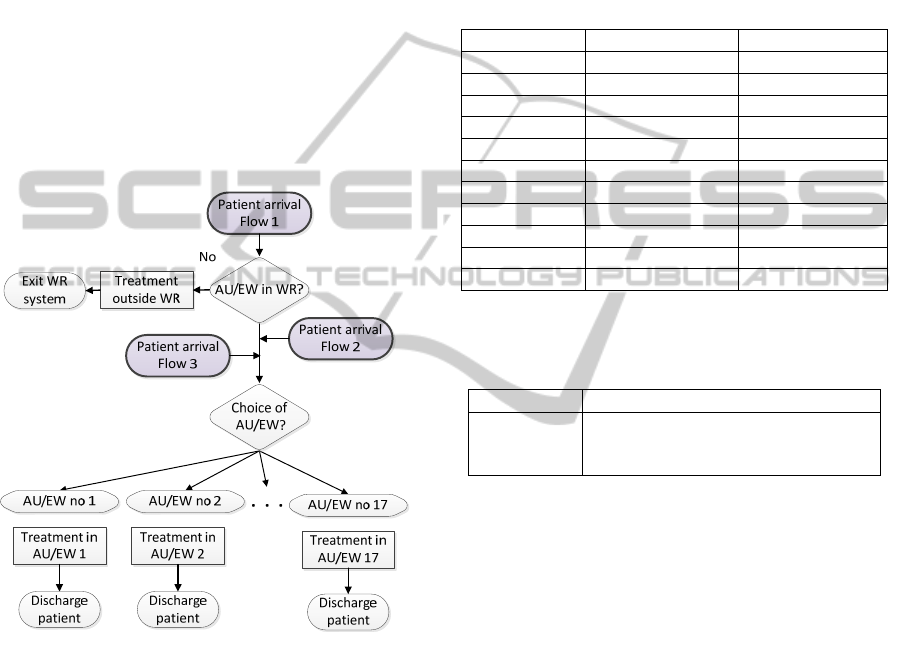
4.1 Patient Flows
The analysis of the historical demand for hospital
emergency services allowed us to identify 3 main
sources of emergency patients arriving at 17
AUs/EWs in WR (see Figure 1):
Flow 1. Patients who are residents of 9 WR districts.
In most cases, these patients select one of 17
AUs/EWs located in WR but sometimes, hospitals in
another sub-region of Lower Silesia are preferred.
Flow 2. Patients who are residents of Lower Silesia
outside WR. These patients may sometimes select
AUs/EWs located in WR.
Flow 3. Patients who reside outside Lower Silesia
and select AUs/EWs located in WR.
Figure 1: Flowchart of patient flows in the WR emergency
system.
The patient arrivals were modelled as dynamic
random Poisson processes according to exponential
distributions with time-varying parameters. There
are 11 input patient flows in total: 9 distributions
describing incoming patients from 9 WR districts, 1
distribution describing patients from Lower Silesia
(people resident in districts outside WR), and 1
distribution describing all other patients. The
parameters were defined according to the results of
the historical data analysis and depend on the
calendar month. Table 1 presents a fragment of the
arrival parameters estimated according to the 11
input flows and 12 calendar months. Each parameter
describes the average number of patients per hour.
The flows fluctuate considerably depending on the
calendar month: more arrivals are observed in the
summer whereas fewer patients register in the
winter.
Patients residing in WR may select AUs/EWs
outside WR and an additional random distribution
was applied to model this process; see Table 2.
Table 1: Average number of patients per hour: a fragment
of input arrival parameters from among 12 annual values.
District Minimum value Maximum value
Lower Silesia 0.92 (December) 1.30 (February)
outside LS 1.17 (January) 1.60 (June)
District 1 0.25 (December) 0.34 (April)
District 2 1.07 (April) 1.71 (June)
District 3 0.35 (January) 1.95 (June)
District 4 0.21 (December) 1.28 (July)
District 5 0.30 (October) 1.08 (March)
District 6 0.89 (January) 1.31 (June)
District 7 0.48 (January) 0.71 (June)
District 8 1.56 (January) 2.22 (March)
District 9 11.23 (January) 14.27 (June)
Table 2: Distribution of daily number of emergency
patients (in %) residing in WR who select an AU/EW
outside WR.
Gamma Test statistics
β = 0.00385
α = 5.47
Square Error = 0.002523
Chi Square p-value = 0.357
Kolmogorov-Smirnov p-value > 0.15
4.2 Choice of Hospital
The patients admitted to AUs/EWs located in WR
are defined by the choice of a hospital attribute. This
attribute is strongly correlated with the place of
residence. Patient preferences with regard to the
place of treatment are sampled from 10 discrete
probability distributions. There are 9 discrete
distributions defined for 9 WR districts and 1
separate distribution defined for all other patients.
4.3 Emergency Treatment in AU/EW
The service received directly in AU/EW is described
by the number and type of the performed activities,
called unit products. The patient may, for example,
receive a medical consultation, some medical tests
may be performed for the patient’s benefit or some
medical treatments and interventions may be
provided to the patient. Every unit product is
associated with a unit weight, which is the economic
description of the cost related to the performed
UsingDiscrete-EventSimulationtoForecasttheVolumeofHospitalEmergencyServicestobedeliveredattheRegional
Level
199
activity. For example, the medical examination
activity costs 1 point whereas the image diagnosis
with CT/NMR activity costs 5 points. The total
number of different unit products performed for the
patient’s benefit allows the patient’s category to be
determined. The NFZ defines 5 categories that relate
to the total number of points collected from the
activities performed during the patient’s treatment in
an AU/EW; see Table 3.
Table 3: Patient categories as defined by NFZ.
Category
Overall weight of the
activities
Weight of the
category
Ctg1 1 - 2 1
Ctg2 3 - 4 3
Ctg3 5 - 6 5
Ctg4 7 - 9 8
Ctg5 > 9 10
Discrete random distributions were defined
separately for every AU/EW in WR to generate: (1)
the number of unit products received by every
patient in every ED and (2) the categories patients
are assigned to. Table 4 presents the percentage
parameters used to describe patient categories in
every AU/EW in WR.
Table 4: Percentages of patient categories in 17 AUs/EWs
in WR.
AU/EW Ctg1 Ctg2 Ctg3 Ctg4 Ctg5
Unit 1
79.8% 14.1% 5.7% 0.4% 0.0%
Unit 2
54.3% 36.1% 7.8% 1.5% 0.3%
Unit 3
30.1% 36.5% 18.4% 11.2% 3.9%
Unit 4
47.6% 15.0% 14.2% 13.8% 9.4%
Unit 5
20.4% 34.4% 30.7% 8.4% 6.1%
Unit 6
99.8% 0.2% 0.0% 0.0% 0.0%
Unit 7
90.9% 6.9% 1.7% 0.4% 0.1%
Unit 8
73.1% 21.6% 4.5% 0.6% 0.1%
Unit 9
39.2% 32.6% 20.1% 5.9% 2.3%
Unit 10
64.2% 24.0% 11.3% 0.4% 0.1%
Unit 11
49.4% 21.6% 9.2% 10.0% 9.9%
Unit 12
40.4% 40.5% 14.4% 4.2% 0.6%
Unit 13
36.0% 7.1% 7.1% 18.8% 31.0%
Unit 14
99.1% 0.8% 0.0% 0.0% 0.0%
Unit 15
99.0% 0.9% 0.1% 0.0% 0.0%
Unit 16
46.3% 23.4% 16.4% 9.6% 4.4%
Unit 17
27.7% 26.8% 13.0% 31.7% 0.8%
For example, in Unit 1, patients are usually
assigned to Ctg1 (79.8% of patients) whereas the
most costly category, i.e., Ctg5, was not registered in
this unit (0.0% of the patients). In Unit 13 there is,
on average, a similar number of patients in Ctg1
(36.0%) and Ctg5 (31.0%).
After basic medical treatment is provided in the
AU/EW, the decision regarding whether to send the
patient home or begin treatment in the hospital ward
is made within a few hours. The LOS at AU
parameter is usually equal to 1 day. An EW may,
however, start treatment immediately and keep the
patient for one to a few days. The LOS at EW
parameter is usually equal to 1 or 2 days, but
sometimes patients stay at the EW for a longer
period (3 to 10 days). After the consultation and/or
medical treatment at the AU/EW, the majority of
patients is sent home but a small percentage is
referred to a hospital ward.
4.4 Modelling Approach
The simulation model to trace the patients in the WR
hospital emergency system was conducted using
Arena 14.0 software (Rockwell Automation, Inc.).
The simulation begins in an empty and idle state and
lasts 365 days. There was no need to warm-up the
model because the goal of the simulation is not
related to operational activities or internal queues.
We are interested in the volumes and types of
medical services performed on daily basis for the
benefit of patients in every AU/EW and the
observed output measures do not depend on the
system’s prior performance. Every experiment is
replicated 10 times.
5 SIMULATION RESULTS
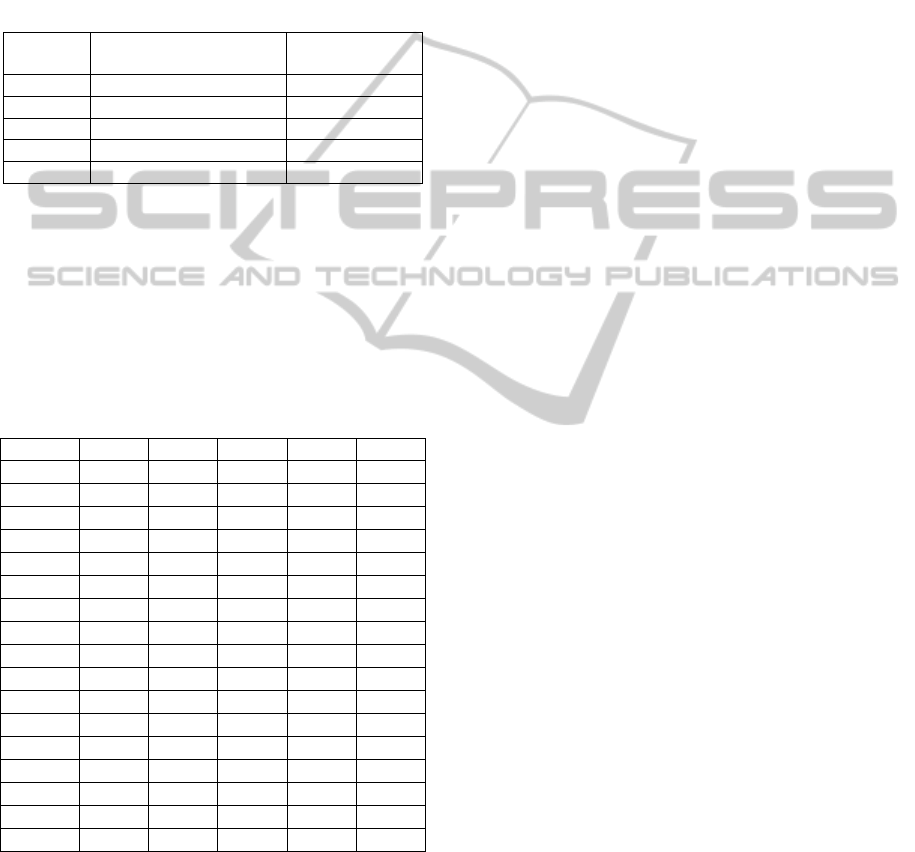
5.1 Verification and Validation
The model has been validated using three
techniques: face validation, hypothesis testing and
historical validation (Law and Kelton, 2000). The
conceptual model and the final results were
discussed with NFZ personnel. The distributions
developed from the historical data were validated
using the Kolmogorov-Smirnov goodness-of-fit test
with a 5% significance level. Then, the simulation
model was used to forecast the annual number of
patients assigned to each category in every AU/EW
based on the fitted arrival parameters. The
simulation output was compared with the historical
values taken from NFZ registries. The absolute
differences between actual and simulated results
range from 0.16% to 11.31% when comparing the
total number of patients served in AUs/EWs and
from 0.47% to 1.29% when comparing the total
number of patients within the patient categories,
(see Figure 2). The average absolute differences
SIMULTECH2013-3rdInternationalConferenceonSimulationandModelingMethodologies,Technologiesand
Applications
200
including 17 units and 5 categories were also
separately calculated for both ranges. The highest
difference is observed for Unit U15. This unit
performs the smallest number of services (the next
unit, U7, performs twice as many services). A more
extensive statistical analysis of the simulation output
compared with the reference standard was
conducted. Based on the validation procedure, it
may be concluded that the simulation model
properly predicts the expected volume of emergency
services directed to 17 AU/EWs within 5 patient
categories.
Figure 2: Absolute differences between simulation results
and historical data in relation to 17 AUs/EWs (U1-U17)
and 5 patient categories (Ctg1-Ctg5).
5.2 Simulation Experiments
A series of scenarios were developed to evaluate the
impact of external demographic trends on future
emergency needs. Each experiment tests changes in
the volumes and structures of hospital emergency
services on two dimensions: (1) in every AU/EW
and (2) across the patient categories.
Scenario 1. The data obtained from NFZ indicate
a slight increase (2.71%) in WR emergency demand
in 2011 compared to 2010 (baseline scenario). The
simulation shows that this increase, which is equally
applicable to every district, is spread irregularly
between AUs/EWs. Units U14, U15 and U17
registered the highest growth in performed services
whereas U2 experienced the most modest growth,
see Figure 3. The lowest increase was observed
among services belonging to Ctg2 (2.20%) and the
highest increase was associated with Ctg4 (2.53%),
see Table 5.
Scenario 2. Demographic data and the analysis of
past demand show that the structure of the
population inhabiting the WR area is changing.
There are districts that register constant population
growth. These are the suburbs of the capital, which
attract young families who decide to leave the city
and move to the outskirts. We tested the impact of a
20.05% increase in demand, according to the actual
trend, in one outskirt district. Small fluctuations are
observed across the region (Figure 4) but the unit
located in this district (U1) will have to face a rapid
increase in the level of demand. The lowest increase
was observed among services belonging to Ctg5
(0.21%) and the highest increase was associated
with Ctg1 (1.84%), see Table 5.
Figure 3: Scenario 1. Increase in the number of services
when total demand increases by 2.71%.
Figure 4: Scenario 2. Observed changes in the number of
services when demand in one of the satellite districts
increases by 20.05%.
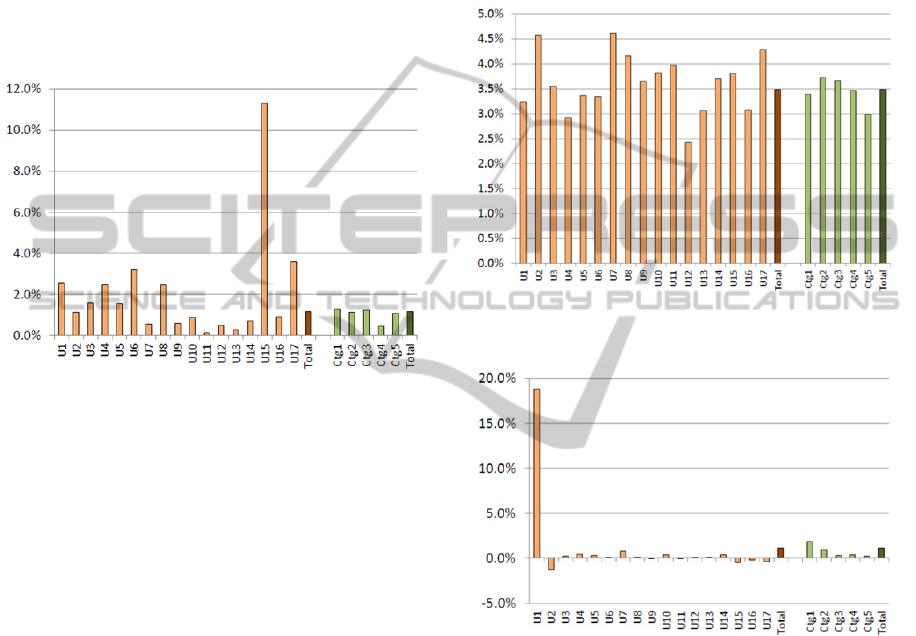
Scenario 3. The population of Wrocław, the
capital of Lower Silesia, has been gradually
decreasing since 2006. We tested the impact of a
0.3% demand decrease in the capital on the services
delivered in 17 AUs/EWs. The majority of units
registered a decrease in delivered services, except
for Units U8, U11 and U13, see Figure 5. The more
detailed analysis shows that the forecasted growth of
0.3% in U11 could be related to the specificity of
this unit, which is classified as a clinical hospital and
deals with the most complicated cases. The decrease
was observed in Ctg1 (-0.18%), Ctg2 (-0.45%), Ctg3
(-0.61%), and Ctg4 (-0.48%), but simulation shows
also the small increase in Ctg5 (0.42%), see Table 5.
UsingDiscrete-EventSimulationtoForecasttheVolumeofHospitalEmergencyServicestobedeliveredattheRegional
Level
201
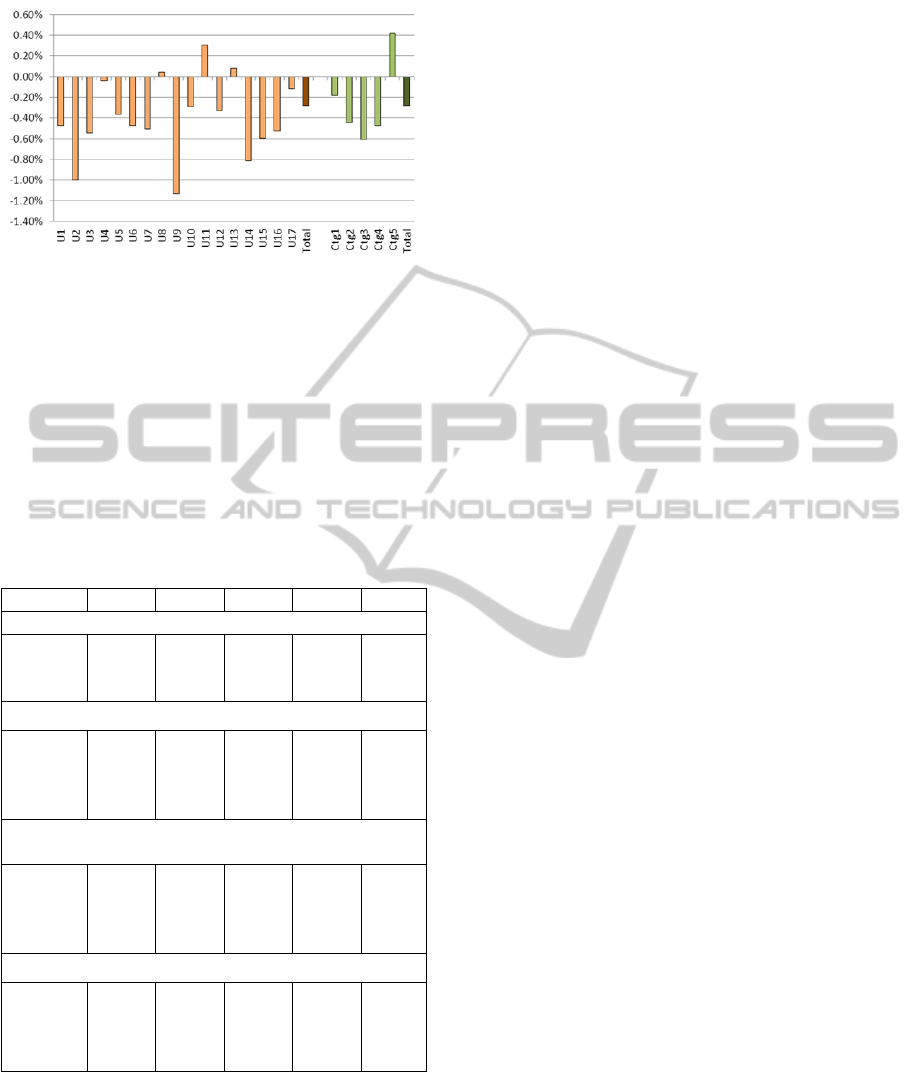
Figure 5: Scenario 3. Changes in the number of services
when demand in the capital decreases by 0.3%.
Table 5 provides some descriptive statistics
obtained using the DES model. The standard
deviations of average number of patients classified
into 5 categories show that the volumes of services
provided within the categories are quite sensitive to
the random demand and differ significantly for
different simulation scenarios.
Table 5: Scenarios 1-3 results. Simulation predictions for
number of services in 5 categories (average values from
10 replications) in comparison with baseline scenario.
Scenario Ctg1 Ctg2 Ctg3 Ctg4 Ctg5
Baseline scenario
demand 93,853 46,164 28,564 17,850 15,287
Std. Dev. 394 296 239 92 91
95% CI 244 183 148 57 57
Scenario 1: 2.71% demand increase in WR
demand 96,140 47,179 29,279 18,301 15,670
change 2.44% 2.20% 2.51% 2.53% 2.50%
Std. Dev. 354 241 153 92 137
95% CI 219 150 95 57 85
Scenario 2: 20.05% demand increase in one outskirt
district
demand 95,580 46,585 28,661 17,912 15,329
change 1.84% 0.91% 0.34% 0.35% 0.21%
Std. Dev. 342 235 248 104 115
95% CI 212 146 154 65 71
Scenario 3: 0.3% demand decrease in the capital
demand 93,682 45,957 28,391 17,765 15,351
change -0.18% -0.45% -0.61% -0.48% 0.42%
Std. Dev. 295 95 138 172 97
95% CI 183 59 85 106 60
6 CONCLUSIONS AND FUTURE
PLANS
The paper presents the DES simulation model for
emergency services delivered on the sub-regional
level. The model described in the paper, unlike most
DES hospital emergency applications, is not focused
on specific AUs/EWs; instead, we are interested in
the level of emergency services that should be
contracted by NFZ for the following year to cover
the forecasted demand in WR. The intended use of
the DES model is to assess the number of services
performed for the benefit of patients in every
AU/EW and within 5 medical categories. The DES
model dynamically simulates 3 flows of emergency
patients served at 17 AUs/EWs located in WR from
when the patient enters the system until she or he is
discharged or admitted to a hospital ward. We do not
model patient pathways through particular AUs/EWs
in detail but are rather interested in the types and
number of services performed per patient.
The model can be used at the regional policy
level to investigate cause-and-effect relations, such
as the effects of demographic changes on the
number of services delivered at AUs/EWs located in
the region. In the long run, the model might help
NFZ decision makers to plan the number and value
of hospital emergency services to be contracted with
providers for the following year to meet the needs of
the population and ensure that the cost of the actual
services delivered in emergency units will be
reimbursed by the contract.
Future research will more deeply examine the
relationship between WR demographic parameters
and the emergency needs of the WR population
directed to different AUs/EWs. External forecasts of
demographic trends (published by Central Statistical
Office) will be used and the DES model input
parameters will be estimated accordingly. We also
plan to include epidemiological issues and be able to
connect the health parameters of the population with
emergency needs.
ACKNOWLEDGEMENTS
The project is financed by a grant from the National
Science Centre, awarded based on decision DEC-
2011/01/B/HS4/.
REFERENCES
Abo-Hamad, W. and A. Arisha. 2013. “Simulation-based
framework to improve patient experience in an
emergency department.” European Journal of
Operational Research 224: 154-166.
Ahmed, M. A. and T. M. Alkhamis. 2009. “Simulation
optimization for an emergency department healthcare
SIMULTECH2013-3rdInternationalConferenceonSimulationandModelingMethodologies,Technologiesand
Applications
202

unit in Kuwait.” European Journal of Operational
Research 198:936-942.
Brailsford , S. C., P. R. Harper, B. Patel, and M. Pitt.
2009. “An analysis of the academic literature on
simulation and modelling in health care.” Journal of
Simulation 3:130-140.
Duguay, Ch. and F. Chetouane. 2007. “Modeling and
improving emergency department systems using
discrete event simulation.” Simulation 83(4):311-320.
Fone, D., S. Hollinghurst, M. Temple, A. Round, N.
Lester, A. Weightman, K. Roberts, E. Coyle, G.
Bevan, and S. Palmer. 2003. “Systematic review of the
use and value of computer simulation modelling in
population health and health care delivery.” Journal of
Public Health Medicine 25 (4), 325-335.
Jun, J. B., S. H. Jacobson, and J. R. Swisher. 1999.
“Application of discrete-event simulation in health
care clinics: A survey.” Journal of the Operational
Research Society, 50(2), 109-123.
Hulshof, P. J. H., N. Kortbeek, R. J. Boucherie, E. W.
Hans, and P. J. M. Bakker. 2012. “Taxonomic
classification of planning decisions in health care: a
structured review of the state of the art in OR/MS.”
Health Systems 1:129–175.
Law, A. M. and W. D. Kelton. 2000. Simulation
Modelling and Analysis. McGraw-Hill Higher
Education, Singapore, 3
rd
edition.
Mielczarek, B. and J. Uziałko-Mydlikowska. 2012a.
“Application of computer simulation modeling in the
health care sector: a survey.” Simulation. Transactions
of the Society for Modeling and Simulation
International 88(2):197-216.
Mielczarek, B. and J. Uziałko-Mydlikowska. 2012b.
„Using simulation to forecast the demand for hospital
emergency services at the regional level.” In
Proceedings of the 2012 Winter Simulation
Conference, Edited by C. Laroque, J. Himmelspach,
R. Pasupathy, O. Rose, and A.M. Uhrmacher.
Paul, S. A. and M. C. Reddy. 2010. “A systematic review
of simulation studies investigating emergency
department overcrowding.” Simulation 86(8-9):559-
571.
Paul, J. A. and L. Lin. 2011. “Models for improving
patient throughput and waiting at hospital emergency
departments.” Administration of Emergency Medicine
43(6):1119-1126.
Zeng, Z., X. Ma, Y. Hu, J. Li, and D. Bryant. 2012. “A
simulation study to improve quality of care in the
emergency department of a community hospital.”
Journal of Emergency Nursing 38(4):322-328.
UsingDiscrete-EventSimulationtoForecasttheVolumeofHospitalEmergencyServicestobedeliveredattheRegional
Level
203
