
Investigating the Applicability of Lehman’s Laws of
Software Evolution using Metrics: An Empirical Study
on Open Source Software
Nicholas Drouin and Mourad Badri
Software Engineering Research Laboratory, Department of Mathematics and Computer
Science, University of Quebec, Trois-Rivières, G9A 5H7, Québec, Canada
Abstract. This paper aims at investigating empirically the applicability of
Lehman’s laws of software evolution using software metrics. We used a syn-
thetic metric (Quality Assurance Indicator - Qi), which captures in an integrat-
ed way different object-oriented software attributes. We wanted to investigate if
the Qi metric can be used to support the applicability of Lehman’s laws of
software evolution. We focused on the laws related with continuing change, in-
creasing complexity, continuing growth and declining quality. We performed an
empirical analysis using historical data on two open source (Java) software sys-
tems. The collected data cover a period of more than four years (fifty-two ver-
sions) for the first system and more than seven years (thirty-one versions) for
the second one. Empirical results provide evidence that the considered Leh-
man’s laws are supported by the collected data and the Qi metric.
1 Introduction
Software systems need to continually evolve during their life cycle for various rea-
sons: adding new features to satisfy user requirements, changing business needs, in-
troducing novel technologies, correcting faults, improving quality, etc. [1, 2]. The
accumulation of changes, along the evolution of a software system, can lead to a deg-
radation of its quality [3-7]. It is, therefore, important to monitor how software quality
evolves so that quality assurance (QA) activities can be properly planned [7]. Soft-
ware evolution is, in fact, the dynamic behavior of programming systems as they are
maintained and enhanced over their lifetimes [8]. Lehman’s laws of software evolu-
tion [4, 5] state that for keeping software systems long-lived continuous change is
required. The laws also suggest that due to changes and growth over time, software
systems become more complex and it becomes more and more difficult to extend
them by adding new functionalities.
Software metrics can be used to analyze the evolution of software systems [9].
Metrics have, in fact, a number of interesting characteristics for providing evolution
support [10]. A large number of metrics have been proposed for measuring various
properties of object-oriented (OO) software systems [11]. Empirical evidence exists
showing that there exists a relationship between (many of) these metrics and software
quality attributes [9, 12-21]. However, with the growing complexity and size of OO
software systems, the ability to reason about such a major issue using synthetic me-
Drouin N. and Badri M..
Investigating the Applicability of Lehman’s Laws of Software Evolution using Metrics: An Empirical Study on Open Source Software.
DOI: 10.5220/0004598600300044
In Proceedings of the 1st International Workshop in Software Evolution and Modernization (SEM-2013), pages 30-44
ISBN: 978-989-8565-66-2
Copyright
c
2013 SCITEPRESS (Science and Technology Publications, Lda.)

trics would be more appropriate in practice.
We proposed in [22] a new metric, called Quality Assurance Indicator (Qi), cap-
turing in an integrated way the interactions between classes and the distribution of the
control flow in a software system. The Quality Assurance Indicator of a class is based
on intrinsic characteristics of the class, as well as on the Quality Assurance Indicator
of its collaborating classes. It is important to notice, however, that the metric has no
ambition to capture the overall quality of OO software systems. Furthermore, the
objective is not to evaluate a design by giving absolute values, but more relative val-
ues that may be used for identifying critical classes on which more QA effort is need-
ed to ensure software quality. In [22], we performed an empirical analysis using data
collected from several open source (Java) software systems. In all, more than 4,000
classes were analyzed (400 000 lines of code). We compared the Qi metric, using the
Principal Components Analysis (PCA) method, to various well known OO metrics.
The selected metrics were grouped in five categories: coupling, cohesion, inheritance,
complexity and size. Empirical results provide evidence that the Qi metric captures, in
a large part, the information provided by the studied OO metrics. Moreover, we ex-
plored in [12] the relationship between the Qi metric and testability of classes and
investigated in [23] the capacity of the Qi metric in predicting the unit testing effort of
classes using regression analysis. Results provide evidence that the Qi metric is able
to accurately predict the unit testing effort of classes. More recently, we explored in
[24] if the Qi metric can be used to observe how quality, measured in terms of de-
fects, evolves in the presence of changes and in [25] if the Qi metric captures the
evolution of two important OO metrics (related to coupling and complexity).
In this paper, we wanted to investigate thoroughly if the Qi metric, as a synthetic
metric, can be used to support the applicability of Lehman’s laws of software evolu-
tion [4, 5]. We focused on the Lehman’s laws related with continuing change, in-
creasing complexity, continuing growth and declining quality. We addressed software
evolution from both software internal and external perspectives. We performed an
empirical analysis using historical data on two open source (Java) software systems.
The collected data cover a period of more than four years (fifty-two versions) for the
first system and more than seven years (thirty-one versions) for the second one. Em-
pirical results provide evidence that the considered Lehman’s laws are supported by
the collected data and the Qi metric.
The rest of this paper is organized as follows: Section 2 gives a survey on related
work. The Qi metric is introduced in Section 3. Section 4 presents the empirical study
we performed. Finally, Section 5 concludes the paper.
2 Related Work
Mens et al. [10] provide an overview of the ways software metrics have been (and can
be) used to analyze software evolution. A distinction is made between using software
metrics before the evolution has occurred (predictive) and after the evolution has
occurred (retrospective). To support retrospective analysis, metrics can be used to
understand the quality evolution of a software system by considering its successive
releases. In particular, metrics can be used to measure whether the quality of a soft-
ware has improved or degraded between two releases. Dagpinar et al. [15] investigate
31

the significance of different OO metrics for the purpose of predicting maintainability
of software. Nagappan et al. [26] focus on mining metrics to predict component fail-
ures. The authors noted that there is not a single set of complexity metrics that could
be used as a universally best defect predictor. Ambu et al. [27] address the evolution
of quality metrics in an agile/distributed project and investigate how the distribution
of the development team has impacted the code quality.
Lee et al. [9] provide an overview of open source software evolution with software
metrics. The authors explored the evolution of an open source software system in
terms of size, coupling and cohesion, and discussed its quality change based on the
Lehman’s laws of evolution [4, 5, 28]. Jermakovics et al. [29] propose an approach to
visually identify software evolution patterns related to requirements. Mens et al. [30]
present a metrics-based study of the evolution of Eclipse. The authors consider seven
major releases and investigate whether three of the laws of software evolution (con-
tinuing change, increasing complexity and continuing growth) were supported by the
data collected. Xie et al. [1] conduct an empirical analysis on the evolution of seven
open source programs and investigate also on Lehman’s laws of software evolution.
Murgia et al. [18] address software quality evolution in open source projects using
agile practices. The authors used a set of OO metrics to study software evolution and
its relationship with bug distribution. According to the achieved results, Murgia et al.
concluded also that there is not a single metric that is able to explain the bug distribu-
tion during the evolution of the analyzed systems. Zhang et al. [7] use c-charts and
patterns to monitor quality evolution over a long period of time. The number of de-
fects was used as a quality indicator. Eski et al. [16] present an empirical study on the
relationship between OO metrics and changes in software. The authors analyze modi-
fications in software across the historical sequence of open source projects and pro-
pose a metrics-based approach to predict change-prone classes. Yu et al. [31] study
the possibility of using the number of bug reports as a software quality measure. Us-
ing statistical methods, the authors analyze the correlation between the number of bug
reports and software changes.
3 Quality Assurance Indicator
We give, in this section, a summary (for space limitation reasons) of the definition of
the Quality Assurance Indicator (Qi) metric. For more details see [22, 23]. The Qi
metric is based on the concept of Control Call Graphs (CCG), which are a reduced
form of traditional Control Flow Graphs (CFG). A CCG is a CFG from which the
nodes representing instructions (or basic blocks of sequential instructions) not con-
taining a call to a method are removed. The Qi metric is normalized and gives values
in the interval [0, 1]. A low value of the Qi of a class means that the class is a high-
risk class and a high value of the Qi of a class indicates that the class is a low-risk
class.
3.1 Quality Assurance Indicator
The Qi of a method M
i
is defined as a kind of estimation of the probability that the
32

control flow will go through the method without any failure. The Qi of a method M
i
is
based on its intrinsic characteristics (cyclomatic complexity, unit testing coverage), as
well as on the Qi of the methods invoked by the method M
i
. In OO software systems,
objects collaborate to achieve their respective responsibilities. A method of poor qual-
ity can have (directly or indirectly) a negative impact on the methods that use it. The
Qi of a method M
i
is given by:
Qi
Qi
∗
∙ PC
∙ Qi
∈
(1)
with :
Qi
: QA indicator of method M
i
,
Qi
∗
: intrinsic QA indicator of method M
i
,
C
: j
th
path of method M
i
,
PC
: probability of execution of path C
j
i
of method M
i
,
Qi
: QA indicator of method M included in the path
,
n
: number of linear paths of the CCG of method M
i
,
and σ
: set of the methods invoked in the path C
.
By applying the previous formula (1) to each method we obtain a system of N (num-
ber of methods in the program) equations. The obtained system is not linear and is
composed of several multivariate polynomials. We use an iterative method (method
of successive approximations) to solve it. The system is, in fact, reduced to a fixed
point problem. Furthermore, we define the Qi of a class C (notedQi
) as the product
of the Qi of its methods:
∈
(2)
where δ is the set of methods of the class C. The calculation of the Qi metric is entire-
ly automated by a tool (prototype) that we developed for Java software systems.
3.2 Assigning Probabilities
The CCG of a method can be seen as a set of paths that the control flow can pass
through (depending on the states of the conditions in the control structures). To cap-
ture this probabilistic characteristic of the control flow, we assign a probability to
each path C of a control call graph as follows:
∈
(3)
where θ is the set of directed arcs composing the path C and P(A) the probability of
an arc to be crossed when exiting a control structure.
To facilitate our experiments, we assigned probabilities to the different control
structures of a (Java) program according to the rules given in Table 1. These values
are assigned automatically during the static analysis of the source code of a program
when generating the Qi models. These values can be adapted according to the nature
of the applications (for example). As an alternative way, the probability values may
33

also be assigned (adapted) by programmers during the development (in an iterative
way, knowing the code) or obtained by dynamic analysis. Dynamic analysis is out of
the scope of this paper.
Table 1. Assignment rules of the probabilities.
Nodes Probability Assignment Rule
(if, else)
0.5 for the exiting arc « condition = true »
0.5 for the exiting arc « condition=false »
while
0.75 for the exiting arc « condition = true »
0.25 for the exiting arc « condition = false »
(do, while)
1 for the arc: (the internal instructions are execut-
ed at least once)
(switch,case) 1/n for each arc of the n cases.
(?, :)
0.5 for the exiting arc « condition = true »
0.5 for the exiting arc « condition = false »
for
0.75 for entering the loop
0.25 for skipping the loop
(try, catch)
0.75 for the arc of the « try » bloc
0.25 for the arc of the « catch » bloc
Polymorphism 1/n for each of the eventual n calls.
3.3 Intrinsic Quality Assurance Indicator
The Intrinsic Quality Assurance Indicator of a method M
i
, noted Qi
*
Mi
, is given by:
∗
1
(4)
with:
where:
CC
: cyclomatic complexity of method M
i
,
max
,
tc
: unit testing coverage of the method M
i
,
∈
0,1
.
Many studies provided empirical evidence that there is a significant relationship be-
tween cyclomatic complexity and fault proneness (e.g., [13, 21, 32]). Testing (as one
of the most important QA) activities will reduce the risk of a complex program and
achieve its quality. Moreover, testing coverage provide objective measures on the
effectiveness of a testing process. The testing coverage measures are (currently in our
approach) affected by programmers based on the test suites they developed to test the
classes of the program. The testing coverage measures can also be obtained automati-
cally (using tools such as Together (www.borland.com) or CodePro (develop-
ers.google.com)) by analyzing the code of the test suites (JUnit suites for example) to
determine which parts of the classes that are covered by the test suites and those that
are not. This issue is out of the scope of this paper and will be considered in our future
work.
34

4 Empirical Study
We present, in this section, the empirical study we conducted in order to investigate if
the Qi metric can be used to support the Lehman’s laws along the evolution of a soft-
ware system. We focus on the following laws: continuous change, increasing com-
plexity, continuing growth and declining quality. We used historical data collected
from successive released versions of two open source Java software (Table 2).
Table 2. Some statistics on the used systems.
Systems
Time
frame
(years)
Releases
/Captures
First release computed Last release computed
Version Date Size
(SLOC)
Version Date Size
(SLOC)
Eclipse
PDE.UI
4.25
52
(monthly)
-
2002-
08-29
9 519
-
2006-
11-28
79 548
Apache
Tomcat
7.2
31
(official)
5.5.0
-
126 927
5.5.35
-
170 998
4.1 The Case Studies
The first system we selected is an Eclipse component (PDE.UI). We used captures
taken at regular intervals (monthly, more than four years). The second system we
selected is a relatively large system (Tomcat). This system is an open source web
server developed by the Apache Software Foundation. We analysed its 5.5 branch,
launched in August 2004. The version 5.5.35, the latest to date, was launched on No-
vember 2011. For this system, we used the official releases as time captures. The first
version of PDE.UI includes 121 classes (more than 9 500 lines of code) and the last
one includes 670 classes (more than 79 000 lines of code). The first version of
Tomcat includes 837 classes (more than 120 000 lines of code) and the last one in-
cludes 1 108 classes (more than 170 000 lines of code).
4.1.1 Data Gathering
We collected two types of data from the subject systems for all the steps of our empir-
ical study: source code historical data and Qi data. In addition to these data, we also
collected other (specific) data related to each law. These data will be presented in the
corresponding sections.
System History Data: We used CVS (Concurrent Versions System) to collect histor-
ical data about PDE.UI. CVS is a client-server software that allows keeping track of a
software system evolution. We connected to the CVS repertory of Eclipse. We based
our analysis on the latest available version on the first day of each month. A period of
more than four years (fifty two versions) is covered. For Apache Tomcat, we retrieved
the official releases on the 5.5.x branch from the official website (archive.apache.org).
A period of more than seven years (thirty one versions) is covered for this system.
Qi Data: We used the tool we developed to collect the Qi data. We computed the Qi
value for each class of each released version of a subject system. We computed the Qi
values at the micro level (classes) as well as at the macro level (system). Moreover,
35
for our experiments, since we did not have any data on the test suites used for testing
the subject systems and knowing that the main purpose of this study is to investigate
if the Qi metric can be used to support Lehman’s laws of evolution, the testing cover-
age (tc
i
, Section 3.3) is set to 0.75 for all methods.
4.2 Lehman’s Laws of Software Evolution
We consider in our study four of the eight Lehman’s laws of software evolution: con-
tinuing change, increasing complexity, continuing growth and declining quality. For
each of these laws, we investigate its applicability on our test applications. In addi-
tion, we describe the procedure we used, the specific data we collected (using differ-
ent metrics to capture some attributes of the systems analyzed) in addition to the data
described previously and the observations on whether the law is confirmed or in-
firmed. Our objective is to investigate if the Qi metric, as a synthetic metric, can be
used to support the applicability of Lehman’s laws of software evolution.
4.2.1 Continuing Change
An evolving system undergoes many changes over time. The Lehman's first law (con-
tinuing change) states that a software system must continually adapt to its environ-
ment, otherwise it becomes progressively less useful. Many studies on software evo-
lution have addressed and validated this law for the open-source software systems
studied [1, 9, 10, 33]. In our study, we consider change from the perspective of the
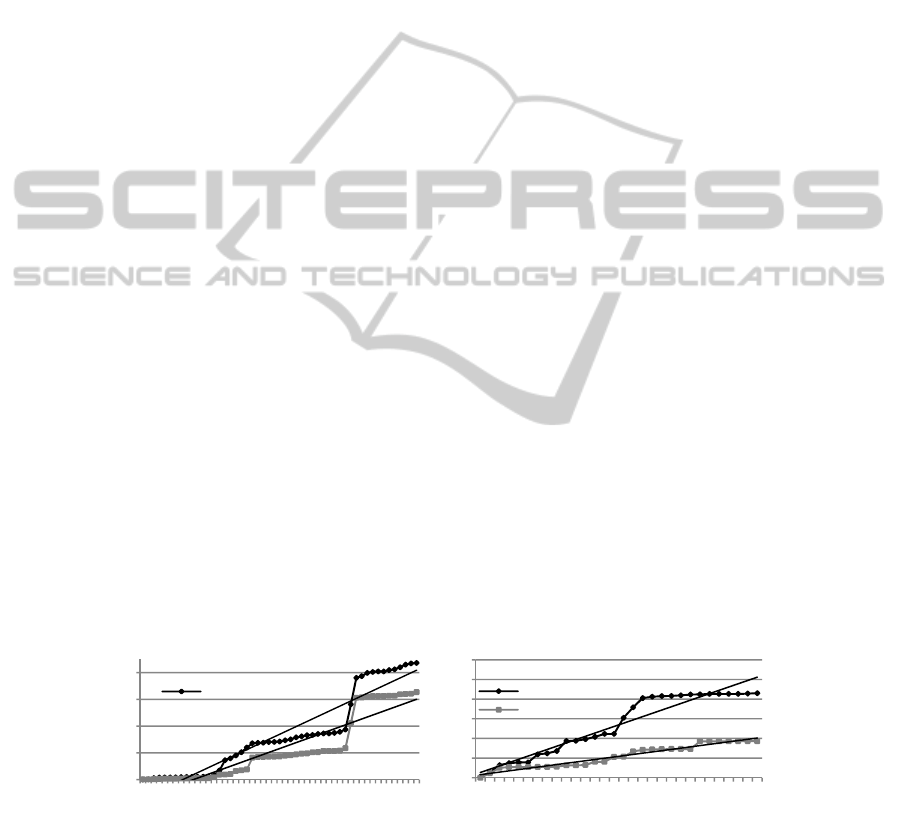
cumulative number of added/removed classes. Figure 1 shows the curves of the cumu-
lative number of changes for the two systems. The figure clearly shows that the two
systems continue to change over time. Using linear regression, we calculated the
slopes associated with these data sets. A similar approach has been used by Xie et al.
[1]. From Figure 1, it can be seen that the slopes of the curves are positive for both
systems (obviously since it is a sum of positive elements). Our focus is therefore on
the strength of the slope of these curves. Results show that the changes take place
periodically over time. However, changes in smaller amounts are held on a continu-
ous basis and this throughout the period of evolution of the two systems. With these
observations we can conclude that continuing change is confirmed for our two soft-
ware systems.
Fig. 1. Evolution of cumulative changes for PDE.UI and Tomcat.
R²=0,896
R²=0,8376
0
500
1000
1500
2000
1 8 15 22 29 36 43 50
Numberofclasses
Versions
Changes‐ PDE.UI
Cumul.
Additions
R²=0,9227
R²=0,9503
0
100
200
300
400
500
600
1357911131517192123252729
Numberofclasses
Versions
Changes‐ Tomcat
Cumul.Additions
Cumul.Deletions
36
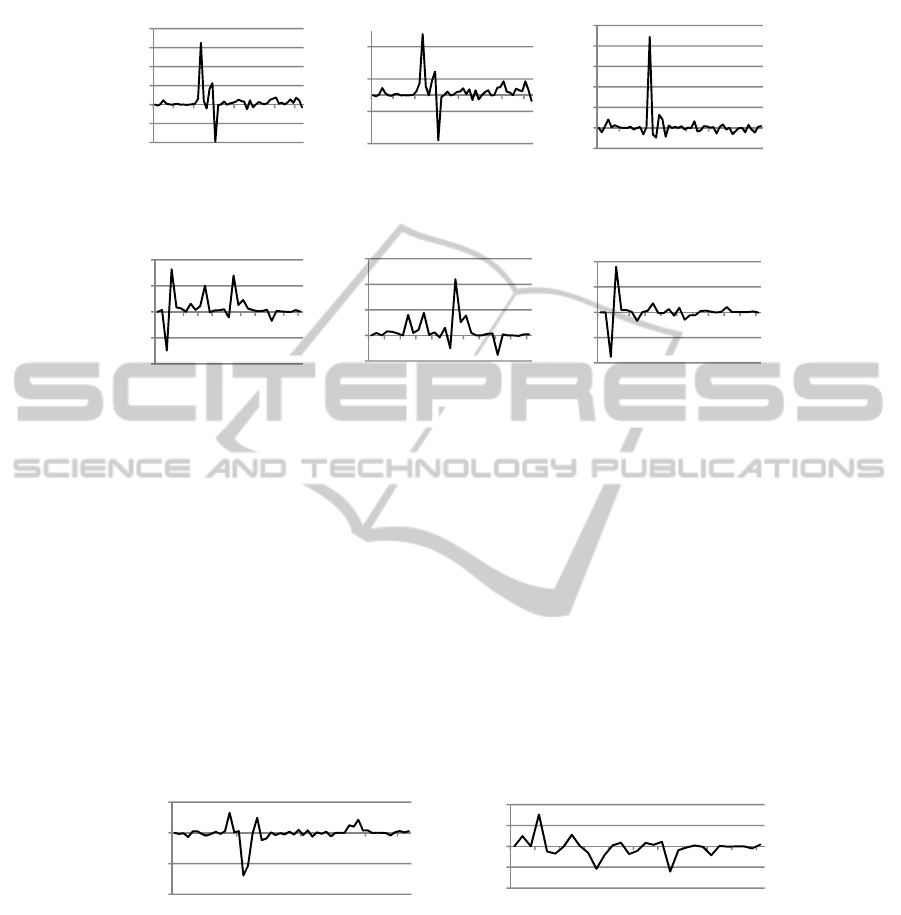
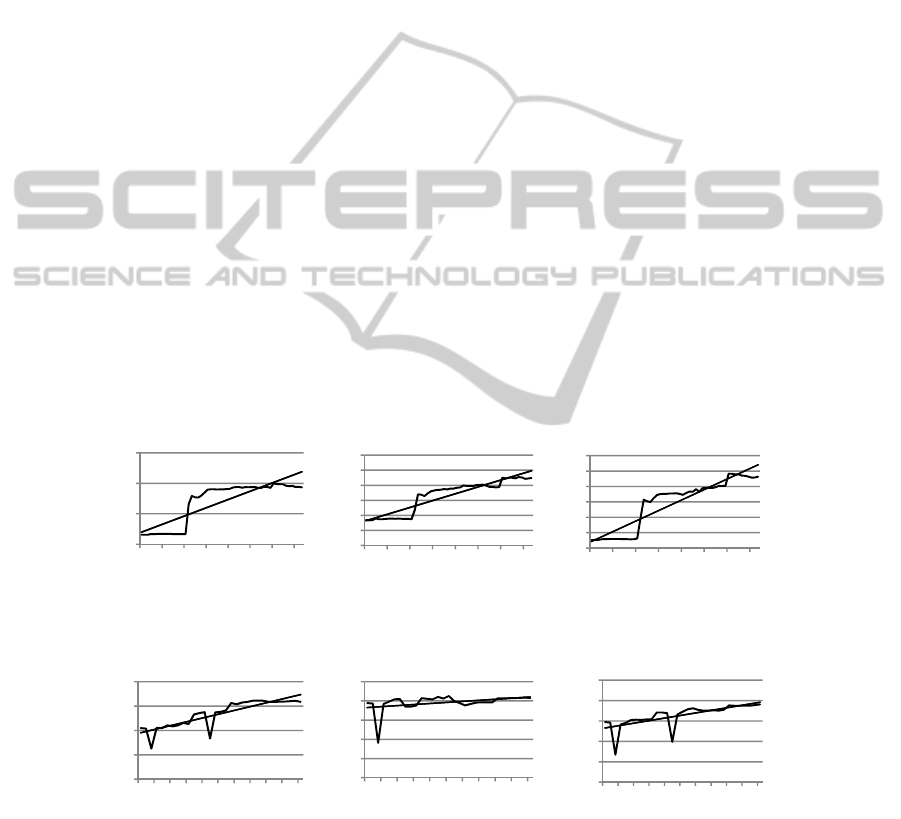
Fig. 2. Evolution of size metrics variations for PDE.UI.
Fig. 3. Evolution of size metrics variations for Tomcat.
We extended our analysis by focusing on variations in the values of some size
metrics. We used several size indicators. We used the number of lines of code in a
system (SLOC), the total number of classes in a system (SNOC) and the average
number of lines of code in a class (LOC). We used the Borland Together tool
(www.borland.com) to collect data on these metrics on the two subject systems. Fig-
ures 2 and 3 show, respectively for PDE.UI and Tomcat, variations in the used size
related metrics. We can observe that the variations are quite dispersed for both sys-
tems over time. Therefore, changes in the case of the two systems are continuous.
This confirms once again that continuous change is observable for the systems ana-
lyzed. Moreover, Figure 4 shows the variations in the Qi metric along the evolution of
the two systems. The analysis of these curves clearly reveals continuing presence of
changes in the case of both systems. Variations in the values of Qi are, in fact, contin-
uous. With these observations, we can conclude that the Qi metric confirms also the
first law for the systems analyzed.
Fig. 4. Evolution of Qi variations for PDE.UI and Tomcat.
4.2.2 Increasing Complexity
The second law states that as a software system evolves its complexity increases un-
less work is done to reduce or stabilize it. Studies that addressed Lehman's second law
in the case of open-source development have confirmed this law for the systems ana-
‐20000
‐10000
0
10000
20000
30000
40000
1 8 15 22 29 36 43 50
DeltaSLOC
Versions
PDE.UI
‐150
‐50
50
150
1 8 15 22 29 36 43 50
DeltaSNOC
Versions
PDE.UI
‐10
0
10
20
30
40
50
1 8 15 22 29 36 43 50
DeltaLOC
Versions
PDE.UI
‐20000
‐10000
0
10000
20000
1 7 13 19 25 31
DeltaSLOC
Versions
Tomcat
‐50
0
50
100
150
1 7 13 19 25 31
DeltaSNOC
Versions
Tomcat
‐20
‐10
0
10
20
1 7 13 19 25 31
DeltaLOC
Versions
Tomcat
‐0,1
‐0,05
0
0,05
1 8 15 22 29 36 43 50
DeltaQi
Versions
PDE.UI
‐0,01
‐0,005
0
0,005
0,01
1 7 13 19 25 31
DeltaQi
Versions
Tomcat
37
lyzed [1, 9]. In our study, we used three well-known software metrics (RFC, WMC
and CBO) [34] to capture complexity and coupling along the evolution of the systems
studied. The CBO (Coupling Between Objects) metric counts for a class the number
of other classes to which it is coupled (and vice versa). The RFC (Response For
Class) metric for a class is defined as the set of methods that can be executed in re-
sponse to a message received by an object of the class. The WMC (Weighted Methods
per Class) metric gives the sum of complexities of the methods of a given class,
where each method is weighted by its cyclomatic complexity. Here also, we used the
Borland Together tool to collect data on these metrics on the two subject systems. We
calculated the values of these metrics for all versions of the considered systems. Fig-
ures 5 and 6 show, respectively for PDE.UI and Tomcat, the curves of the metrics and
the slope of the linear regression followed by each of these curves.
Overall, from the two figures, we can clearly observe that all the curves show an
increasing trend. The three metrics have increased over time. With these observations,
we can conclude that the second law is confirmed for the two systems. Moreover,
Figure 7 shows the evolution of the Qi metric for both systems. From this figure, we
can observe a decreasing trend of the Qi metric, which is opposite to the trend of the
curves corresponding to the coupling and complexity metrics. The decreasing in the
values of the Qi metric confirms also the second law for the two systems. We also
calculated the correlation coefficients between the Qi metric and the coupling and
complexity metrics. We used the Spearman’s correlation coefficient in our study. This
technique is widely used for measuring the degree of relationship between two varia-
bles. Correlation coefficients will take a value between -1 and +1. We applied the
typical significance threshold (α = 0.05) to decide whether the correlations were sig-
nificant. We analyzed the correlations between the Qi metric and the coupling and
complexity metrics at both micro and macro levels.
Fig. 5. Evolution of coupling and complexity metrics for PDE.UI.
Fig. 6. Evolution of coupling and complexity metrics for Tomcat.
slope=1.944
0
50
100
150
1 8 15 22 29 36 43 50
RFC
Versions
PDE.UI
slope=0.3252
0
5
10
15
20
25
30
1 8 15 22 29 36 43 50
WMC
Versions
PDE.UI
slope=0.4885
0
5
10
15
20
25
30
1 8 15 22 29 36 43 50
CBO
Versions
PDE.UI
slope=0.2609
50
55
60
65
70
1 7 13 19 25 31
RFC
Versions
Tomcat
slope=0.0366
22
24
26
28
30
32
1 7 13 19 25 31
WMC
Versions
Tomcat
slope=0.021
7,5
8
8,5
9
9,5
10
1 7 13 19 25 31
CBO
Versions
Tomcat
38
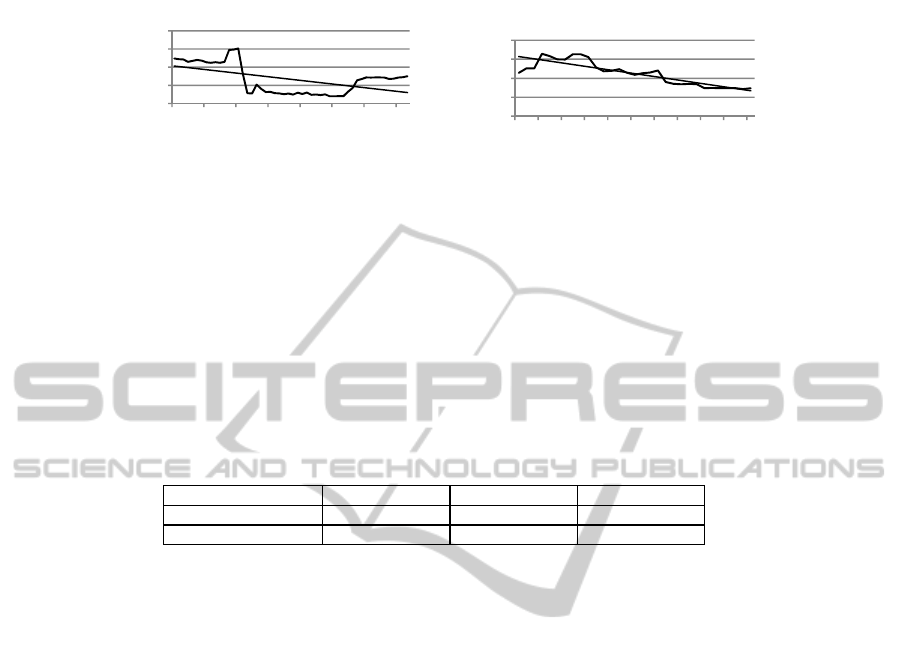
Fig. 7. Evolution of the Qi metric for PDE.UI and Tomcat.
For the macro level, we used the average values of the metrics for each version of
the subject systems. We give in what follows (Table 3), for space constraints, only the
correlation values at the macro level. From Table 3, it can be seen that all correlations
are significant (in boldface). The correlation values are moderate for PDE.UI but
relatively high (especially between the Qi metric and RFC and CBO metrics) for
Tomcat, the larger of the two systems. Moreover, the correlations are negative. This
confirms the trends observed from the different previous curves. Therefore, we can
conclude that the increasing complexity of the two systems is once again confirmed
and supported by the Qi metric.
Table 3. Correlations between Qi and complexity metrics for PDE.UI and Tomcat.
RFC vs. Qi WMC vs. Qi CBO vs. Qi
PDE.UI -0.516 -0.539 -0.475
Apache Tomcat -0.830 -0.566 -0.854
4.2.3 Continuing Growth
This law states that the size of a software system increases continuously along its
evolution to accommodate changes and satisfy an increasing set of requirements.
Many studies that addressed this law were able to confirm it for the open-source soft-
ware systems studied [1, 9, 30, 33]. These studies used different metrics for measur-
ing system size and growth. We used the number of classes as an indicator of size.
This attribute has been used by Lee [9] to confirm continuing growth. Figure 8 shows
the evolution of the number of classes for both systems. Each point in the graph cor-
responds to a release. We can clearly see that the size of both systems, measured by
the number of classes, increased over time, which confirms the law for both systems.
We extended our analysis by using other size indicators. In addition to the size indica-
tors SLOC, SNOC and LOC used in section 4.2.1, we used the number of operations
per class (NOO). The curves of these indicators, which we do not give in this paper
for space constraints, follow exactly the same trend as the curve of Figure 8. All these
indicators increased over time for both systems. Moreover, we can also consider the
additions/deletions of classes presented previously in section 4.2.1 (Figure 1), in
which the curve of additions is above the deletions. The cumulative number of addi-
tions is thus clearly higher (growths faster) than the cumulative number of deletions.
With these observations we can confirm the law of continuing growth for both sys-
tems.
slope=‐0.0014
0,65
0,7
0,75
0,8
0,85
1 8 15 22 29 36 43 50
Qi
Versions
PDE.UI
slope=‐0.0006
0,72
0,73
0,74
0,75
0,76
1 7 13 19 25 31
Qi
Versions
Tomcat
39
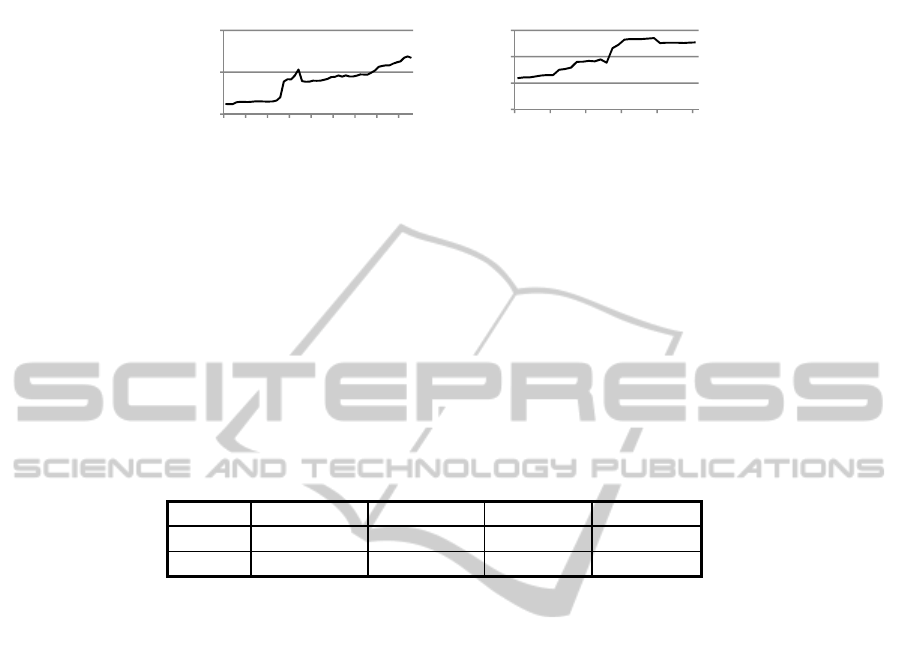
Fig. 8. Evolution of the number of classes of PDE.UI and Tomcat.
Let us now analyze the evolution of the Qi metric. From Figure 7, we can observe
that the Qi metric follows an opposite trend compared to the size indicators, which is
not a surprising finding. In fact, a significant increase in the size of a software system
is generally followed by an increase in its complexity, which leads to a decrease in the
Qi values over time, as explained in section 4.2.2. In order to validate these observa-
tions, we analyzed the correlation values between the Qi metric and the size indica-
tors. We used here also the Spearman’s correlation coefficient under the same condi-
tions as in section 4.2.2. Table 4 gives the obtained results. As it can be seen, the
correlations are all significant (in boldface) and negatives. This confirms that the Qi
metric supports also the law of continuing growth for both systems.
Table 4. Correlations between Qi and size metrics for PDE.UI and Tomcat.
SNOC vs. Qi SLOC vs. Qi LOC vs. Qi NOO vs. Qi
PDE.UI -0.433 -0.442 -0.891 -0.561
Tomcat -0.736 -0.790 -0.397 -0.697
4.2.4 Declining Quality
This law states that the quality of a software system decreases over time, unless work
is done to improve it. Among the studies that have investigated this law [1, 9], none
was able to confirm it for the test systems they used. The study conducted by Lee [9],
in particular, has observed an overall improvement of software quality. In our study,
we address this law from different perspectives. In a first step, we considered software
quality from an external perspective. In order to analyze how software quality chang-
es as software evolves, we used the number of reported defects as a quality indicator.
We also investigated for patterns of evolution (according to Zhang et al. [7]). A high-
er occurrence of faults is considered as a sign of poor quality. We used, in the case of
the two systems, Bugzilla (defect tracking system) reports on resolved/closed faults to
withdraw information about faults. Figure 9 shows the evolution of the number of
faults identified at each iteration of the two systems. Zhang et al. [7] studied the evo-
lution of faults of PDE.UI based on recurring patterns. The authors found that PDE.UI
follows a roller coaster pattern, which means that its quality is not under control.
Amplitudes are, in fact, at their strongest in the center of the evolution period studied
(iterations 21 and 33). With the exception of these two periods, the quality seems to
be much more under control. The results we obtained for PDE.UI confirm the conclu-
sions of Zhang et al. [7]. Tomcat has not been studied by Zhang et al. However, based
on the patterns they identified, we can say that this system also follows a roller coast-
0
500
1000
1 7 13 19 25 31 37 43 49
Numberofclasses
Versions
PDE.UI
600
800
1000
1200
1 7 13 19 25 31
Numberofclasses
Versions
Tomcat
40
er pattern due to the many peaks visible in the curve. The quality of Tomcat, however,
seems to be much more under control towards the end of the analyzed period with a
stabilization of the number of faults. Such observations therefore lead us to conclude
in a deterioration of the quality for the two systems under study. In addition, we con-
sidered in a second step software quality from an internal point of view. From the
curves given in Figure 5 and Figure 6 (increasing complexity), we can clearly observe
that the complexity of the two systems increases, according to the three metrics (RFC,
WMC and CBO). These observations confirm therefore that the quality of the ana-
lyzed systems from an internal point of view decreases. In fact, an increasing com-
plexity of a software system often symbolizes a decrease in its quality. So, when con-
sidering both internal and external quality metrics, we can conclude that the law of
declining quality is confirmed for the two systems.
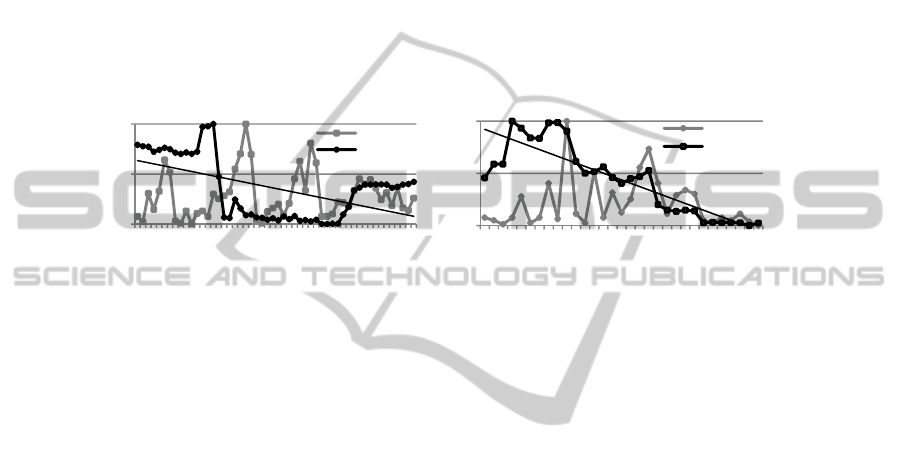
Fig. 9. Evolution of the number of faults superimposed with Qi for the two systems.
Let us now analyze the evolution of the Qi metric. Figure 9 shows the curve of the
Qi metric, superimposed with the number of faults reported along the evolution of the
two systems. The linear regression of the Qi curve is also given in the figure. The
values on the y-axis are normalized between 0 and 1 (min-max). From Figure 9 and
previous results, we can make several observations. PDE.UI shows a negative trend
for the Qi metric, mainly because of the steep decrease between iterations 15 and 17.
To this period corresponds, in fact, a significant increase in complexity (see Figure 5)
and a significant growth of the system (see Figure 8). Immediately after, we can ob-
serve a long plateau where the Qi values are at their lowest, ranging between itera-
tions 17 and 38. Throughout this period, the number of faults is relatively high and the
complexity metrics remain relatively stable. Two large peaks appear in the curve of
faults around iterations 20 and 32. After this long period, the Qi values rebounded.
Overall, for PDE.UI, we can conclude that the Qi metric thus indicates the variations
(especially for the steep drop) of quality over time. Tomcat presents for the Qi metric
a regular decreasing trend, during which faults appear as peaks in regular intervals. In
addition, we already know from previous results that there is an increasing complexity
for this system, according to the evolution of the complexity metrics (CBO, RFC and
WMC). From these observations, we can conclude that the Qi metric captures the
declining quality of the two systems. We can therefore say that the Qi metric supports
the declining quality law for the studied systems.
4.2.5 Threats to Validity
The study presented in this paper should be replicated using many other software
systems in order to draw more general conclusions about the ability of the Qi metric
slope=‐0.0109
0
0,5
1
1 8 15 22 29 36 43 50
Normalizedmeasures
Versions
PDE.UI
Fautes(N)
Qi(N)
slope=‐0.0322
0
0,5
1
1 6 11 16 21 26 31
Normalizedmeasures
Versions
Tomcat
Fautes(N)
Qi(N)
41

to support the Lehman’s laws of software evolution. In fact, there are a number of
limitations that may affect the results of the study or limit their interpretation and
generalization. The achieved results are based on the data set we collected from only
two open source software systems written in Java. Even if the collected data cover a
period of several years: 4 years for the first system (fifty-two versions) and 7 years for
the second one (thirty-one versions), we do not claim that our results can be general-
ized to all systems, or software systems written in other languages. The findings in
this paper should be viewed as exploratory and indicative rather than conclusive.
Moreover, the study has been performed on open source software systems. It would
be interesting to replicate the study on industrial systems. It is also possible that facts
such as the development style used by the developers for developing (and maintain-
ing) the code of the subject systems (or other related factors) may affect the results or
produce different results for specific applications. In addition, the study is based im-
plicitly on the assumption that the used software metrics (LOC, RFC, WMC, CBO,
etc.) actually capture the intended characteristics. We deliberately used multiple met-
rics for each law to reduce this threat. Also, the study is based on the data we collect-
ed on the evolution of the studied systems, in particular the defect information, that
we suppose reliable.
5 Conclusions
In this paper, we analyzed the evolution of two open-source Java software systems.
We wanted to investigate if the Qi (Quality Assurance Indicator) metric, a metric that
we proposed in a previous work, can be used to support the applicability of Lehman’s
laws of software evolution. We focused in this study on the Lehman’s laws related
with continuing change, increasing complexity, continuing growth and declining
quality. We addressed software evolution from both internal and external perspec-
tives. We performed an empirical analysis using historical data collected from the
successive released versions of the two systems. The collected data cover a period of
more than four years for the first system (fifty-two versions in total) and a period of
more than seven years for the second one (thirty-one versions in total). Empirical
results provide evidence that the considered Lehman’s laws are supported by the
collected data and the Qi metric.
The advantage that brings, in our opinion, the use of the Qi metric (as a synthetic
metric) in the case of evolutionary systems, is that it can be used to guide quality
assurance actions through evolution. Indeed, the Qi metric can be used for identifying,
in a relative way as software evolves, critical parts that require more quality assurance
(as testing) effort to ensure software quality. The achieved results are, however, based
on the data set we collected from only two open source software systems. The find-
ings in this paper should be viewed as exploratory and indicative rather than conclu-
sive. They show, at least, that the Qi metric, as a synthetic metric, offers a promising
potential for capturing (reflecting) various aspects related to software evolution. Fur-
ther investigations are, however, needed to draw more general conclusions.
42

Acknowledgements
This project was financially supported by NSERC (National Sciences and Engineer-
ing Research Council of Canada) and FRQNT (Fonds de Recherche du Québec –
Nature et Technologies) grants.
References
1. Xie, G., Chen, J., Neamtiu, I.: Towards a better understanding of software evolution: An
empirical study on open source software. In: ICSM ’09 (2009) 51–60
2. Sommerville, I.: Software engineering. 9th Edition, Addison Wesley (2010)
3. Parnas, P.L.: Software aging. In: Proceedings of the 16th ICSE (1994) 279–287
4. Lehman, M.M., Ramil, J.F., Wernick, P.D., Perry, D.E., Turski, W.M.: Metrics and laws of
software evolution – The nineties view. In: Proceedings of the Fourth International Soft-
ware Metrics Symposium (1997) 20–32
5. Lehman, M.M.: Laws of software evolution revisited. In: Lecture notes in computer sci-
ence, Vol. 1149/1996 (1997) 108–124
6. van Gurp, J., Bosch, J.: Design erosion: Problems & causes. In: Journal of Systems and
Software, Vol. 61, No. 2 (2002) 105–119
7. Zhang, H., Kim, S.: Monitoring software quality evolution for defects. In: IEEE Software,
Vol. 27, No. 4 (2010) 58–64
8. Lehman, M.M., Belady, L.A.: Program evolution: Processes of software change. Academic
Press (1985)
9. Lee, Y., Yang, J., Chang, K.H.: Metrics and evolution in open source software. In: Proceed-
ings of the 7
th
QSIC (2007)
10. Mens, T., and Demeyer, S.: Future trends in software evolution metrics. In: Proceedings of
the 4
th
IWPSE (2001) 83–86
11. Henderson-Sellers, B.: Object-oriented metrics – Measures of complexity. In: Prentice Hall,
New Jersey (1996)
12. Badri, M., Touré, F.: Empirical analysis for investigating the effect of control flow depend-
encies on testability of classes. In: 23
rd
International Conference on Software Engineering
and Knowledge Engineering (2011)
13. Basili, V., Briand, L., Melo, W.L.: A validation of object oriented design metrics as quality
indicators. In: IEEE Transactions on Software Engineering, Vol. 22, No. 10 (1996)
14. Briand, L.C., Wüst, J., Daly, J.W., Porter, D.V.: Exploring the relationships between design
measures and software quality in object-oriented systems. In: Journal of Systems and Soft-
ware (2000) 245–273
15. Dagpinar, M., Jahnke, J.H.: Predicting maintainability with object-oriented metrics - An
empirical comparison. In: Proceedings of the 10th Working Conference on Reverse Engi-
neering (2003) 155–164
16. Eski, S., Buzluca, F.: An empirical study on object-oriented metrics and software evolution
in order to reduce testing costs by predicting change-prone classes. In: 2011 IEEE 4
th
Int.
Conference on Software Testing, V&V Workshops (2011) 566–571
17. Fenton, N.E., Pfleeger, S.L.: Software metrics: A rigorous & practical approach. 2
nd
Ed.,
PWS Publishing Company (1997)
18. Murgia, A., Concas, G., Pinna, S., Tonelli, R., Turnu, I.: Empirical study of software quali-
ty evolution in open source projects using agile practices. In: CoRR, Vol. abs/0905.3287
(2009)
19. Singh, Y., Kaur, A., Malhotra, R.: Empirical validation of object-oriented metrics for pre-
dicting fault proneness models. In: Software Quality Journal, Vol. 18, No. 1 (2010) 3–35
43

20. Subramanyan, R., Krishnan, M.S.: Empirical analysis of CK metrics for object-oriented
design complexity: Implications for software defects. In: IEEE Transactions on Software
Engineering, Vol. 29, No. 4 (2003) 297–310
21. Zhou, Y., Leung, H.: Empirical analysis of object-oriented design metrics for predicting
high and low severity faults. In: IEEE Transactions on Software Engineering, Vol. 32, No.
10 (2006) 771–789
22. Badri, B., Badri, L., Touré, F.: Empirical analysis of object-oriented design metrics: To-
wards a new metric using control flow paths and probabilities. In: Journal of Object Tech-
nology, Vol. 8, No. 6 (2009) 123–142
23. Badri, M., Touré, F.: Evaluating the effect of control flow on the unit testing effort of clas-
ses: An empirical analysis. In: Advances in Software Engineering Journal (2012)
24. Badri, M., Drouin, N. Touré, F.: On Understanding Software Quality Evolution from a
Defect Perspective: A Case Study on an Open Source Software System. In: Proceedings of
the IEEE International Conference on Computer Systems and Industrial Informatics, Shar-
jah, UAE, December 18–20 (2012)
25. Drouin, N., Badri, M, Touré, F.: Metrics and Software Quality Evolution: A Case Study on
Open Source Software. In: Proceedings of the 5
th
International Conference on Computer
Science and Information Technology, Hong Kong, December 29-30 (2012)
26. Nagappan, N., Ball, T., Zeller, A.: Mining metrics to predict component failures. In: Pro-
ceedings of the 28
th
International Conference on Software Engineering (ICSE '06), ACM
(2006) 452–461
27. Ambu, W., Concas, G., Marchesi, M., Pinna, S.: Studying the evolution of quality metrics
in an agile/distributed project. In: Extreme Programming and Agile Processes in Software
Engineering (2006) 85–93
28. Lehman, M.M.: On understanding laws, evolution, and conservation in the large-program
life cycle. In: Journal of Systems and Software, Vol. 1, No. 3 (1980) 213–221
29. Jermakovics, A., Scotto, M., Succi, G.: Visual identification of software evolution patterns.
In: 9
th
International Workshop on Principles of Software Evolution (IWPSE ’07): in Con-
junction with the 6th ESEC/FSE Joint Meeting (2007) 27–30
30. Mens, T., Fernandez-Ramil, J., Degrandsart, S.: The Evolution of Eclipse. In: IEEE ICSM
(2008) 386–395
31. Yu, L., Ramaswamy, S., Nail, A.: Using bug reports as a software quality measure. In:
Proceedings of the 16
th
ICIQ (2011)
32. Aggarwal, K.K., Singh, Y., Kaur, A., Lalhotra, R.: Empirical analysis for investigating the
effect of object-oriented metrics on fault proneness: A replicated case study. In: Software
Process: Improvement and Practice, Vol. 16, No. 1 (2009)
33. Fernandez-Ramil, J., Lozano, A., Wermelinger, M., Capiluppi, A.: Empirical studies of
Open-Source Evolution. In: Mens Tom and Demeyer, Serge eds. Software Evolution. Ber-
lin:Springer (2008) 263–288
34. Chidamber, S.R., Kemerer, C.F.: A metric suite for object-oriented design. In: IEEE Trans-
actions on Software Engineering, Vol. 20, No. 6 (1994) 476–493
44
