
Which is the Impact of adding Traceability support over
the Quality of ATL Model Transformations?
Iv
´
an Santiago, Juan M. Vara, Valeria de Castro and Esperanza Marcos
Kybele Research Group, Rey Juan Carlos University,
Avda. Tulip
´
an S/N, 28933 M
´
ostoles, Madrid, Spain
Abstract. Model-Driven Engineering (MDE) provides a new landscape for the
management of traceability, which plays a key role when dealing with software
evolution. Since model transformations are the wheel that drives MDE proposals
forward, traceability data can be automatically available in MDE projects. To that
end, the implicit traceability relationships contained in any model transformation
has to be made explicit by enriching the model transformation with traces gen-
eration capabilities. However, this refinement process implies a cost in terms of
quality: enriched transformations are intuitively more complex. To back such in-
tuition, this work presents an empirical study to assess the impact over the quality
of the enrichment of ATL model transformations.
1 Introduction
The management of traceability in software development projects implies keeping track
of the relationships between the different software artifacts produced along the process.
This way, appropriate management of traceability helps to monitor the evolution of
system components and carry out different software activities such as change impact
assessment, requirements validation, maintenance tasks, etc. [1].
Unfortunately, generating and maintaining links among different software artifacts
is a tedious, time-consuming and error prone task if no tooling support is provided
to that end [2]. In this sense, the advent of the Model-Driven Engineering (MDE)
paradigm, which principles are to enhance the role of models and to increase the level
of automation all along the development process [3], provides a new landscape that
can positively influence the management of traceability [4]. Indeed, MDE brings new
scenarios where appropriate management of traceability is almost mandatory, such as
model synchronization or incremental model changes [5], all of them particular scenar-
ios of software evolution.
The key to foster automation in MDE projects are the model transformations that
connect the different models involved in the proposal [6]. Simply put, a model trans-
formation defines a set of relationships between the elements of source and target
metamodels that must hold between the elements of the models conforming to such
metamodels [7]. Therefore, a model transformation contains implicit information from
which trace-links (traces) can be derived. Actually, such links can be seen as instances
of the relationships defined at metamodel-level. Therefore, if we made explicit this
Santiago I., M. Vara J., de Castro V. and Marcos E..
Which is the Impact of adding Traceability support over the Quality of ATL Model Transformations?.
DOI: 10.5220/0004602700750084
In Proceedings of the 1st International Workshop in Software Evolution and Modernization (SEM-2013), pages 75-84
ISBN: 978-989-8565-66-2
Copyright
c
2013 SCITEPRESS (Science and Technology Publications, Lda.)

information in the model transformation itself, it could generate, apart from the corre-
sponding target models, an extra model which contains the traces between the elements
of the models involved in the transformation.
Nevertheless, the enrichment of model transformations to support the production of
traces model might have an impact over the quality of the transformation. This paper
focuses on the assessment of such impact. To that end, it leans on some previous works
by van Amstel and van den Brand [8, 9] who defined a set of quality metrics for model
transformations and tried to relate them with some quality attributes
1
.
In particular, this work provides an empirical study of the impact of enriching ATL
(Atlas Transformation Language) [11] model transformations. To that end, an heuristic
to obtain quantitative indicator to assess the quality of model transformations is in-
troduced. Such indicator is then used to compare standard and enriched versions of 7
model transformations with different levels of complexity.
The rest of this work is structured as follows: Section 2 introduces the proposal
from van Amstel and van den Brand; Section 3 presents the empirical study and the
analysis of results; and finally Section 4 concludes by highlighting the main findings
and providing directions for further work.
2 Quality Metrics for Model Transformations
Despite the crucial role of model transformations in MDE, few works focused on their
quality can be found in the literature. Probably the most mature are those from van
Amstel and van den Brand.
In [8] the authors propose a set of metrics for ATL model transformations. Such
metrics are classified into 4 groups: rule metrics, helper
2
metrics, dependency metrics
and miscellaneous. Besides, they introduce the ATL2Metrics tool that automates the
measurement process for any given (ATL) transformation.
Next, in [9] van Amstel and van den Brand lean on the previously defined metrics
to develop a proposal to assess the quality of model transformations. The idea was to
identify the relationships between the metrics and a set of quality attributes, namely
understability, modifiability, completeness, consistency, conciseness and reusability. To
that end, a poll on the quality of a given set of transformations was conducted between
ATL experts. To establish the relations between their observations and the data gathered
running the metrics, the Kendall correlation test was used. Main findings are summa-
rized in Appendix A).
3 Evaluation
In order to improve the rigor of this study, we have followed the guidelines for conduct-
ing case studies proposed by Runeson and Hst in [12]. In particular, we have adapted the
protocol used in [13] which is based on the proposal of Runeson and Hst. In essence,
the adapted protocol distinguishes a set of stages, namely: case selection, design and
execution, data collection and finally analysis and interpretation. The highlights of each
stage are presented as follows.
1
Formal definitions for these attributes can be found in [10], pp. 10
2
ATL helpers can be viewed as the ATL equivalent to methods. They make it possible to define
factorized ATL code that can be called from different points of an ATL transformation
76

3.1 Case Studies Selection
In order to consider different sizes and levels of complexity, 7 case studies were se-
lected. Their main features are summarized in Table 1. From left to right, the following
information is provided for each transformation: identifier (ID); name (Transformation);
functionality delivered (Purpose); # of lines of code (LOC); # of mapping rules (MR);
# of source and target models (IN/OUT).
Table 1. ATL transformations selected.
ID Transformation Purpose LOC MR IN/OUT
T1 ASD2WSDL Maps Abstract Service Descriptions (ASD) into WSDL
models.
236 13 1/1
T2 Class2Relational Maps UML class diagrams into relational models. 112 6 1/1
T3 Families2Persons Maps Families models into People models. 46 2 1/1
T4 SQL20032ORDB4ORA Maps ORDB models that conform to the SQL:2003
standard into ORDB models for Oracle.
1247 51 1/1
T5 UML2SQL2003 Maps UML class diagrams annotated by means of a
AMW (Atlas Model Weaver) models into ORDB mod-
els that conform to the SQL:2003 standard.
2181 66 2/1
T6 UML2XMLSchema Maps UML class diagrams annotated by means of a
AMW models into XSD models.
459 13 2/1
T7 WSDL2ASD Maps WSDL models into ASD models. 190 9 1/1
TOTAL 4471 160 9/7
3.2 Design and Execution
The empirical study has been executed as follows:
(1) Original transformation is checked and run to collect the # of LOC and execution
time.
(2) ATL2Metrics is run over the transformation to gather values for each metric.
(3) Transformation is automatically enriched using the iTrace framework [14] to
support the production of trace models. This process is described in Appendix B.
(4) Enriched transformation is checked and run to collect the # of LOC and execution
time.
(5) ATL2Metrics is run over enriched transformation to gather values for each met-
ric.
(6) Steps 1 to 5 are repeated for each transformation under study.
(7) Data collected is analyzed.
The values gathered are then computed to obtain an overall indicator of the quality
of each model transformation. This computation is supported by the following heuristic
3
that exploits somehow the data provided by van Amstel and van den Brand.
Let n be the number of metrics, p the number of attributes and k the number of trans-
formations whose attributes we aim to estimate. Let X ∈ [−1, −1]
n×p
be the matrix
containing the Kendall correlation coefficients for each pair of metric and attribute. Let
Y ∈ R
n×k
be the matrix containing the metrics for each transformation. The objective
is to estimate a matrix
˜
Z ∈ [0, −1]
p×k
with the attributes for each transformation.
3
Authors would like to thank Dr. Diego Vidaurre, from the Oxford center for Human Brain
Activity, for his valuable advice on the statistical analysis of the results.
77

Then, as equation (1) shows we can compute Z just as the weighted average of
the corresponding metrics, where the weights are given by the correlation coefficients.
Finally, equation (2) scales
˜
Z so that each element ranges from 0 to 1.
Z
jl
=
P
n
i=1
Y
il
· X
ij
P
n
i=1
|X
ij
|
(1)
˜
Z
jl
=
Z
jl
− min (Y
·l
)
max (Y
·l
) − min (Y
·l
)
(2)
3.3 Data Collection
Table 2 summarizes the results obtained from the execution of the previous process.
First column identifies the transformation under consideration, where Tx stands for the
original version of the transformation and Tx’ for the enriched one.
Then the value for each quality attribute, as well as the overall value (arithmetic
average) for each transformation are shown. Note that an additional value is shown
in those rows corresponding to enriched transformations. It states the difference be-
tween the values obtained by the original and enriched versions of the transformations.
For instance, the understability value for T1 is 0.93 whereas the one for T1’ is 0.75.
Understability of T1 has consequently decreased 18.43% because of the enrichment
process.
Last row sums up the data by showing the average values and differences of each
attribute and the overall indicator.
Table 2. Data collection overview.
Transf. Comple. Modifi. Consis. Reusab. Concis. Unders. Quality
T1 0.96 1.00 0.88 0.88 0.96 0.93 0.93
T1’ 0.60 -36.64% 0.90 -9.89% 0.71 -17.04% 0.70 -18.10% 0.71 -24.47% 0.75 -18.43% 0.73 -20.76%
T2 1.00 1.00 0.96 0.96 0.97 0.97 0.98
T2’ 0.69 -30.95% 0.90 -9.89% 0.78 -17.04% 0.78 -18.10% 0.73 -24.47% 0.80 -16.79% 0.78 -19.54%
T3 0.84 1.00 1.00 1.00 0.99 1.00 0.97
T3’ 0.65 -19.05% 0.90 -9.89% 0.83 -17.04% 0.82 -18.10% 0.75 -24.47% 0.88 -12.36% 0.80 -16.82%
T4 0.55 1.00 0.38 0.40 0.66 0.93 0.65
T4’ 0.34 -21.13% 0.91 -8.90% 0.21 -17.04% 0.22 -17.95% 0.40 -25.85% 0.71 -21.26% 0.47 -18.69%
T5 0.71 0.09 0.22 0.22 0.31 0.22 0.29
T5’ 0.33 -37.18% 0.00 -9.44% 0.00 -21.58% 0.00 -22.47% 0.00 -30.59% 0.00 -22.10% 0.06 -23.89%
T6 0.32 0.37 0.89 0.85 0.90 0.47 0.63
T6’ 0.00 -32.02% 0.27 -9.82% 0.67 -21.73% 0.62 -22.60% 0.59 -30.60% 0.26 -20.29% 0.40 -22.84%
T7 1.00 1.00 0.92 0.92 1.00 0.97 0.97
T7’ 0.64 -35.95% 0.90 -9.89% 0.75 -17.04% 0.74 -18.10% 0.76 -24.47% 0.80 -16.67% 0.76 -20.35%
Average 0.62 -30.42% 0.73 -9.68% 0.66 -18.36% 0.65 -19.34% 0.69 -26.42% 0.69 -18.27% 0.67 -20.41%
3.4 Analysis and Interpretation
To ease the analysis and interpretation of the data collected, we first introduce the main
findings to later dig into the data collected regarding each quality attribute.
General Overview. According to Table 2, the enrichment of model transformations
to support the production of trace models has a negative impact over the quality of
the transformations. On average such impact is about 20%. This negative influence
becomes more pronounced as the quality of the original transformation gets worse. See
for instance the impact of enrichment over the quality of T5.
78

As a matter of fact, these evidences are alined with the initial intuition since the
enrichment of the transformations implies adding extra LOC to implement the machin-
ery that will generate the traces. Besides, bigger transformations are more affected: the
more mapping rules the original transformation contains, the more machinery have to
be added in the enriched version of the transformation.
Completeness. The quality attribute most negatively affected by the enrichment pro-
cess is completeness (30.42% on average). According to the Kendall’s coefficient table
(see Appendix B, it shares some metrics with the rest of quality attributes. However, the
completeness values obtained for the different transformations do not follow the same
trend than those of the rest of attributes. Therefore, we may conclude that complete-
ness values are mainly derived from the Helper cyclomatic complexity, #
Direct copies, # Imported units and Rule fan-out metrics since they
are related just to the completeness attribute. Indeed, the negative impact could be
granted almost exclusively to the Rule fan-out metric
4
. In the enriched transfor-
mations produced by iTrace, an auxiliary mapping rule is called for each element
in the source and target pattern of every mapping rule. As a result, complete mapping
rules (those able to produce target elements without calling other rules or helpers) are
turned into non-complete mapping rules in the enriched version of the transformation,
with the consequent impact over completeness of the transformation.
Modifiability. In contrast with the impact on completeness, modifiability is the quality
attribute least affected by the enrichment process (9.68% on average). The value of this
attribute is mainly conditioned by the number of units and source and target models
involved in the transformation. As well, the use of constructions that raise the level of
coupling, like the resolveTemp
5
operation has a negative impact on modifiability.
As a matter of fact, the enriched transformations produced by iTrace do not imply
the addition of building-blocks that raise the level of coupling or new units. Besides, the
data show that the impact on modifiability does not depend on the size of the original
transformation.
Consistency, Reusability and Conciseness. Unfortunately, the conclusions regarding
consistency, reusability and conciseness are not conclusive. This is mainly due to the
metrics proposed by van Amstel and van den Brand. Back to the table, transformations
can be grouped into two categories attending to the values for these attributes. First
group comprises T1, T2, T3, T4 and T7. Second group comprises T5 and T6 trans-
formations. If we check which are the features shared by each group, we find out that
transformations in the first group involve two source models, while those in the second
group involve just one source model.
Nevertheless, Table 3 shows that, in theory, there is no relation between the met-
ric computing the number of source models # Input models and the values for
three attributes. In order to explain this paradox, we focus on the metrics shared by
the attributes under study in this section, namely # Called rules and # Unused
called rules.
4
The Rule fan-out metric computes the average number of external invocations, e.g. a
mapping rule invokes a helper or another mapping rule
5
Allows pointing, from an ATL rule, to any of the target model elements that will be generated.
Its use goes against the declarative nature of ATL transformations.
79

The enrichment process supported by iTrace results in the addition of a called rule
for each source model. Such rule is in charge of linking each source element with its
corresponding model in the traces model produced. The more source models involved
in the original transformation, the more called rules added in the enriched version. The
# of source models has consequently a direct influence over the value delivered by
the # Called rules metric. All this given we can conclude that, according to the
metrics proposed by van Amstel and van den Brand, the # of source models has a
direct influence on the consistency, reusability and conciseness of an ATL (enriched)
transformation
Understandability. Understability is the attribute for which more scattered values are
obtained for enriched transformations, even though it shares a good number of metrics
with consistency, reusability and conciseness, for which a common trend was found.
Therefore, we focus on the # Elements per output pattern
6
metric, since
it is the only metric solely related with understability.
Given a mapping rule containing n elements in the source an target patterns, the
enriched version of such rule contains n + 1 additional elements in the target pattern.
These additional elements serve to generate n references to the source and target ele-
ments related by the rule, plus a trace link element that connect them. The addition of
these elements contributes obviously to increment the # Elements per output
pattern with the consequent impact on understability.
Under the light of these observations, it becomes clear that the disparity in the values
for understability comes from the disparity on the values returned by the # Elements
per output pattern for the original transformations.
4 Conclusions
In order to reason about the cost of having traceability data in MDE projects, this work
has presented an empirical study to assess the impact of enriching model transforma-
tions over their quality. In particular, the quality of 7 ATL [11] model transformations
owning different levels of complexity was assessed before and after the enrichment
process.
To do so, an heuristic has been defined that combines the data provided by battery of
metrics related with a set of quality attributes [9]. The heuristic provides a measure for
each quality attribute as well as an overall quality measure. Finally, the values gathered
have been compared and analyzed.
Probably, the main contribution of this paper is to provide empirical evidence to
confirm the intuitive knowledge about the impact of adding trace generation support to
model transformations. The data collected show that the quality of enriched versions
is worse than that of original transformations (the loss rate is about 20%). This impact
has a direct consequence over the effort needed for the maintenance of enriched model
transformations.
In order to alleviate this impact we advocate in favor of using model-based tech-
niques. To do so, we must adopt the approach introduced by B
`
ezivin et al. to deal with
model transformations as transformations models [15]. From there on, model transfor-
mations can be used to handle and produce transformation models. As a matter of fact,
6
Average # of elements per output pattern.
80

this work has partially shown that this approach can be effectively adopted. The com-
pletely automated enrichment process supported by iTrace is largely based on the use
of transformation models.
To conclude, we would like to introduce two considerations about the validity of the
study. On the one hand, the results might be partially biased by the nature of the particu-
lar enrichment process adopted. The trace models generated by the enriched transforma-
tions produced by iTrace conform to a particular traces metamodel that was defined
as part of the proposal. If a different (traces) metamodel is used, the refinements over
the original transformation might be different, as well as the results delivered by the
metrics when computed over the enriched version of the transformation.
This drives us to the main threat to validity: the metrics proposed by van Amstel
and van den Brand [8, 9] and their relation with the quality attributes. To address this
issue we are reviewing the metrics in order to add new metrics, as well as refine and
eliminate some others. Besides, we plan to carry out a new survey in order to have data
to apply a mathematically solid regression methodology to correlate metrics and quality
atributes.
Acknowledgements
This research is partially funded by the MASAI project, financed by the Spanish Min-
istry of Science and Technology (Ref. TIN2011-22617).
References
1. Aizenbud-Reshef, N., Nolan, B., Rubin, J., Shaham-Gafni, Y.: Model traceability. IBM Sys-
tems Journal 45 (2006) 515–526
2. M
¨
ader, P., Gotel, O., Philippow, I.: Enabling automated traceability maintenance through the
upkeep of traceability relations. In: Proceedings of the 5th European Conference on Model
Driven Architecture - Foundations and Applications, Enschede, The Netherlands, Springer-
Verlag (2009) 174–189
3. Schmidt, D.C.: Model-Driven Engineering. IEEE Computer 39 (2006) 25–31
4. Santiago, I., Jim
´
enez, A., Vara, J.M., De Castro, V., Bollati, V., Marcos, E.: Model-Driven
Engineering As a New Landscape For Traceability Management: A Systematic Review. In-
formation and Software Technology 54 (2012) 1340–1356
5. Selic, B.: What will it take? A view on adoption of model-based methods in practice. Soft-
ware and Systems Modeling (2012) 1–14
6. B
`
ezivin, J.: In search of a basic principle for model driven engineering. UPGRADE – The
European Journal for the Informatics Professional 5 (2004) 21–24
7. Sendall, S., Kozaczynski, W.: Model transformation: the heart and soul of model-driven soft-
ware development. Software, IEEE 20 (2003) 42–45
8. van Amstel, M. F., van den Brand, M.G.: Quality assessment of ATL model transformations
using metrics. In: Proceedings of the Third International Workshop on Model Transformation
with ATL (MtATL 2010). Volume 711. (2010) 19–33
9. van Amstel, M. F., van den Brand, M.G.: Using metrics for assessing the quality of ATL
model transformations. In: Proceedings of the Third International Workshop on Model
Transformation with ATL (MtATL 2011). Volume 742. (2011) 20–34
10. van Amstel, M. F., Lange, D., van den Brand, M.G.: Evaluating the quality of ASF+SDF
model transformations. Technical report, Eindhoven (2009)
81

11. Jouault, F., Allilaire, F., B
`
ezivin, J., Kurtev, I.: ATL: A model transformation tool. Science
of Computer Programming 72 (2008) 31–39
12. Runeson, P., H
¨
ost, M.: Guidelines for conducting and reporting case study research in soft-
ware engineering. Empirical Softw. Engg. 14 (2009) 131–164
13. P
´
erez-Castillo, R., De Guzman, I., Piattini, M.: Knowledge discovery metamodel-iso/iec
19506: A standard to modernize legacy systems. Computer Standards & Interfaces Journal
33 (2011) 519–532
14. Santiago, I., Vara, J.M., De Castro, V., Marcos, E.: iTrace: un framework para soportar el
an
´
alisis de informaci
´
on de trazabilidad en proyectos de Desarrollo Software Dirigidos por
Modelos. In: XVII Jornadas de Ingenier
´
ıa del Software y Bases de Datos (JISBD 2012),
Almer
´
ıa (Spain) (2012) 491–504
15. B
`
ezivin, J., B
¨
uttner, F., Gogolla, M., Jouault, F., Kurtev, I., Lindow, A.: Model transforma-
tions? transformation models! In: Proceedings of the 9th international conference on Model
Driven Engineering Languages and Systems. MoDELS’06, Berlin, Heidelberg, Springer-
Verlag (2006) 440–453
16. Tisi, M., Cabot, J., Jouault, F.: Improving higher-order transformations support in ATL. In:
International Conference on Model Transformation. (2010) 1–10
17. Jouault, F.: Loosely coupled traceability for ATL. In: Proceedings of the European Con-
ference on Model Driven Architecture (ECMDA) Workshop on Traceability, Nuremberg,
Germany. Volume 91. (2005)
18. Jouault, F., B
`
ezivin, J., Kurtev, I.: TCS: a DSL for the specification of textual concrete syn-
taxes in model engineering. In: Proceedings of the 5th international conference on Generative
programming and component engineering. GPCE ’06, New York, NY, USA, ACM (2006)
249–254
19. Vara, J. M., Marcos, E.: A framework for Model-driven development of information Sys-
tems: Technical decisions and lessons learned. Journal of Systems and Software 85 (2012)
2368 – 2384
Appendix
A Kendall’s Coefficient
From [9], pp.26:
”This test returns two values, viz. a correlation coefficient (cc) and a sig-
nificance value (sig). The correlation coefficient indicates the strength and di-
rection of the correlation. A positive correlation coefficient means that there is a
positive relation between metric and quality attribute and a negative correlation
coefficient implies a negative relation. The significance indicates the probabil-
ity that there is no correlation between metric and quality attribute even though
one is reported, i.e., the probability for a coincidence. Note that correlation
does not indicate a causal relation between metric and quality attribute.”
Table 3 shows the correlations that were identified in the study of van Amstel and van
den Brand.
B Enriching Model Transformations with iTrace
iTrace leans on the fact that any model transformation can be represented as a (trans-
formation) model [15] and on the use of Higher-Order Transformations (HOTs). In
82

Table 3. Kendall’s correlations (from [9]).
Metric Comple. Modifi. Consis. Reusab. Concis. Unders.
cc sig cc sig cc sig cc sig cc sig cc sig
# Elements per output pattern -.228 .180 -.215 .202 .124 .472 -.146 .389 -.122 .474 -.375 .026
# Calls to resolveTemp() -.159 .380 -.358 .045 -.088 .632 -.236 .189 -.179 .323 -.352 .049
# Calls to resolveTemp per rule -.106 .558 -.306 .087 -.061 .741 -.236 .189 -.153 .399 -.326 .068
# Parameters per called rule -.391 .038 -.407 .029 -.122 .524 -.345 .066 -.218 .249 -.407 .029
# Unused parameters per called rule -.391 .038 -.407 .029 -.122 .524 -.345 .066 -.218 .249 -.407 .029
Called rule fan-in -.391 .038 -.407 .029 -.122 .524 -.345 .066 -.218 .249 -.407 .029
Unit fan-in -.391 .038 -.407 .029 -.122 .524 -.345 .066 -.218 .249 -.407 .029
Unit fan-out -.391 .038 -.407 .029 -.122 .524 -.345 .066 -.218 .249 -.407 .029
# Input models -.391 .038 -.407 .029 -.122 .524 -.345 .066 -.218 .249 -.407 .029
# Ouput models -.391 .038 -.407 .029 -.122 .524 -.345 .066 -.218 .249 -.407 .029
# Units -.391 .038 -.407 .029 -.122 .524 -.345 .066 -.218 .249 -.407 .029
# Unused helpers -.391 .038 -.407 .029 -.122 .524 -.345 .066 -.218 .249 -.407 .029
# Times a unit is imported -.379 .045 -.138 .459 .086 .654 -.084 .656 -.247 .192 -.318 .088
Lazy rule fan-in -.397 .021 -.143 .404 .005 .976 -.021 .905 -.062 .719 -.356 .037
Helper cyclomatic complexity -.357 .037 -.154 .364 -.026 .882 -.175 .304 .126 .461 -.248 .142
# Direct copies .322 .070 .040 .822 -.059 .745 -.125 .478 -.196 .271 .227 .197
# Imported units -.323 .078 -.080 .661 .110 .554 -.027 .883 -.223 .225 -.252 .164
Rule fan-out -.333 .046 -.124 .453 -.157 .351 -.235 .157 .024 .885 -.223 .175
Helper fan-out -.105 .537 .183 .278 .302 .081 .264 .120 .136 .426 .020 .907
# Transformation rules -.082 .623 -.086 .604 -.364 .031 -.273 .099 -.092 .582 .024 .885
# Called rules -.158 .389 -.263 .149 -.308 .098 -.365 .046 -.347 .060 -.128 .482
# Unused called rules -.158 .389 -.263 .149 -.308 .098 -.365 .046 -.347 .060 -.128 .482
# Rules with filter -.005 .977 -.038 .818 -.049 .771 -.129 .435 -.402 .016 -.005 .977
# Rules with local variables .032 .861 -.051 .780 -.137 .460 -.178 .328 .302 .100 -.013 .944
# Rules per input pattern -.130 .434 -.114 .489 .029 .861 -.014 .931 .315 .059 -.109 .507
# Unused input pattern elements -.033 .854 .059 .737 -.056 .758 .033 .854 .297 .097 -.032 .854
# Variables per helper .013 .944 .063 .727 -.111 .550 .178 .328 .328 .074 .006 .972
# Non-lazy matched rules .034 .839 .000 1.000 -.029 .861 -.129 .435 -.383 .022 .014 .931
# Helpers per helper name (overloadings) -.054 .769 -.066 .714 .220 .237 .060 .741 .007 .971 -.033 .855
# Variables per rule .070 .700 -.076 .676 -.111 .550 -.242 .184 .225 .220 -.038 .834
Helper fan-in -.024 .885 .000 1.000 -.236 .162 -.196 .236 -.005 .977 .138 .402
# Helpers -.201 .243 -.229 .180 -.047 .786 -.246 .152 .187 .281 -.178 .296
# Unused lazy matched rules -.152 .419 .138 .460 .026 .892 .076 .687 .217 .251 -.025 .893
# Rules with do-section -.057 .747 -.153 .385 .018 .922 -.108 .540 -.173 .332 .000 1.000
# Lazy matched rules -.201 .243 .041 .812 -.058 .741 .051 .765 .239 .168 -.081 .633
# Helpers per unit -.201 .243 -.229 .180 -.047 .786 -.246 .152 .187 .281 -.178 .296
[16], Tisi et al. defined HOTs as ”a model transformation such that its input and/or
output models are themselves transformation model”. This way, iTrace uses HOTs
to enrich existing m2m transformations so that they are able to produce not only the
corresponding target models, but also trace models.
This idea was first proposed by Jouault in [17] that introduced an initial prototype
to support the enrichment of ATL transformations. The enrichment process bundled
in iTrace is a little bit more complex than the one from [17], due to the increased
complexity of iTrace metamodels.
Fig. 1 depicts graphically the enrichment process for m2m transformations sup-
ported by iTrace: first, the TCS [18] injector/extractor for ATL files bundled in the
AMMA (Atlas Model Management Architecture) platform
7
produces a transformation
model from a given ATL transformation (a); next, such transformation model is en-
riched by a HOT (b) and finally the resulting transformation models is again serialized
into an ATL model transformation (c). As mentioned before, the execution of such en-
riched transformation will produce not only the corresponding target models, but also a
traces model.
With regard to the selection of ATL, there were two decisive factors. Firstly, ATL is
considered the de facto standard for the development of model transformations [19] and
7
The AMMA Platform. Available in: http://www.sciences.univnantes.fr/lina
/atl/AMMAROOT/.
83
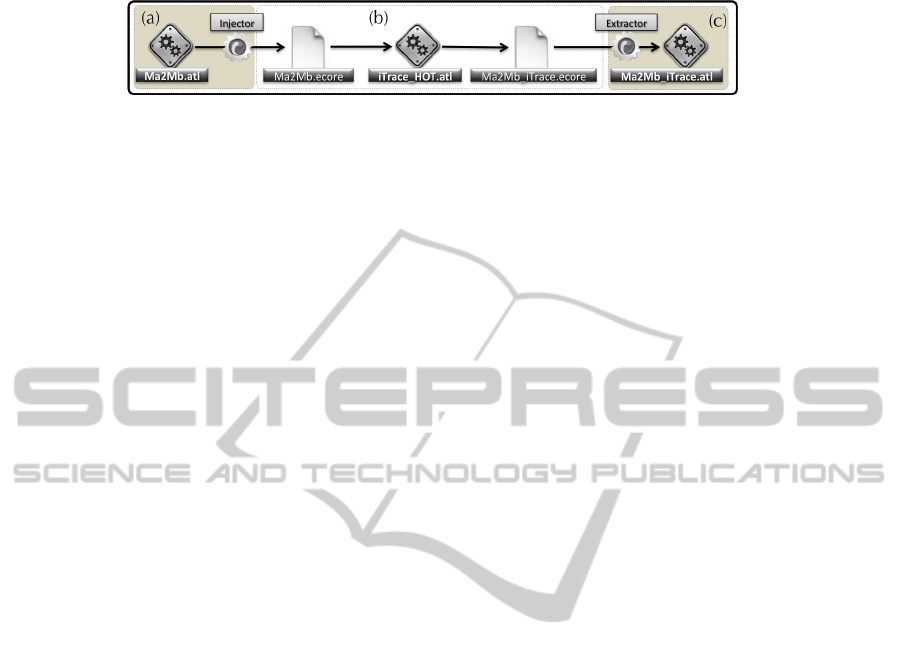
Fig. 1. Adding traceability capabilities in ATL transformations - adapted from [17].
it has additionally been developed according to MDE principles. As a result, it provides
a complete metamodel that allows ATL model transformations to be modeled without
the need to define a new metamodel. Note that the the metrics defined by van Amstel
and van den Brand are computed by executing a set of model transformations over the
transformation models obtained from the source-code that implements the transforma-
tions under study.
However, the evaluation of other transformation languages is technically feasible,
since any metamodel-based transformation language facilitates obtaining a transforma-
tion model from a given transformation. Computing the metrics for such language only
requires the adaptation of the set of transformations aforementioned to the metamodel
of the targeted language.
84
