
SignalBIT
A Web-based Platform for Real-time Biosignal Visualization and Recording
Ana Priscila Alves
1
, Hugo Pl´acido da Silva
1
, Andr´e Lourenc¸o
1,2
and Ana Fred
1
1
Instituto de Telecomunicac¸˜oes, Instituto Superior T´ecnico, Avenida Rovisco Pais, 1, 1049-001 Lisboa, Portugal
2
Instituto Superior de Engenharia de Lisboa, Rua Conselheiro Em´ıdio Navarro, 1, 1959-007 Lisboa, Portugal
Keywords:
Biosignals, Data Acquisition, Data Visualization, Web Technologies.
Abstract:
Biosignals have had an increasingly important role in the research and development of new applications for
healthcare, sports, quality of life, and many other fields. Still, researchers are often faced with problems
related with the ease-of-use and practicality of software tools for rapid prototyping of applications that involve
biosignal acquisition and processing. Typically, there are either highly flexible scientific computing tools or
custom developed and application-specific tools, the former being often characterized by long learning curves
and limited user interface design capabilities, while the latter is often characterized by poor cross-platform
compatibility, and overheads in terms of development time when new features are needed. In this paper we
present a versatile, flexible, and extensible software framework for rapid prototyping of end-user applications,
specifically targeted at biosignal acquisition and post-processing. We build on the advantages of combining
web technologies with the Python programming language, to improve the usability, interaction, cross-platform
compatibility, extensibility, and flexibility of biosignal-based applications.
1 INTRODUCTION
Over the last decade, the use of biosignals has in-
creased significantly, and nowadays several disci-
plines both from the medical and engineering domain
benefit from their use; these include sports perfor-
mance, physical rehabilitation, ergonomics and qual-
ity of life. The widespread use of biosignals in a
large variety of applications demonstrates that it is
an increasingly growing field of interest in academia
and industry (Helal et al., 2008; Petta et al., 2011;
Schwartz and Andrasik, 2005; AliveCor, 2012; Adi-
das, 2012), however in the context of biosignal re-
search, a major bottleneck is the rapid prototyping of
high impact end-user applications.
Tools such as MATLAB
R
, Simulink
R
,
LabVIEW
R
and others alike, are quite compre-
hensive and versatile, but their capabilities for
development of modern user-interfaces are limited,
and these tools require extensive training, which
may not be accessible to the broadest research com-
munity. On the other hand, WYSIWYG tools such
as Dreamweaver, Apple iWeb, Microsoft Publisher
and others, that allow easy creation of modern user
interfaces, lack the performance, flexibility, and
computational power to deal with the requirements of
biosignal analysis. Furthermore, software developed
in high performance programming languages such
as C/C++, has poor cross-platform compatibility,
and vendor-specific tools are mostly monolythic and
designed to enable basic visualization with interfaces
that are hard to use for non technically proficient
users (Biopac, 2013; Shimmer, 2012).
In the overall, there is a need for software ar-
chitectures and tools that can overcome the limita-
tions of existing approaches. Web technologies have
changed many established paradigms in software de-
velopment, by allowing the creation of user-friendly
applications with multi-tier architecture, without re-
quiring complex development or deployment proce-
dures. Since they only require a compatible web
browser, there is a high cross-platform compatibil-
ity; and with the advent of HTML5, programmers can
create rich interactive environments natively within
browsers, allowing the development of tools that eas-
ily meet users needs.
In this paper, we present a platform and software
framework that enables rapid prototyping of end-user
software applications, involving seamless use and vi-
sualization of biosignals. Our work contributes to
the widespread use of these signals, increasing the
possibilities for their study in multiple engineering
156
Priscila Alves A., Plácido da Silva H., Lourenço A. and Fred A..
SignalBIT - A Web-based Platform for Real-time Biosignal Visualization and Recording.
DOI: 10.5220/0004612001560162
In Proceedings of the 10th International Conference on Signal Processing and Multimedia Applications and 10th International Conference on Wireless
Information Networks and Systems (SIGMAP-2013), pages 156-162
ISBN: 978-989-8565-74-7
Copyright
c
2013 SCITEPRESS (Science and Technology Publications, Lda.)
and non-engineering contexts, such as biomedical,
electrical and mechanical engineering, computer sci-
ence, informatics, sports science, psychology, neu-
rosciences, medicine and many more. In previous
work by our group, we have developed an application
for off-line data annotation and ground-truth collec-
tion (Lourenc¸o et al., 2013) Now, the main motiva-
tion for our contribution was the need for an easy-to-
use, versatile and scalable software for biosignals vi-
sualization in real-time, capable of direct interaction
with an acquisition device, the BITalino (Alves et al.,
2013), also a result from previous research done by
our group.
This paper is organized as follows: Section 2 de-
scribes the architecture used in our application and
the biosignal visualization software framework; Sec-
tion 3 providesexperimental results obtained from the
software performance and usability standpoints; and
finally, Section 4 highlights the main conclusions and
future work perspectives.
2 SYSTEM ARCHITECTURE
Our framework was designed under a Model-View-
Controller (MVC) architecture, decoupling the pre-
sentation from the processing and persistency layers,
as proposed in (Silva et al., 2012). This approach has
the advantage of dividing the application into inde-
pendent and interchangeable modules, which can be
developed in different platforms, and with the possi-
bility of reusability. In the approach presented in this
paper, the system is divided into 3 main modules, as
represented in Figure 3: a) View, a front-end based on
Web technologies that displays the user interface and
allows all the interaction; b) Controller, where all the
events triggered in the user interface are mapped into
operations; c) Model, which coordinates the applica-
tion logic by evaluating the messages received by the
controller, executing the operations and producing re-
sults.
2.1 View
One of the requirements for our work was for the
front-end to provide intuitive and interactive inter-
faces. Web browsers currently offer the versatility of
being used in all operative systems, combined with
the possibility to create a rich user interface expe-
rience with relative ease of layout design and for-
matting. The HTML is the base technology, which
is responsible for modelling the web page structure.
Alongside with this technology there are the Cascad-
ing Style Sheets (CSS), which controls the style and
layout of the web page. JavaScript provides a compre-
hensive set of functions for user-interface event han-
dling, interaction logic, and browser-side computing.
Our web application user interface was designed
recurring to HTML5 and CSS3, the latest standards
that offer means for producing aesthetical, simple and
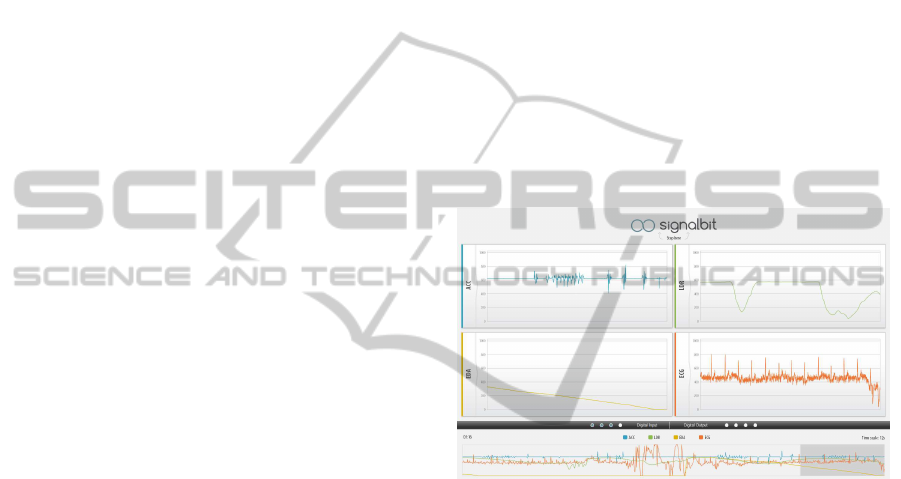
intuitive front-ends. Figure 1 shows the overall inter-
face that we entitled SignalBIT. A global overview
plot on the bottom of the work area provides a 1
minute summary of all the analog channels being ac-
quired. The graphics on the center of the screen show
the individual channels, which in this case are Ac-
celerometer (ACC), Light Dependent Resistor (LDR),
Electrodermal Activity (EDA) and Electrocardiogra-
phy (ECG) sensor, and finally, in the separation be-
tween the two areas we can visualyze the state of the
digital inputs or change the state of the digital outputs,
by clicking on the 4 buttons on the right.
Figure 1: SignalBIT application user interface.
The major interaction is provided by the menu,
shown in Figure 3, which contains the following op-
tions: a) Start/Stop acquisition; b) Choose acquisi-
tion configurations, such as the number of channels to
be acquired, or the device to communicate with; and
c) Save the recorded data for later processing.
When the user starts a new recording session, the
signals start to appear in each corresponding plot, as
represented in Figure 1. By default, the timespan
of the individual graphics shown corresponds to 12
seconds of signal acquired, marked as grey in the
overview plot, however, the user can change the time
scale by pressing the left or right arrow keyboard
keys, increasing or decreasing, respectively, from 1
to 30 seconds. Figure 2 a) and b) represent the visu-
alization result of changing the time scale. The user
can also change the scale amplitude by zooming or
change the offset of the graphic. The zoom event
is triggered by pressing the ’plus’ key for zoom out
and ’minus’ for zoom in. The user can also adjust the
baseline of the signal by pressing the up or down ar-
row keys. In Figure 2 c) and d), we depict the result
SignalBIT-AWeb-basedPlatformforReal-timeBiosignalVisualizationandRecording
157
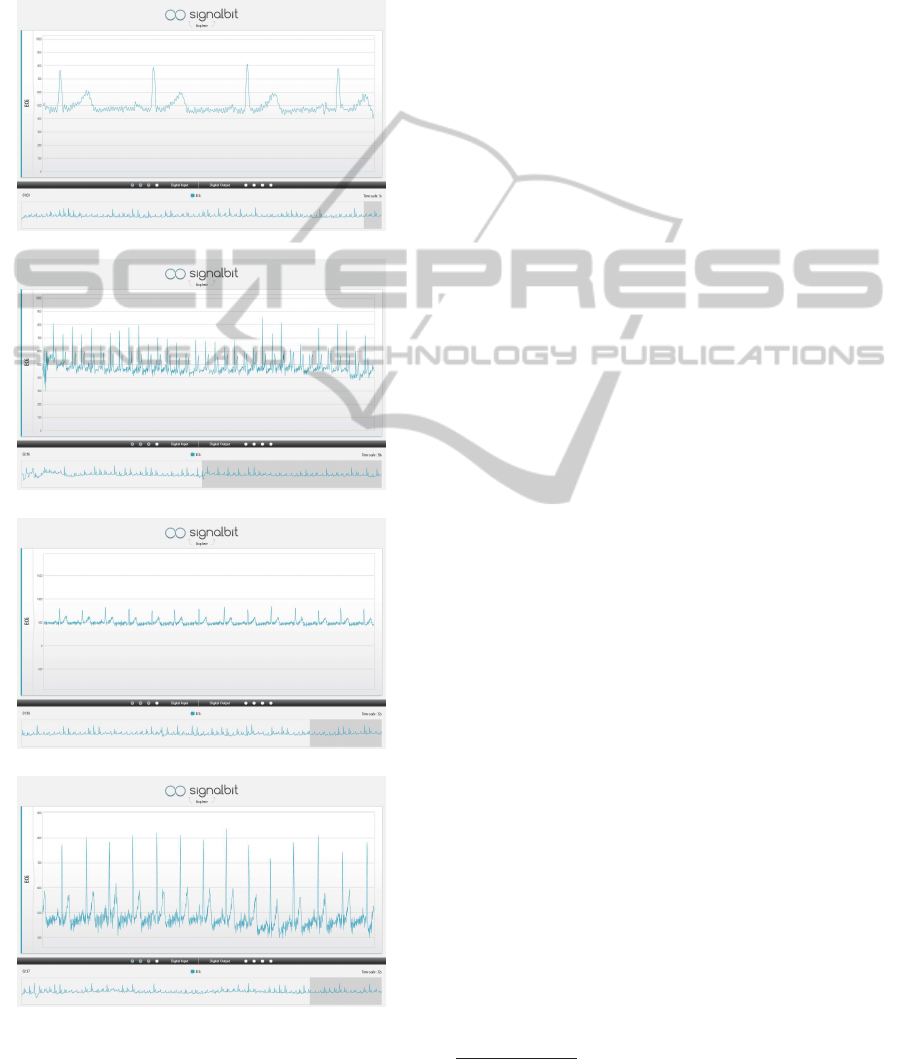
of a zooming operation, where, in this case, the ECG
signal can be seen in more or less detail. All the in-
teraction was inspired by the use of an oscilloscope,
since it is a reference in what concerns to signals visu-
alization and experimentingin electronic laboratories.
(a) TimeSpan 3s
(b) TimeSpan 30s
(c) Zoom In
(d) Zoom Out
Figure 2: ECG signal visualization in different timespans
and zooming levels.
2.2 Controller
The interface between the view and the model is
managed by the controller. It was implemented in
JavaScript (JS), using a fast, small, and feature-rich
JavaScript library named jQuery(McFarland, 2011),
which includes the animations and handles the user
interface events. For plotting, we rely on the now
widely used Flot library
1
, a JS plotting API for
jQuery.
The communication between the view and the
model is based on the WebSocket standard, which
implements a full-duplex single socket connection,
simplifying the complexity around bi-directional web
communication and connection management (Wang
et al., 2012). We use this approach to enable the
user interface to trigger model actions, decoupling the
logic operations from the visualization. The messages
exchanged correspond to Python commands or func-
tions already implemented in the model. As such,
when a command is received through the model in-
put stream in Python, a function (”dataReceived()”)
is called, and the message received is evaluated and
executed. Likewise, the model can send messages
to the client through the output stream, formatted in
the same way, that is, with messages corresponding
to JavaScript functions, evaluated on arrival. The ar-
guments of the functions received in the controller
side rely on the JSON notation, a standard data-
interchange format, used in a large variety of pro-
gramming languages, and which is quite convenient,
given that it is the native data representation format in
JavaScript.
2.3 Model
The model is implemented using a high-performance
back-end in Python, which is responsible for the con-
nection with the BITalino device via Bluetooth and
for all the data processing and storage. It is divided
in three main processes, which are responsible for:
a) General operations, such as the access to the file
system or retrieve previously stored session configu-
ration and settings; b) Acquisition, using the Blue-
tooth socket (which in our case is supported by the
PyBluez API
2
), and receivingthe data from the BITal-
ino in real-time; and finally c) Formating, where the
signals acquired are formatted as a JSON object with
a format interpretable by the Flot JS API.
To better understand the acquisition process, we
will first focus on the data received through the Blue-
tooth socket. The BITalino device is responsible for
1
http://www.flotcharts.org/
2
https://code.google.com/p/pybluez/
SIGMAP2013-InternationalConferenceonSignalProcessingandMultimediaApplications
158
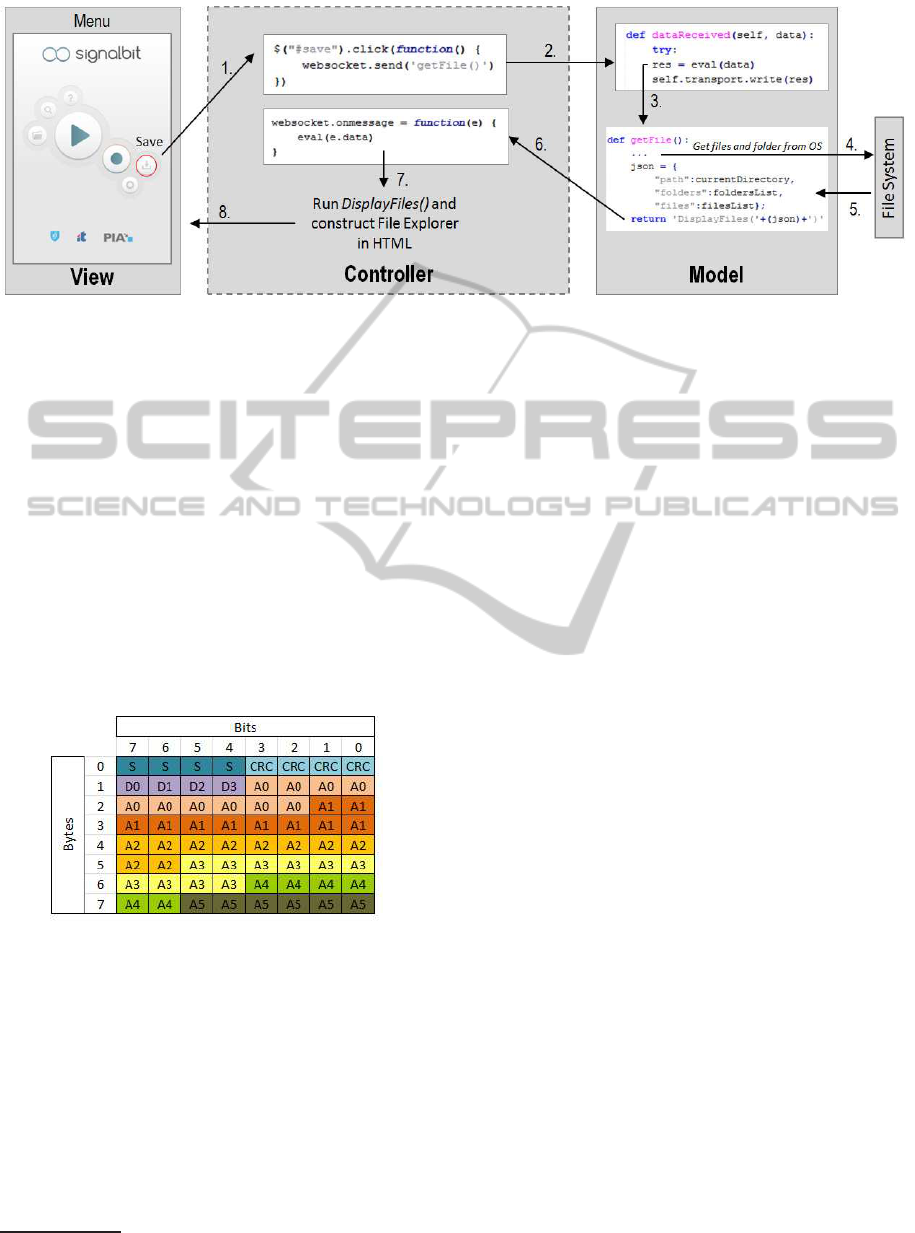
Figure 3: System Architecture.
acquiring the analog channels previously selected by
the user in the view interface. The acquired data is
sent through a Bluetooth transceiver to a base sta-
tion(where the SignalBIT is running), with a specific
encoding, to make the most efficient use of the avail-
able bandwidth on the communication channel, send-
ing packets as represented in Figure 4. Each sample
corresponds to a 4 to 8 bytes packet that includes a
sequence number, a 4-bit Cyclic Redundancy Check
(CRC) value, and the sampled values for 4 digital in-
puts and up to 6 analog channels. Each packet re-
ceived through the socket is saved in a buffer and
when it reaches 300 samples, they are decoded, con-
verted to the data structure interpretable by the Flot
JS API, and sent to the controller.
Figure 4: Data packets structure.
The model uses the Twisted
3
protocol for commu-
nication with the controller, an event-driven network-
ing engine written in Python. Once the back-end is
launched, it waits for a client to successfully estab-
lish a connection and then the message exchanges be-
tween the controller and the model start.
Figure 3 shows an example of messages exchange
between the model, view and controller. The save
button click event (1), triggered in the user interface,
will be detected by the controller, which sends a mes-
sage to the model using the WebSocket protocol (2),
3
http://twistedmatrix.com/trac/
with the function getFile(). In the model, the message
is evaluated as a Python command, and the getFile()
function is executed (3). The result is a dictionary
(JSON format), with information about the files and
folders found in the current path (4). This dictionary
is sent to the controller (5) as an input variable of the
function DisplayFiles() implementedin the controller.
Consequently, the message received from the model
is firstly evaluated in the controller (6) and then the
function DisplayFiles() is executed (7), similarly to
what happens in the model. This function will cre-
ate a file explorer in the view module, by changing
the HTML with the new information retrieved (8),
namely the list of files.
3 RESULTS
The evaluation of the SignalBIT platform was divided
in two major aspects: performance and usability. The
performance determines the system responsiveness
and stability under a particular workload, while the
usability measures the clarity and ease-of-use associ-
ated with the human-computerinteraction. With these
two perspectives, we can assess on one hand the per-
formance of SignalBIT for core tasks in the process-
ing workflow, and the ease-of-use as evaluated by po-
tential end-users of the software.
3.1 Profiling
We evaluated the performance measuring the time
complexity of the program by recording the duration
of the main function calls. In the SignalBIT applica-
tion, we will focus on analysing the most important
functions associated with signal visualization in real-
time, evaluating both in the model and view.
In the model, we focused on the functions respon-
sible for: a) Decoding the messages received over the
SignalBIT-AWeb-basedPlatformforReal-timeBiosignalVisualizationandRecording
159
Bluetooth socket; b) Formatting the data sent to Flot;
and c) Transmitting data to the controller. In the con-
troller we will assess the time between receiving and
drawing the data.
The obtained results represent the average elapsed
time in each function call on the model for 500 ex-
changed messages. Each message represents 300
samples received from the acquisition hardware and
being decoded, prepared and sent to the controller.
The experiments were performed in a HP p6290pt
Desktop Computer, with Windows 7 64-bit operative
system, processor Intel(R)Core(TM) i5 CPU 750 @
2.67GHz and 8.00 GB of RAM memory.
Table 1: Profiling results, displaying the elapsed time (µ± σ
in milliseconds) for the three core operations of the model
(Decoding, Formatting data to Flot, Transmitting to the con-
troller), as well as for the controller displaying operation
(JS:JavaScript).
#Ch Decoding Formatting Transmitting JS
1 9.69±1.55 7.58±3.89 0.08±0.27 11.90±3.99
2 12.11±1.83 12.54±5.02 0.08±0.27 16.36±4.59
3 13.81±2.39 16.64±8.54 0.10±0.30 21.72±4.82
4 16.16±2.33 19.66±7.45 0.11±0.31 27.16±5.49
5 19.02±2.54 21.68±8.30 0.08±0.27 32.54±7.22
6 19.98±2.88 23.97±8.43 0.07±0.25 37.29±4.06
Table 1 summarizes the obtained results. As ex-
pected, the processing time increases with the num-
ber of channels, which is due to the increment in the
amount of data. There is a linear relation between
the amount of data and the number of analog chan-
nels being acquired, where from 1 to 6 channels, the
data received from the acquisition device goes from
900 to 2400 bytes in each message. The transmission
operation is the only one which does not vary signif-
icantly, due to the Websocket’s high speed communi-
cation when operating in localhost mode.
In the controller, the profiling was done by mea-
suring the time between the arrival of data and its dis-
play. The results in the controller follow the same pro-
gression as seen in the model, that is, as the number of
channels increases, the time spent between receiving
the data and displaying it, also increases.
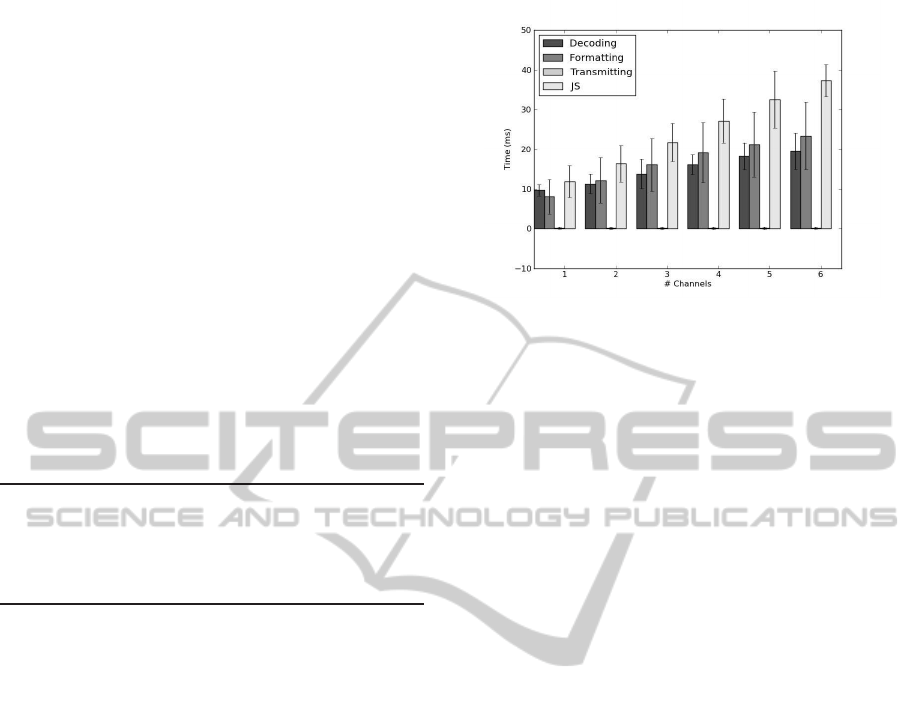
Figure 5 summarizes the profiling in the model
and controller, where the linear progression of the to-
tal time with the number of channels is visible. The
required time to acquire 300 samples is 300 ms, which
means that the time between decoding the samples
and displaying them in the view must be lower than
300 ms. The total time spent for 6 analog channels
(worst case scenario), is approximately 81 ms, pro-
viding enough time to receive the samples and show
them in real-time.
Figure 5: Profiling results for model (Decoding, Preparing,
Sending) and controller (JS: JavaScript).
3.2 Usability study
The usability test consisted of questionnaires based on
the System Usability Scale (SUS), designed to collect
qualitative data related to measurable usability crite-
ria, through direct user interviews. The SUS was de-
veloped in 1986 by Digital Equipment Corporation
(DEC) as a ten-item questionnaire giving a global as-
sessment of usability, i.e., the subjective perception
of interaction with a system (Brooke, 1996). Each
question is a statement and a rating on a five-point
scale from ”Strongly Disagree” to ”Strongly Agree”.
The SUS items have been developed according to the
three usability criteria established by the ISO 9241-
11: a) Effectiveness: interpreted as the ability of users
to complete tasks using the system, and successfully
achieve their objectives; b) Efficiency: the level of re-
sources consumed, and effort required in performing
tasks; c) Satisfaction: the users’ subjective reactions
to the use of the system. The SUS has had a great suc-
cess among usability practitioners since it is a quick
and easy-to-use measure of usability. According to
Bangor et al. (Bangor et al., 2008) the SUS is not bi-
ased against certain types of user interfaces or gender.
The target audience for this study was chosen
from four groups, which are representative of the
potential end-user populations: a) Biomedical en-
gineering students; b) Electrical engineering stu-
dents; c) Computer Sciences students; and d) Med-
ical Sciences students (non-proficient in the use of
computer-based signal acquisition software). None of
the groups had previous experience with the system,
and they were instructed to use the system, namely
to perform the following tasks: a) Start new acquisi-
tion; b) Stop acquisition; c) Save the recorded data
in a file.
The study was performed on 100 individuals, 25
for each group and the obtained results are detailed
in Table 2. We verified that in all the groups the
SIGMAP2013-InternationalConferenceonSignalProcessingandMultimediaApplications
160

Figure 6: System Usability Scale (SUS) score for 4 groups
of students: Biomedical Engineering (BME), Computer
Sciences (CS), Electrical Engineering (ECE) and Medical
Sciences (MS).
score was higher than 84 (well above the SUS average
score of 68), indicating that the system was generally
well accepted and easy-to-use, without requiring any
specific knowledge or background in computer-based
signal acquisition software.
We performed a one-way ANOVA test, using the
IBM SPSS Statistics Software, to analyse the differ-
ence between group means. The obtained F value was
1.043, and p-value was 0.377, which means that there
is no significant difference among the four analysed
groups.
From these results we can conclude with some
confidence that this is a user-friendly system, not only
relevant within the academia environment, but even
within a medical environment where we expected a
much lower degree of acceptance.
4 CONCLUSIONS
In this paper we presented the SignalBIT, an easy-
to-use software framework that can not only be used
to acquire biosignals in real-time, but also in multi-
ple dimensions of academic programs and workshops,
opening new research horizons and prospects. Our
work was geared towards the creation of a simpli-
fied albeit flexible and scalable framework that can
enable rapid application development of high impact
software prototypes involving real-time biosignal ac-
quisition and analysis.
We believe that this architecture has a good com-
promise solution between usability and performance
tradeoffs. Monolithic approaches implemented in
low-level languages such as C/C++ can be highly op-
timized for performance, however they generally have
very low cross-platform portability and provide poor
user interface design facilities. Approaches based
only on web-technologies on the other hand, have a
very high cross-platform portability and user inter-
face design facilities but are limitative in terms of
low-level operations. Our proposed system architec-
ture overcomes these limitations, by combining a per-
formant and cross-platform back-end that is Python,
with a web-based front-end. Experimental results
have shown that our approach has manageable per-
formance overheads, given the usability and user ac-
ceptance that it enables, as demonstrated by the over-
all and well above average scores obtained from the
System Usability Scale (SUS) assessment. We be-
lieve our framework introduces a novel approach to
the problem of rapid prototyping of end-user applica-
tions that deal with real-time biosignal acquisiton.
Future work will focus on further optimizing the
performance of the core operations performed by the
Model, and on benchmarking and evolving our frame-
work to a web-based format.
Table 2: SUS Questionnaire: results of each question, in terms of mean (µ), and standard deviation (σ). The rating is on a five-
point scale from “Strongly Disagree” to “Strongly Agree”. The groups are labeled as follows: BME: Biomedical Engineering;
CS: Computer Science; ECE: Electrical and Computer Engineering; MS: Medical Sciences.
Question
BME CS ECE MS
I think that I would like to use this system frequently
4.28±0.123 4.20±0.129 4.12±0.176 4.41±0.105
I found the system unnecessarily complex
1.16±0.075 1.40±0.100 1.44±0.164 1.24±0.081
I thought the system was easy to use
4.80±0.082 4.64±0.098 4.72±0.108 4.72±0.084
I think that I would need the support of a technical person to be able to use this system
1.24±0.087 1.28±0.147 1.48±0.154 1.48±0.118
I found the various functions in this system were well integrated
4.52±0.117 4.40±0.141 4.52±0.117 4.21±0.135
I thought there was too much inconsistency in this system
1.24±0.087 1.32±0.111 1.36±0.098 1.41±0.105
I would imagine that most people would learn to use this system very quickly
4.68±0.111 4.48±0.143 4.68±0.138 4.41±0.117
I found the system very cumbersome to use
1.28±0.108 1.60±0.183 1.64±0.162 1.69±0.205
I felt very confident using the system
4.24±0.119 4.52±0.102 4.64±0.098 4.03±0.136
I needed to learn a lot of things before I could get going with this system
1.40±0.115 1.36±0.128 1.40±0.153 1.69±0.158
SUS Score
90.50±6.50 88.20±9.80 88.40±11.41 84.71±11.41
SignalBIT-AWeb-basedPlatformforReal-timeBiosignalVisualizationandRecording
161

ACKNOWLEDGEMENTS
This work was partially funded by Fundac¸˜ao para
a Ciˆencia e Tecnologia (FCT) under the grants
PTDC/EEI-SII/2312/2012, SFRH/BD/65248/2009
and SFRH/PROTEC/49512/2009, whose support
the authors gratefully acknowledge. The authors
would also like to thank the Institute for Systems and
Technologies of Information, Control and Communi-
cation (INSTICC), the graphic designer Andr´e Lista,
Prof. Pedro Oliveira, and the Instituto Superior de
Educac¸˜ao e Ciˆencias (ISEC), for their support to this
work.
REFERENCES
Adidas (2012). miCoach Heart Rate Monitor.
http://www.adidas.com/us/micoach/ui/Product/#!/heartrate
(last accessed on 29/03/2013).
AliveCor (2012). iPhone ECG Accessory.
http://www.alivecor.com (last accessed on
29/03/2013).
Alves, A. P., Silva, H., Lourenc¸o, A., and Fred, A. (2013).
BITalino: A Biosignal Acquisition System based on
Arduino. In Proceeding of the 6th Conference on
Biomedical Electronics and Devices (BIODEVICES).
Bangor, A., Kortum, P., and Miller, J. (2008). An Empirical
Evaluation of the System Usability Scale. Int. J. Hum.
Comput. Interaction, pages 574–594.
Biopac (2013). Biopac Systems, Inc.
http://www.biopac.com/ (last accessed on
25/03/2013).
Brooke, J. (1996). SUS: A Quick and Dirty Usability Scale.
In Jordan, P. W., Thomas, B., Weerdmeester, B. A.,
and McClelland, I. L., editors, Usability Evaluation in
Industry. Taylor & Francis., London.
Helal, A., Mokhtari, M., and Abdulrazak, B. (2008). The
Engineering Handbook of Smart Technology for Ag-
ing, Disability and Independence. Wiley-Interscience,
1 edition.
Lourenc¸o, A., Silva, H. P., Carreiras, C., Alves, A. P., and
Fred, A. L. (2013). A web-based platform for biosig-
nal visualization and annotation. Multimedia Tools
and Applications, pages 1–28.
McFarland, D. S. (2011). JavaScript & jQuery: The Miss-
ing Manual. Pogue Press, second edition edition.
Petta, P., Pelachaud, C., and Cowie, R., editors (2011).
Emotion-Oriented Systems: The Humaine Handbook.
Springer.
Schwartz, M. and Andrasik, F. (2005). Biofeedback: A
Practitioner’s Guide. The Guilford Press, 3rd edition.
Shimmer (2012). Shimmer: Discov-
ery in Motion. http://www.shimmer-
research.com/p/products/software/multi-shimmer-
sync (last accessed on 25/03/2013).
Silva, M., Guerreiro, T., Gonc¸alves, D., and Silva, H.
(2012). A Web-Based Application to Address Individ-
ual Interests of Children with Autism Spectrum Dis-
orders. Procedia Computer Science.
Wang, V., Salim, F., and Moskovits, P. (2012). The Defini-
tive Guide to HTML5 WebSocket. Apressus Series.
Apress.
SIGMAP2013-InternationalConferenceonSignalProcessingandMultimediaApplications
162
