
Fuzzy Approaches Improve Predictions of Energy Performance
of Buildings
Àngela Nebot and Francisco Mugica
Soft Computing Research Group, Technical University of Catalonia, Jordi Girona Salgado 1-3, Barcelona, Spain
Keywords: Energy Performance, Heating and Cooling Load, Fuzzy Inductive Reasoning (FIR), Adaptive Neuro-Fuzzy
Inference System (ANFIS).
Abstract: The energy consumption in Europe is, to a considerable extent, due to heating and cooling used for domestic
purposes. This energy is produced mostly by burning fossil fuels with a high negative environmental
impact. The characteristics of a building are an important factor to determine the necessities of heating and
cooling loads. Therefore, the study of the relevant characteristics of the buildings with respect to the heating
and cooling needed to maintain comfortable indoor air conditions, could be very useful in order to design
and construct energy efficient buildings. In previous studies, statistical machine learning approaches have
been used to predict heating and cooling loads from eight variables describing the main characteristics of
residential buildings which obtained good results. In this research, we present two fuzzy modelling
approaches that study the same problem from a different perspective. The prediction results obtained while
using fuzzy approaches outperform the ones described in the previous studies. Moreover, the feature
selection process of one of the fuzzy methodologies provide interesting insights to the principal building
variables causally related to heating and cooling loads.
1 INTRODUCTION
In recent years there has been a substantial increase
of research in the area of energy performance of
buildings. The aim is to design and construct more
energy-efficient buildings with the goal of reducing
their energy consumption and CO2 emissions.
During the last four years the European Commission
boosted the research in this area with a programme
framed in the Seventh Framework Programme for
Research (FP7) (European Commission, 2013).
Fuzzy logic-based methods have been applied
sparingly to the energy performance estimation of
buildings; however, there is a considerable amount
of research that uses fuzzy logic instead of classical
controllers to develop advanced control systems
with several building energy goals. The overall
objective is the management of indoor environment
including user preferences. The development of
fuzzy controllers to control thermal comfort, visual
comfort, and natural ventilation, with the combined
control of these subsystems has led to remarkable
results (Dounis and Caraiscos, 2009); (Kurian et al.,
2005). There are also studies that focus on more
specific control purposes such is, for example, the
control of electrochromic windows. In this research
the authors develop an algorithm to control the solar
transmittance of the electrochromic glazing unit,
both in terms of energy and the quality of the indoor
environment (Assimakopoulos et al., 2004).
Another interesting area within the analysis of
energy in buildings where fuzzy logic has been
applied is in multiple criteria decision-making
(FMCDM). We can find works in the literature that
use these techniques with very different goals. For
instance, in (Lee, 2010) a FMCDM is developed to
evaluate and rank the energy performance of office
buildings because it is relevant for energy agencies
and authorities. In (Hsieh et al., 2004) this approach
is used for selecting planning and design alternatives
in public office building. However, FMCDM has
been used mainly in energy planning, in application
areas such are renewable energy, energy resource
allocation, building energy management,
transportation energy management or electric utility
(Pohekar and Ramachandran, 2004).
Although, as has been already mentioned, fuzzy
logic has been used scarcely for the prediction of
energy performance of buildings, machine learning
strategies have been already used to deal with this
504
Nebot À. and Mugica F..
Fuzzy Approaches Improve Predictions of Energy Performance of Buildings.
DOI: 10.5220/0004621405040511
In Proceedings of the 3rd International Conference on Simulation and Modeling Methodologies, Technologies and Applications (MSCCEC-2013), pages
504-511
ISBN: 978-989-8565-69-3
Copyright
c
2013 SCITEPRESS (Science and Technology Publications, Lda.)

issue (Tsanas and Xifara, 2012). In the research
presented in this paper the work of Tsanas and
Xifara is taken as a basis to study the performance of
fuzzy approaches for the problem at hand. The
approaches reported in (Tsana and Xifara, 2012), i.e.
classical linear regression approach called Iteratively
Reweighted Least Squares (IRLS) and nonlinear
non-parametric method called Random Forests (RF),
are compared with the two fuzzy approaches
presented in this work, the Fuzzy Inductive
Reasoning (FIR) and the Adaptive Neuro-fuzzy
Inference System (ANFIS) from the prediction
capability perspective and as feature selection tools.
The next section provides an insight into these
two fuzzy approaches. Section 3 presents the data
used for this study and describes the fuzzy models
construction. Section 4 presents and discusses the
results obtained. Finally, section 5 presents the main
conclusions of this work.
2 METHODS
Both, the fuzzy inductive reasoning (FIR) and the
adaptive neuro-fuzzy inference system (ANFIS) are
hybrid methodologies that combine mainly soft
computing approaches. FIR combines fuzzy logic
with machine learning techniques and ANFIS
combines fuzzy logic with neural networks.
2.1 Fuzzy Inductive Reasoning (FIR)
The conceptualization of the FIR methodology
arises of the General System Problem Solving
(GSPS) approach proposed by Klir (Klir and Elias,
2002). This methodology of modeling and
simulation is able to obtain good qualitative relations
between the variables that compose the system and
to infer future behavior of that system. It has the
ability to describe systems that cannot easily be
described by classical mathematics or statistics, i.e.
systems for which the underlying physical laws are
not well understood.
FIR offers a model-based approach to predicting
either univariate or multi-variate time series (Nebot
et al., 2003); (Carvajal and Nebot, 1998). A FIR
model is a qualitative, non-parametric, shallow
model based on fuzzy logic.
Visual-FIR is a tool based on the Fuzzy
Inductive Reasoning (FIR) methodology (runs under
Matlab environment), that offers a new perspective
to the modeling and simulation of complex systems.
Visual-FIR designs process blocks that allow the
treatment of the model identification and prediction
phases of FIR methodology in a compact, efficient
and user friendly manner (Escobet et al., 2008).
FIR methodology has two main processes: a
feature selection process, that allow to develop a
model, and the prediction or simulation process, that
uses the model obtained to infer the future behaviour
of the system.
A FIR model consists of its structure (relevant
variables) and a set of input/output relations (history
behavior) that are defined as if-then rules.
Feature selection in FIR is based on the
maximization of the models' forecasting power
quantified by a Shannon entropy-based quality
measure. The Shannon entropy measure is used to
determine the uncertainty associated with
forecasting a particular output state given any legal
input state. The overall entropy of the FIR model
structure studied, H
s,
is computed as described in
equation 1.
()
s
i
i
HpiH
,
(1)
where p(i) is the probability of that input state to
occur and H
i
is the Shannon entropy relative to the
i
th
input state. A normalized overall entropy H
n
is
defined in equation 2.
max
1
s
n
H
H
H
(2)
H
n
is obviously a real-valued number in the range
between 0.0 and 1.0, where higher values indicate an
improved forecasting power. The model structure
with highest H
n
value generates forecasts with the
smallest amount of uncertainty.
Once the most relevant variables are identified,
they are used to derive the set of input/output
relations from the training data set, defined as a set
of if-then rules. This set of rules contains the
behaviour of the system. Using the five-nearest-
neighbours (5NN) fuzzy inference algorithm the five
rules with the smallest distance measure are selected
and a distance-weighted average of their fuzzy
membership functions is computed and used to
forecast the fuzzy membership function of the
current state, as described in equation 3.
5
1
new j j
out rel out
j
M
emb w Memb
(3)
The weights
j
rel
w
are based on the distances and are
numbers between 0.0 and 1.0. Their sum is always
equal to 1.0. It is therefore possible to interpret the
relative weights as percentages.
FuzzyApproachesImprovePredictionsofEnergyPerformanceofBuildings
505

Figure 1: Example of how a Sugeno model works (evaluation of two fuzzy rules with two input variables or antecedents,
i.e. A and B).
For a more detailed explanation of the fuzzy
inductive reasoning methodology refer to (Escobet
et al., 2008).
2.2 Adaptive Neuro-Fuzzy Inference
System (ANFIS)
The Adaptive Neuro-Fuzzy Inference System
(ANFIS), developed by Jang, is one of the most
popular hybrid neuro-fuzzy systems for function
approximation (Nauck et al., 1997). ANFIS
represents a Sugeno-type neuro-fuzzy system. A
neuro-fuzzy system is a fuzzy system that uses
learning methods derived from neural networks to
find its own parameters. It is relevant that the
learning process is not knowledge-based but data-
driven.
The main characteristic of the Sugeno inference
system is that the consequent, or output of the fuzzy
rules, is not a fuzzy variable but a function, as
shown in equation 4.
R1: If A is A
1
and B is B
1
then z = p
1*
a + q
1*
b + r
1
R2: If A is A
2
and B is B
2
then z = p
2*
a + q
2*
b + r
2
(4)
Figure 1 describes graphically the inference process
of a Sugeno model composed by the two rules
described in equation 4 works.
The first step of the Sugeno inference is to
combine a given input tuple (in the example of
figure 1: a=3 and b=2) with the rule’s antecedents by
determining the degree to which each input belongs
to the corresponding fuzzy set (left panel of Fig. 1).
The min operator is then used to obtain the weight of
each rule, w
i
, which are used in the final output
computation,
z (right panel of Fig. 1). Notice that
the Sugeno inference has two differentiated set of
parameters. The first set corresponds to the
membership functions parameters of the input
variables. The second set corresponds to the
parameters associated to the output function of each
rule, i.e. p
i
, q
i
and
r
i
.
ANFIS is the responsible of adjusting in an
automatic way these two set of parameters by means
of two optimization algorithms, i.e. back-
propagation (gradient descendent) and least square
estimation. Back-propagation is used to learn the
parameters of the antecedents (membership
functions) and the least square estimation is used to
determine the coefficients of the linear combinations
in the rules’ consequents. ANFIS is a function of the
Fuzzy toolbox that runs under the Matlab
environment. For a more detailed explanation of the
ANFIS methodology refer to (Nauck et al., 1997).
3 DATA
The data used for this study stems from the UCI
machine learning repository (UCI, 2013) and is
called energy efficiency data set. The data was
created by (Tsanas and Xifara, 2012) in the
following way. They generated 768 simulated
buildings using Ecotet. Ecotet is a sustainable
building design software tool that allows the design
of buildings performing a whole building energy,
thermal performance and water usage analysis,
among other functionalities (Ecotet, 2013).
All the buildings have a volume of 771.75 m
3
,
but different surface areas and dimensions. All of
them are created with the same materials, that were
selected taking into account the newest and most
common materials in the building construction
industry and the lowest heat loss in each building
element, i.e. wall, floor or roof (U-value).
The simulation assumes that the buildings are
located in Athens, Greece, and are residential
11 1 1
zpaqbr
22 2 2
zpaqbr
w
2
w
1
B
2
A
2
B
a=3
B
1
A
1
b=2
min
11 2 2
12
wz wz
z
ww
A
SIMULTECH2013-3rdInternationalConferenceonSimulationandModelingMethodologies,Technologiesand
Applications
506

buildings.
They used three types of glazing areas, expressed
as percentages of the floor area: 10%, 25%, and
40%. Furthermore, five different distribution
scenarios for each glazing area were simulated: 1)
uniform: with 25% glazing on each side, 2) north:
55% on the north side and15% on each of the other
sides, 3) east: 55% on the east side and 15% on each
of the other sides, 4) south: 55% on the south side
and 15% on each of the other sides, and 5) west:
55% on the west side and 15% on each of the other
sides. In addition, they obtained samples with no
glazing areas. Finally, all shapes were rotated to face
the four cardinal points.
Each one of the 768 simulated buildings can be
characterized by eight building parameters which
are: Relative Compactness (RC), Surface Area (SA),
Wall Area (WA), Roof Area (RA), Overall Height
(OH), Orientation (O), Glazing Area (GA) and
Glazing Area Distribution (GAD). These parameters
correspond to the input variables. Also, they
recorded the Heating Load (HL) and the Cooling
Load (CL), which correspond to the output
variables. The authors of the data claim that the data
generated represent actual real data with high
probability, enabling energy comparisons of
buildings (Tsanas and Xifara, 2012).
In the work of Tsanas and Xifara basic statistical
analysis of the data were performed and show that
linear techniques are not appropriate for the
available data in this application due to the fact that
the scatter and density plots do not follow a
Gaussian distribution.
3.1 Model Evaluation
In order to test the generalization performance of
FIR and ANFIS fuzzy models we use cross
validation, in this case 10-fold cross validation (CV).
The model parameters are derived using the training
subset and errors are computed using the testing
subset. For statistical confidence, the training and
testing processes are repeated 10 times with the
whole dataset randomly permuted in each run prior
to splitting in training and testing subsets.
Two error measures were used to evaluate the
performance of each of the models. These are: the
mean square error (MSE) and the mean absolute
error (MAE), described in equations 5 and 6,
respectively. These are the same error measures used
in (Tsanas and Xifara, 2012), in order to compare
accurately the methodologies presented in that paper
with the fuzzy methodologies presented in this work.
1
|
|
(5)
1
|
|
(6)
where ŷ(t) is the predicted output, y(t) the system
output and N the number of samples.
3.2 Fuzzy Models Development
In this section the development of ANFIS and FIR
models is described. As mentioned before, in this
application we have two output variables, i.e.
heating load and cooling load, and we want to study
if it is possible to estimate each output by using the
eight input variables that represent different building
parameters. Both, ANFIS and FIR methodologies
allow developing models that have a single output,
i.e. SISO or MISO models. Therefore, for each
methodology two sets of models are obtained, one
for each possible output. The input variables for both
sets of models are the eight variables previously
described. We talk about sets of models because for
each methodology and each output we obtain a
model for each of the 10 folds, and this is repeated
10 times. Therefore, 100 models are derived and
validated for each of the two methodologies and
outputs studied.
Both fuzzy approaches need to discretized the
quantitative data into qualitative data. To this end, it
becomes necessary to define, at least, two
parameters, the number of classes (also called
granularity) chosen for each input variable (and also
for the output variable in the case of FIR models),
and the shape of the membership functions of the
input variables (and also for the output variable in
the case of FIR models).
In this research we have decided to discretize the
input variables RC, SA, WA and GAD into three
classes and RA, OH, O and GA into only two
classes. The output variable is discretized into three
classes in the case of the FIR models. Remember
that ANFIS does not have fuzzy consequents, i.e. the
rules’ output is a function (see Figure 1). A
triangular shape has been used to discretize all the
variables.
These discretization parameters have been
chosen based on the analysis of the data. The
variable OH can take only two possible values, and
therefore it is represented into two classes. Variables
RA, O and GA can take four different values, and
some of these values appear only few times. A
FuzzyApproachesImprovePredictionsofEnergyPerformanceofBuildings
507

discretization with more than two classes does not
enhance the model prediction power and, instead, a
higher number of classes can lead to a curse of
dimensionality problem. Therefore, it was found that
two classes are enough for these variables to obtain
good models. The variables discretized into 3 classes
have a uniform distribution in their dimensionality
space, and, therefore, an odd number of classes seem
more reasonable. Three is the lowest number of
classes that give good results.
3.2.1 ANFIS Models
In order to obtain ANFIS models it is necessary to
define two sets of parameters: the ones related to the
discretization process of the input variables, which
have been explained before, and the parameters
related to the training process. The parameters
needed to perform the training process are: the type
of the output function (i.e. constant or linear), the
optimization method to train the fuzzy inference
system and the number of training epochs.
In this research we use a constant output
function, a hybrid optimization method and 50
epochs. A constant output has been chosen instead
of a linear one because the prediction power of the
resulting models were equivalent and the training
process is much more time consuming when the
linear function is used, due to the additional number
of parameters involved that need to be estimated in
the optimization process.
ANFIS uses the eight input variables to predict
each output, i.e. heating and cooling loads, and does
not perform any kind of feature selection.
3.2.2 FIR Models
As in the case of ANFIS, the first step in order to
obtain the FIR models is to discretize the data, i.e. to
convert quantitative values into fuzzy data. To this
end, it is necessary to specify the two parameters
described before, i.e. granularity and shape of the
membership functions, but also a parameter that
refers to the discretization algorithm. Depending on
the algorithm chosen the distribution of the
membership functions in the variable space may
vary and this has a direct impact to the reasoning
process, and, therefore, to the model predictions.
Contrarily to FIR, ANFIS does not have this
discretization parameter. ANFIS distributes
uniformly all the membership functions that describe
a specific variable. Figure 2 shows an example of
uniform (upper plot) and non-uniform (lower plot)
distribution of the membership functions of a
variable.
Figure 2: Example of uniform (upper plot) and non-
uniform (lower plot) membership functions distribution of
four classes that represent a given variable.
In this research, FIR uses the equal with partition
(EWP) algorithm for the discretization of the RA
and OH variables, and the equal frequency partition
(EFP) algorithm for the discretization of the rest of
the variables. The EWP algorithm is the one that
performs a uniform distribution of the membership
functions. The EFP algorithm distributes the
membership functions of a variable in such a way
that all the classes contain the same number of data
points. Visual-FIR allows the modeller to choose
between 15 discretization algorithms, some of them
belonging to the hierarchical family and others to the
fuzzy family (Escobet et al., 2008).
Once the data has been discretized, FIR
methodology performs a feature selection process
where the more relevant causal relations between the
input variables and the output variable are identified.
To this end, we used the model structure
identification process of the fuzzy inductive
reasoning methodology that performs a feature
selection based on the entropy reduction measure as
described in section 2.
FIR founds that for both outputs, HL and CL, the
features that have higher relevant causal relation are
Relative Compactness (RC) and Glazing Area (GA).
The use of the other variables does not improve the
predictive power of FIR models. Therefore, these
two variables represent the minimum subset of
variables needed to accurately estimate the heating
load and cooling load.
Variable
Variable
1
0
1
0
SIMULTECH2013-3rdInternationalConferenceonSimulationandModelingMethodologies,Technologiesand
Applications
508

4 RESULTS AND DISCUSSION
The MSE and MAE obtained by ANFIS and FIR
models, for both HL and CL output variables are
summarized in tables 1 and 2, respectively. In both
tables, the prediction results reported in (Tsanas and
Xifara, 2012) for the Iteratively Reweighted Least
Squares (IRLS) and Random Forest (RF) algorithms
are also included in order to study their performance
when compared with fuzzy approaches. IRLS is a
linear regression algorithm that adjusts weights in
the coefficients of the classical regression scheme in
order to diminish the effect of the outliers when
obtaining the fitting curve (Bishop, 2007). RF is a
non-linear method which was first put forward by
Breiman (2001). RF is a set of classification and
regression trees, where the training sample set for a
base classifier is constructed by using the Bagging
algorithm (Breiman, 1996). When building a base
classifier, inner nodes are spitted with a random
candidate attribute set. The final classification rule
or regression function is the simple majority voting
method or the simple average method.
In tables 1 and 2 the errors of ANFIS and FIR
models over the 10 cross validation realisations were
averaged. Tsanas and Xifara performed 100 cross
validations for both, IRLS and RF models. Tables 1
and 2 show the average errors of these 100 CV. We
found out that the models errors for each realisation
were very similar and, therefore, we think that 10
CV are enough to ensure a fair comparison.
Table 1: Mean square prediction errors obtained by the
methodologies: IRLS, RF, ANFIS and FIR, for the HL
models and the CL models. The results are given in the
form of mean ± standard deviation.
MSE IRLS RF ANFIS FIR
HL
9.87±2.41 1.03±0.54 0.49±0.1 0.24±0.07
CL
11.46±3.63 6.59±1.56 3.04±0.62 2.96±0.73
Table 2: Mean absolute prediction errors obtained by the
methodologies: IRLS, RF, ANFIS and FIR, for the HL
models and the CL models. The results are given in the
form of mean ± standard deviation.
MAE IRLS RF ANFIS FIR
HL
2.14±0.24 0.51±0.11 0.52±0.05 0.35±0.04
CL
2.21±0.28 1.42±0.25 1.06±0.11 1.09±0.16
From tables 1 and 2 it can be seen that the linear
regression approach, IRLS, has the lowest
performance. All the non-linear approaches have
good results and FIR is the one that performs much
better for both outputs. It is interesting to notice that
FIR mean square errors are a 75% and 50% lower
than the errors obtained by the RF, for HL and CL
models, respectively. The ANFIS errors are also
significantly lower (50%) than the MSE of the RF
models. Therefore, both fuzzy approaches
outperform the RF in the application at hand. It is
relevant to mention that the standard deviations
obtained by ANFIS and FIR models are really much
lower than the ones obtained by RF models. A low
standard deviation indicates that all the predictions
errors (100 as described in the previous section) tend
to be very close to the mean.
An important issue is that FIR, which is the
methodology that has a better performance, is the
only one that performs a feature selection process.
FIR finds that two of the eight input variables, i.e.
relative compactness (RC) and glazing area (GA),
are highly causally related to the outputs, and
therefore, FIR models only use these two building
characteristics to predict the heating and cooling
loads. This is a very interesting result because, in the
one hand, is consistent with Tsanas and Xifara
outcomes that claim that the GA is the most
important predictor for both HL and CL.
On the other hand, it allows concluding that the
rest of the six variables, i.e. surface area (SA), wall
area (WA), roof area (RA), overall height (OH),
orientation (O), and glazing area distribution (GAD),
are redundant or irrelevant. Again, this is consistent
with the previous work that infer that variables RC,
SA, WA, RA and OH appear reasonably strongly
associated with the output variables, and at the same
time founds that some input variables are highly
correlated. Based on the FIR feature selection
process, it becomes reasonably to think that the
relative compactness variable, RC, includes the
information of other relevant variables involved in
the study, as SA or RA. In fact, this is true because
there is an analytic formula linking the RC the SA
and the volume (Tsanas and Xifara, 2012). The WA
variable is clearly directly related to the GA, so it is
redundant. Therefore, the five variables that appear
reasonably strongly associated with the output
variables contain redundant information if SA and
GA are already selected.
Figure 3 shows real versus predicted ANFIS and
FIR results for HL and CL models. In both cases we
present the fold that gives larger MSE, in order to
show that even for the worse prediction results the
difference with the real data is almost
indistinguishable, especially in the case of the
heating load model.
FuzzyApproachesImprovePredictionsofEnergyPerformanceofBuildings
509
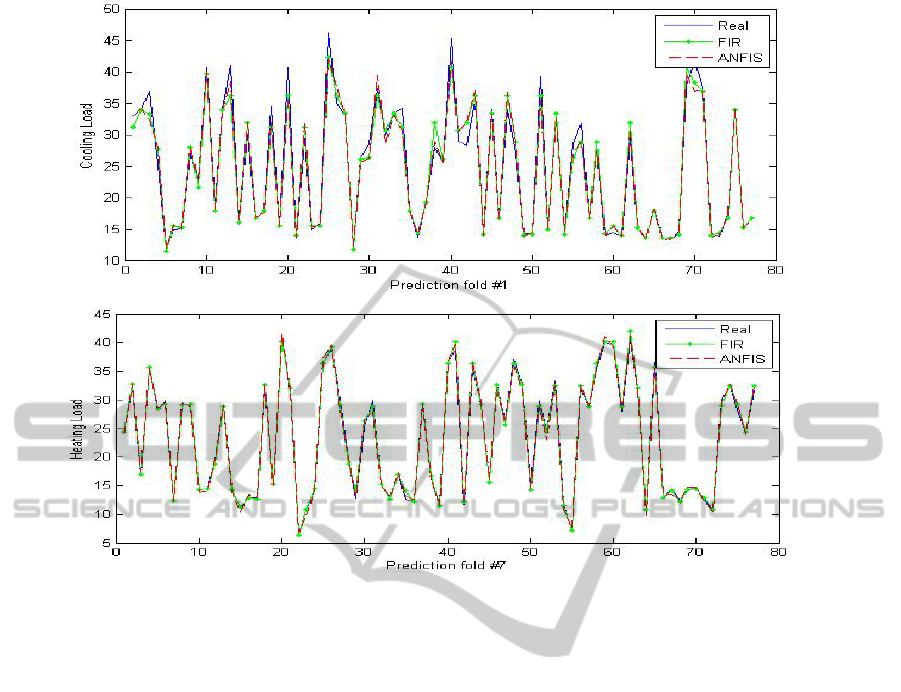
Figure 3: Real vs. ANFIS and FIR prediction results for the Cooling Load (upper plot) and Heating Load (lower plot)
models. The results of the Cooling Load correspond to fold #1 in one of the 10 iterations. The MAE and MSE obtained by
the ANFIS model in this fold are 1.08 and 2.91, respectively. The MAE and MSE obtained by the FIR model in this fold are
1.16 and 3.03, respectively. The results of the Heating Load correspond to fold #7 in one of the 10 iterations. The MAE and
MSE obtained by the ANFIS model in this fold are 0.54 and 0.46, respectively. The MAE and MSE obtained by the FIR
model in this fold are 0.42 and 0.38, respectively.
5 CONCLUSIONS
The main goal of this work is to study the feasibility
of fuzzy approaches to estimate the energy
performance of buildings. The characteristics of a
building are an important factor to determine the
necessities of heating and cooling loads. Therefore,
the study of the relevant characteristics of the
buildings with respect to the heating and cooling
needed to maintain comfortable indoor air
conditions, could be very useful in order to design
and construct energy efficient buildings. This work
follows a previous study (Tsanas and Xifara, 2012),
that creates a set of 768 buildings with different
characteristics by means of the Ecotet software, with
the goal of predict the heating and cooling load of
buildings taking into account eight variables that
represent different building characteristics, i.e.
relative compactness, surface area, wall area, roof
area, overall height, orientation, glazing area and
glazing area distribution.
Two fuzzy methodologies have been studied, the
fuzzy inductive reasoning (FIR) and the adaptive
neuro-fuzzy inference system (ANFIS). In order to
test the generalization performance of FIR and
ANFIS fuzzy models we use 10-fold cross
validation. The training and testing processes are
repeated 10 times with the whole dataset randomly
permuted in each run prior to splitting in training
and testing subsets. Therefore, 100 models are
derived and validated for each of the two
methodologies and outputs studied.
The results obtained by ANFIS and FIR
methodologies are compared with the ones presented
in the work of Tsanas and Xifara, where the linear
regression Iteratively Reweighted Least Squares
(IRLS) algorithm and the non-linear Random Forest
(RF) algorithm are used to predict heating and
cooling loads.
From the results it can be concluded that the non-
linear approaches (RF, ANFIS and FIR) perform
much better than the IRLS. All the non-linear
SIMULTECH2013-3rdInternationalConferenceonSimulationandModelingMethodologies,Technologiesand
Applications
510

approaches have good results and FIR is the one that
performs much better for both models, i.e. heating
and cooling loads. Both fuzzy approaches
outperform the RF in the application at hand.
Moreover, the standard deviations obtained by
ANFIS and FIR models are really much lower than
the ones obtained by RF models.
An interesting result is that the feature selection
process of FIR methodology finds that only two
input variables, i.e. relative compactness and glazing
area, contain the relevant information needed to
predict accurately the heating and cooling loads.
The results are very encouraging and we think
that these fuzzy methodologies can be good
alternatives to deal with different energy analysis
problems in the context of the smart grid.
REFERENCES
Assimakopoulos, M. N., Tsangrassoulis, A., Guarracino,
G., Santamouris, M., 2004. Integrated energetic
approach for a controlable electrochromic device.
Energy and Buildings, 36(5), 415-422.
Bishop, C. M., 2007. Pattern recognition and machine
learning, springer.
Breiman, L., Random Forests, Mach. Learn., vol. 45(1),
p.p. 5-32, 2001
Breiman, L., Bagging predictors, Machine Learning, vol.
24 (2), p.p. 123140, 1996
Carvajal, R., Nebot, A., 1998. Growth Model for White
Shrimp in Semi-intensive Farming using Inductive
Reasoning Methodology. Computers and Electronics
in Agriculture 19, 187-210.
Dounis, A. I., Caraiscos, C., 2009. Advanced control
systems engineering for energy and comfort
management in a building environment—A review.
Renewable and Sustainable Energy Reviews, 13(6–7),
1246-1261.
Ecotet, 2013. http://usa.autodesk.com/ecotect-analysis/
Escobet, A., Nebot., A., Cellier, F. E., 2008. Visual-FIR:
A tool for model identification and prediction of
dynamical complex systems. Simulation Modelling
Practice and Theory 16, 76-92.
European Commission, 2013: http://ec.europa.eu/research/
industrial_technologies/energy-efficient-buildings_en.
html
Hsieh, T. Y., Lu, S. T., Tzeng, G. H., 2004. Fuzzy MCDM
approach for planning and design tenders selection in
public office buildings, International Journal of
Project Management, 22(7), 573-584.
Klir, G., Elias, D., 2002. Architecture of Systems Problem
Solving, Plenum Press. New York, 2
nd
edition.
Kurian, C. P., Kuriachan, S., Bhat, J., Aithal, R. S., 2005.
An adaptive neuro-fuzzy model for the prediction and
control of light in integrated lighting schemes.
Lighting Research and Technology, 37(4), 343–52.
Lee, W. S., 2010. Evaluating and ranking energy
performance of office buildings using fuzzy measure
and fuzzy integral. Energy Conversion and
Management, 51(1), 197-203.
Nauck, D., Klawonn, F. and Kruse R. (1997). Neuro-
Fuzzy Systems, John Wiley & Sons.
Nebot, A., Mugica, F., Cellier, F., Vallverdú, M., 2003.
Modeling and Simulation of the Central Nervous
System Control with Generic Fuzzy Models.
Simulation 79(11), 648-669.
Pohekar, S. D., Ramachandran, M., 2004. Application of
multi-criteria decision making to sustainable energy
planning—A review. Renewable and Sustainable
Energy Reviews, 8(4), 365-381.
Tsanas, A., Xifara A., 2012. Accurate quantitative
estimation of energy performance of residential
buildings using statistical machine learning tools.
Energy and Buildings, 49, 560-567.
UCI, 2013. http://archive.ics.uci.edu/ml/
FuzzyApproachesImprovePredictionsofEnergyPerformanceofBuildings
511
