
An Epidemic Model of Nonmedical Opioid Use with Simulated Public
Health Interventions
Alexandra Nielsen, Wayne Wakeland and Teresa Schmidt
Systems Science Graduate Program,Portland State University, 10
th
Avenue, Portland, U.S.A.
Keywords: Substance Abuse, Systems Science, Dynamic Modelling, Public Health, Epidemic Modelling.
Abstract: We report development of a generalized epidemic model of initiation and nonmedical use of pharmaceutical
opioids in the US. The study relies on historical trend data as well as expert panel recommendations that
inform model parameters and structure. Derived from current policies, simulated public health interventions
are assessed using the model regarding their leverage for reducing initiation and nonmedical use.
Preliminary findings indicate that interventions which reduce the perceived attractiveness of opioids for
recreational use may significantly reduce initiation and nonmedical use most significantly, while supply
restriction effected through drug take back days and prescribing changes may have more modest effects. We
argue that system dynamics is an effective approach for evaluating potential interventions to this complex
system where the use of pharmaceutical opioids to treat pain is fraught with potentially undesirable distal
outcomes in the public sphere.
1 INTRODUCTION
A dramatic rise in the nonmedical use of
pharmaceutical opioids in the late 1990’s and early
2000’s created a substantial public health challenge
for the United States (Compton and Volkow, 2006).
Despite implementation of public health policies and
regulations (Food and Drug Administration, 2013),
the high level and increasing prevalence of negative
outcomes such as fatal and non-fatal overdoses
remains largely unabated (Centers for Disease
Control and Prevention, 2012). Resistance to policy
interventions likely stems from the complexity of the
pharmaceutical opioid system, including multiple
interactions between prescribers, pharmacists,
persons obtaining opioids for medical or nonmedical
use, opioid traffickers, and public health advocates.
The resulting chains of cause and effect often result
in feedback loops that diminish or even reverse well-
intentioned interventions.
This paper presents progress on a system
dynamics model of the complex system surrounding
the initiation and nonmedical use of pharmaceutical
opioids in the United States. In addition to
accounting for historical trends in the initiation and
escalation of nonmedical use and the acquisition of
pharmaceutical opioids via friends and relatives
(SAMHSA, 2012), the model may lead to increased
understanding of the underlying processes that give
rise to this public health problem, and allows for
experimentation and direct comparison of a variety
of potential policy interventions.
1.1 Background
The number of overdose deaths involving opioids
tripled between 1999 and 2006 in the US, rising to
14,800 in 2008 (Warner et al., 2011). As evidenced
by the high fraction of opioid overdose decedents
without prescriptions (Hall et al., 2008), nonmedical
use of pharmaceutical opioids plays a significant
role in the prevalence of overdose deaths. Estimates
from the National Survey on Drug Use and Health
(NSDUH) suggest that the rate of initiation of
nonmedical use of pain relievers increased almost
three-fold from 1995 to 2003 (SAMHSA, 2006) and
has continued at high rates. In 2010, an estimated
2.4 million individuals initiated nonmedical use of
pain relievers (SAMHSA, 2012) and 5.1 million
individuals used opioids nonmedically within the
month prior to the survey (SAMHSA, 2012).
Diversion of opioids from prescription holders is
a major source of supply for nonmedical use.
Around 70% of respondents to the 2010 NSDUH
indicated that they received opioids from friends or
relatives. And among those who received the drugs
556
Nielsen A., Wakeland W. and Schmidt T..
An Epidemic Model of Nonmedical Opioid Use with Simulated Public Health Interventions.
DOI: 10.5220/0004621905560564
In Proceedings of the 3rd International Conference on Simulation and Modeling Methodologies, Technologies and Applications (HA-2013), pages
556-564
ISBN: 978-989-8565-69-3
Copyright
c
2013 SCITEPRESS (Science and Technology Publications, Lda.)
for free, 80% identified their source as originally
acquiring the drugs from a single doctor. Leftover
opioid prescriptions are likely involved in much of
this diversion (Compton and Volkow, 2006). A
study of post-surgical patients discharged from a
urology group practice found that 42% of opioids
prescribed were unconsumed, and that 67% of
patients had surplus opioids. Further, 91% of
patients with leftover medicine kept it in their homes
rather than disposing of it (Bates et al., 2011). A
recent National Drug Take-Back event in Madison,
Wisconsin recovered approximately 100,000 opioid
dosage units in one day (Gilson, 2012). These
studies suggest that there is a large reservoir of
unused opioids stored in homes, and the high
fraction of individuals receiving drugs for free from
friends and family is likely to be strongly correlated
with the size of this reservoir.
2 A SYSTEM DYNAMICS
SIMULATION MODEL
The system dynamics modelling approach uses a set
of differential equations to simulate system
behaviour over time. This approach provides a
framework in which to capture the underlying
processes involved in a system and the feedback
loops that generate its behaviour. When applied to
public health problems, system dynamics modelling
allows for the simulation of intervention alternatives
in order to provide policymakers with a tool to
assess interventions for magnitude of impact and
potential for unintended consequences–information
that is not available from research focused on
individual aspects of a system (Sterman, 2006). In
the current research, a system dynamics model
complements and leverages results from existing
research, primarily historical trends available from
NSDUH (SAMHSA, 2012), and holds promise for
the simulation of intervention alternatives.
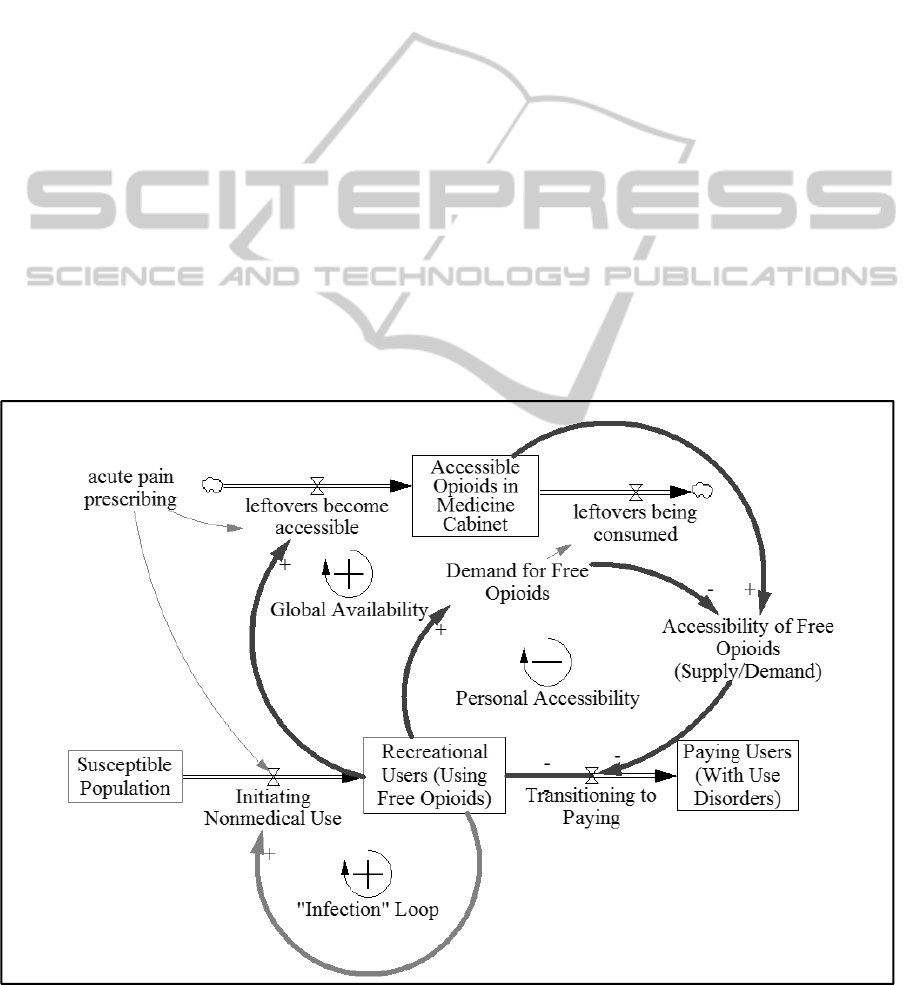
Figure 1 provides a high level picture of the
current model, which features one of the main
pathways by which people may initiate nonmedical
use of pharmaceutical opioids and transition from
casual usage based on free access to paying for
drugs through illicit channels. The ease of obtaining
drugs for free depends in the model on the amount
of leftover and undisposed pharmaceutical opioids
that are stored in homes (“medicine cabinets”). A
complete model and exact parameter values are
available upon request from the authors.
Figure 1: High level diagram of model structure.
AnEpidemicModelofNonmedicalOpioidUsewithSimulatedPublicHealthInterventions
557
2.1 Dynamics of the Opioid
Nonmedical Use Initiation System
The rate of prescribed opioids for acute pain
treatment is shown in the upper left corner of Figure
1, which serves as a key exogenous input to the
model. The model assumes that leftover
prescriptions from acute pain conditions are more
likely to constitute free sharing than prescriptions for
chronic pain diagnoses. The lower part of Figure 1
depicts the progression of people from initiating
nonmedical use to paying for drugs, which implies
the development of a use disorder (such as opioid
abuse or addiction) and other increasingly risky
behaviours.
Figure 2 details a recruitment mechanism
whereby casual users, who acquire opioids for free
from friends or family, influence their peers to
initiate nonmedical opioid use. This recruitment is
modelled as an infectious disease process using the
SIR (susceptible, infected, recovered) epidemic
modelling framework.
Figure 2: Simple zoomed in view of the infection loop.
In SIR disease models, an infected party will make
contact with susceptible individuals based on a
contact rate. The infectivity of the disease
determines whether contact results in infection of the
susceptible. When the number of infected
individuals becomes large, a susceptible is likely to
have multiple contacts with infected people and
infection becomes more likely. Thus the infected
population becomes larger causing infection to
spread more quickly, resulting in a disease epidemic.
While nonmedical pharmaceutical opioid use is
not an infection per se, the SIR epidemic model is a
compelling framework to explain initiation.
Susceptibles in this case are people who have never
used opioids nonmedically, and infected individuals
are those who use opioids recreationally. When
individuals in these two populations make contact,
the idea of using opioids recreationally can spread to
the susceptible who then initiates opioid use based
on the “infectivity” of the idea. The infection of a
susceptible by an infected individual could be active,
as when a peer is pressured or persuaded to use
drugs by other peers, or passive in which a
susceptible observes drug use behaviours in peers,
parents, or through the media and copies those
behaviours (Dasgupta et al., 2009); (Andrews et al.,
1997). When the number of nonmedical users
increases, the rate of initiation increases resulting in
a positive feedback loop, or vicious spiral.
In order to initiate opioid use, a susceptible must
have both the desire to use opioids and access to
them. In this model, the initiation rate is mediated by
the likelihood that a potential initiator knows at least
one prescription holder who is willing to share. This
likelihood is based on a binomial probability
calculation. The probability that at least one of a
susceptible’s family or friends has an opioid
prescription and is willing to share is determined by
the number of friends and by what fraction of the
total population meet these criteria (see Figure 3).
Figure 3: Binomial probability calculation of likelihood
parameters with 10, 20 and 40 friends. Initiation depends
on the fraction of the total population who are prescription
holders willing to share. Opening opioid supply depends
on the fraction of the total population who are casual
opioid users seeking free supply.
SIMULTECH2013-3rdInternationalConferenceonSimulationandModelingMethodologies,Technologiesand
Applications
558
When the number of friends is fairly large, the
likelihood that a susceptible knows someone who
will share opioids is high even when a relatively
small fraction of the total population has
prescriptions and will share them, as in the solid
plot. However, even when the number of friends is
small, the likelihood of knowing at least one person
who will share is still greater than this global
fraction. The probability curve is always bowed
outward. Therefore, it doesn’t matter if a susceptible
can get opioids from one, five or twenty-five
sources; if she knows at least one source, she has
access.
In the classic SIR disease model, people who
recover from infection do not spread the disease, nor
are they susceptible to reinfection. In this model
nonmedical users are organized into three groups,
recreational users with and without a use disorder
(heretofore shown as the aggregated recreational
user group), and people with use disorder who use
more than they can obtain for free and have to pay
for some of their drugs. Individuals in the third
group are assumed not to participate in the
recruitment process (Winkler et al. 2004). These
users may no longer be peers of susceptibles as they
become increasingly socially isolated, and instead of
sending positive messages about drug use behaviour
that susceptibles want to mimic, they may send
negative messages.
Figure 4 describes the relationship between the
free supply of opioids in medicine cabinets, and the
progression of users from casual (free) use, to
development of a use disorder, to paid use. The
outermost arrows represent the global dynamics of
opioid availability: Much leftover medicine is not
accessible because prescription holders may not
have any desire to use it nonmedically or know
anyone who does. However, as the population of
recreational users increases (the circled group in
Figure 4), the likelihood that individuals with
leftover medications know at least one person who
would use them also increases, again based on a
binomial probability calculation. A fraction of these
Figure 4: Impact of supply on user progression to paying for drugs.
AnEpidemicModelofNonmedicalOpioidUsewithSimulatedPublicHealthInterventions
559
prescription holders who know a person seeking free
opioids for nonmedical use will choose to share
them. Their leftover medicine then flows into the
available free opioid supply, also called the
“medicine cabinet.” Thus, increases in initiation lead
to increased accessibility of leftover prescription
opioids, which tends to increase the population of
casual users because fewer of them transition to paid
use to due loss of access to free opioids, constituting
a second positive feedback loop.
On the other hand, the inner arrows in Figure 4
represent local dynamics of opioid availability,
which operate differently than the global dynamics.
Repeated use of pharmaceutical opioids can lead to
the development of opioid use disorders (Fishbain et
al., 2008) and, with them, consumption levels that
cannot be sustained by free leftover medicines
prescribed to those in one’s personal network. When
the demand for opioids exceeds what these
individuals can access through their personal
contacts, they may begin purchasing opioids through
the black market. This advancement to paid use is
assumed to be associated with the development of an
opioid use disorder and with a higher risk of adverse
outcomes. Therefore, although an increase in the
number of casual users “loosens up” opioid supply
by increasing access to leftover prescription holders
at the global scale, it also results in the exhaustion of
sources of supply at the local scale. Because of these
local dynamics, an increase in the population of
casual users leads to decreases in accessibility, as
represented by a balancing (negative) feedback loop.
3 MODEL TESTING
This model is a proof of concept as empirical
support is still being sought for many model
parameters. Currently, most parameters have been
set to plausible values under the guidance of expert
panel members and calibrated to fit three time series
from the NSDUH for the years 1995-2005: total past
year nonmedical opioid users, total past year
initiates of opioid use, total past year opioid users
who meet the criteria for opioid abuse or addiction.
To build confidence in the model concept, model
outputs were tested for fit against 2006-2011 data.
Results of calibration and tests of fit are shown in
Figure 5. Degree of fit to 2006-2011 data was
calculated using mean absolute percent error
(MAPE), which is reported in figure captions (see
Sterman 2000 for a discussion of fitness tests for SD
models). Having passed tests of face validity with
expert panel members and behaviour reproduction
after calibration to reference data, the model was
deemed sufficiently plausible for exploratory policy
analysis.
a. Total past year nonmedical users. MAPE 3.76%.
b. Total past year initiates of nonmedical use. MAPE 6.14%.
c. Total past year users who meet the criteria for abuse or
addiction. Data prior to 2000 could not be obtained. MAPE
3.47%.
Figure 5: Model outputs (dashed) versus data (solid). Data
prior to 2006 used for calibration. 2006 onward used for
tests of fit and confidence building.
0
2
4
6
8
10
12
14
TotalNonmedicalUsers
Millions
0
500
1000
1500
2000
2500
3000
YearlyInitiates
Thousands
0
500
1000
1500
2000
2500
UserswithAbuseorAddition
Thousands
SIMULTECH2013-3rdInternationalConferenceonSimulationandModelingMethodologies,Technologiesand
Applications
560

4 PRELIMINARY MODEL
RESULTS
The current model increases understanding of the
dynamics associated with initiation and nonmedical
use of pharmaceutical opioids. Initial testing
suggests that the model replicates historical trends of
initiation and nonmedical use in the United States,
and, following more rigorous testing, the model will
be expanded to allow for the evaluation of several
specific policy interventions. While more testing of
the model is required to establish its credibility and
validity, preliminary logic for three initiation
reduction scenarios was developed to illustrate the
potential for evaluating policy impacting the
initiation and nonmedical use of opioids. The
baseline run begins in 1995 and runs until 2011, and
all scenarios begin arbitrarily in 2005 to demonstrate
what their relative impacts on nonmedical opioid use
might have been over the six-year period from 2005
to 2011. The scenarios presented here are
implemented as simple toggles or switches that
affect a single stock or parameter.
4.1 Prescription Drug Take-back
Initiative
The first scenario, a prescription drug take-back
initiative, simulates an expansion of the DEA’s
National Prescription Drug Take-Back Day program
(Drug Enforcement Administration, 2012) to collect
unneeded medications by asking individuals to bring
leftover prescriptions to a disposal location. Disposal
records from one Take-Back Day in Madison
Wisconsin suggest that as many as 100,000 opioid
dosage units can be collected in a major city on one
day (Gilson, 2012). In the current model, the
national take-back program is simulated as a
removal of one hundred million dosage units from
the “medicine cabinet” supply of available opioids
each year, starting in 2005. This amount is largely
speculative, but could be possible if all 50 states
facilitate Take-Back Days in at least two major cities
on 10 days per year, with the degree of success as
was witnessed in the recent Madison Take-Back
Day.
4.2 Reducing Initiation through
Drug-resistance Strategies
The second simulated scenario features a reduction
in the “infectivity” of opioids as a desirable
substance for nonmedical use. Some interventions,
such as “Keepin’ it R.E.A.L (Gosin et al., 2003),
may deter or delay initiation of nonmedical opioid
use, even if opioids are freely available and
recommended by peers, through teaching culturally
specific drug-resistance strategies. In the current
model, infectivity was reduced by 25% in 2005, so
that uninitiated individuals were 25% less likely to
initiate nonmedical use even if exposed to the idea.
4.3 Reducing Willingness to Share
Opioids
The third simulated scenario features a reduction in
Figure 4: Impact of interventions on number of recent and recreational users.
400
2400
4400
6400
8400
10400
12400
14400
Totalnonmedicalusers
Thousands
baseline
takebackdays
reducedsharing
reducedinfectivity
AnEpidemicModelofNonmedicalOpioidUsewithSimulatedPublicHealthInterventions
561

the fraction of individuals who are willing to share
their opioids with others for nonmedical use.
Individuals with leftover prescriptions might also be
educated about the risks involved in sharing
medications, or might be encouraged to adopt safety
features, such as locked medicine cabinets. This
intervention is currently modelled as a 25%
reduction in the number of individuals who are
willing to share their leftover opioid prescriptions
with others, starting in 2005.
4.4 Preliminary Scenario Comparison
Figure 6 shows a comparison of the three
interventions in terms of the impact on total number
of nonmedical users over time. These preliminary
results suggest that behavioral interventions either
on the supply side or the demand side may have a
greater impact on the number of users than supply
restriction.
Demand reduction achieved through reducing the
infectivity of the opioid use idea had the greatest
impact on the total number of nonmedical users.
This is because a 25% reduction in infectivity results
in a 25% reduction in the initiation flow. This
reduction is then amplified by positive feedback as a
lower initiation rate results in fewer recreational
users who subsequently infect fewer susceptibles.
Supply reduction achieved through reducing
prescription holders’ willingness to share acts on
two feedback processes, but has a smaller impact.
This is because a 25% reduction in willingness to
share does not result in a 25% reduction in opioid
access to initiates due to the nonlinear likelihood
parameter. A 25% reduction in the global fraction
of prescription holders willing to share medicines is
a leftward movement down the binomial probability
curve shown in Figure 3, and in the reduced sharing
scenario, translates to a 7% reduction in initiation
due to restricted opioid access to potential initiates.
This change is similarly amplified by positive
feedback as in the reduced infectivity scenario.
Reducing sharing also reduces the flow of medicines
into the available free supply, however, the impact
on the number of nonmedical users is minimal
because supply constriction primarily shifts
nonmedical users with use disorder from the free
user stock to the paying user stock without changing
the total number of users.
The prescription take back scenario has little
impact on the total number of nonmedical users for
the same reason.
5 DISCUSSION AND FUTURE
DIRECTIONS
The model presented in this paper is useful primarily
because it extends our understanding of the
dynamics of pharmaceutical opioid abuse problem in
the United States and comparatively demonstrates
policy leverage points for intervention The model
proposes that nonmedical opioid use spreads in
fashion similar to the spread of a disease. Some
communities in the United States are deeply
impacted by opioid abuse and others are not (Butler
et al., 2007); (Brownstein et al., 2010). Using the
disease metaphor we might suggest that in some
areas the opioid use idea had infected too few people
for the idea to spread, while in others the infected
population is large so the “disease” of opioid use has
become endemic. The disease metaphor can be
broadened to encompass possible additional
intervention strategies. Reducing infectivity (of the
idea of using opioids nonmecially) was shown to be
highly impactful. What might an “immunization”
intervention strategy look like? How would it
impact initiation? Could a policy be formulated that
acts like a quarantine? Because the infectious
disease metaphor has been formalized into a model
and calibrated against historical data, these types of
ideas may merit exploration.
The other two hypothetical interventions
appeared to be less effective in this model, but
further investigation seems warranted regarding
ways to reduce the free supply, whether it be drug
take back day programs, campaigns to reduce
prescription holders’ willingness to share, other
ideas not yet considered. While the vast majority of
nonmedical users use very little and do not develop
use disorders, a small fraction do, and smaller
fraction still buy opioids to support high levels of
use (SAMHSA, 2012). Even though this fraction is
small, it is included in this model because the high
price of pharmaceutical opioids for those who
cannot obtain them for free may be an important
factor in the recent rise in heroin use (SAMHSA,
2012). The street price of pharmaceutical opioids is
high compared to heroin, and qualitative studies
suggest that many opioid users switch to heroin due
to its lower cost (Levy, 2007); (Young and Havens,
2012). Modelling a progression of opioid use that
includes a transition to paying may provide a
jumping off point for an investigation of the recent
rise in heroin use.
SIMULTECH2013-3rdInternationalConferenceonSimulationandModelingMethodologies,Technologiesand
Applications
562

5.1 Limitations
This manuscript describes a work in progress, and
stronger empirical support is being sought for all
model parameters. Parameter validity tends to be the
primary limitation in this type of study (Wakeland et
al., 2010).
The scenarios presented in this preliminary
analysis are too simple for a rigorous comparison of
effectiveness. These scenarios compare the system
level impact of hypothetical interventions with
specific and stable proximal effects (such as a 25%
reduction in the infectivity of the idea of nonmedical
drug use), on the number of people who become
nonmedical users and on the number of people who
escalate their usage and manifest use disorders.
Framing scenarios in terms of their proximal effects
leaves several important questions unanswered: How
can these reductions be achieved? Are reductions of
the desired magnitude achievable, given constraints
such as limited budgets? How can we compare
interventions if some are easy but low impact, and
others are difficult but high impact? In order to
compare the effectiveness of interventions
themselves, model structures would need to be
developed that transform exogenous inputs, such as
dollars spent on drug resistance programs, into local
outcomes that impact model parameters or structure,
such as a two year delay in initiation. A more
rigorous treatment of intervention strategies is
necessary for this preliminary model to become a
useful policy evaluation instrument.
Additionally, the population represented in the
current model is derived from the NSDUH, which is
known to be limited in its representation of hidden
drug using communities such as the incarcerated,
members of the armed forces, and the homeless
(Crum, 2005). The current model presents only one
of several possible routes of initiation and does not
include initiation of nonmedical use through medical
exposure, or as a substitute for or complement to
other illicit drug use. Furthermore, the potential
impact of the availability of chronic pain medicine is
not considered, and may be an important factor.
5.2 Future Research
Future work will include additional efforts to locate
empirical support for model parameters and model
structure to develop the model beyond the proof of
concept stage. Expansion of the model logic for
policy interventions is also planned. A variety of
model testing techniques, including sensitivity
analysis and more rigorous comparisons to reference
behaviour, will help to strengthen the model’s
validity and credibility. In addition, model
development is underway for several other aspects
of the pharmaceutical opioid system, including the
dynamics of black market opioid purchasing and the
negative outcomes associated with nonmedical use,
including transition to heroin use and fatal
overdoses. Integration of the current model with
these other sectors will enable future simulations to
yield greater insights regarding the likely magnitude
of impact, and rigorous testing will increase
confidence in the model’s results.
6 CONCLUSIONS
Initiation and nonmedical use of pharmaceutical
opioids has seen a dramatic rise from 1995 to 2005,
and stabilization at a high level toward the end of the
last decade (SAMHSA, 2012). The current model
replicates historical trends in initiation and
nonmedical use, and in doing so provides increased
understanding of underlying processes and feedback
loops that may give rise to observed historical trends
in the pharmaceutical opioid system. Based on initial
simulation runs, the model also demonstrates the
potential for the system dynamics approach to be
useful in evaluating policy alternatives in terms of
their likely impact on negative consequences. While
further testing and elaboration of intervention logic
are needed, preliminary results suggest that the
public health interventions described here could
potentially have sufficient leverage to appreciably
decrease the number of individuals who use opioids
nonmedically.
ACKNOWLEDGEMENTS
Funding for this research was provided by NIDA
grant number 5R21DA031361-02. We appreciate
Dennis McCarty, PhD, Aaron Gilson, PhD, Lynn
Webster, MD, Todd Bodner, PhD, and Neal
Wallace, PhD who served as advisors and provided
valuable expert judgement and insights.
REFERENCES
Andrews, J. A., Hops, H. & Duncan, S. C., 1997.
Adolescent modeling of parent substance use: The
moderating effect of the relationship with the parent.
Journal of Family Psychology, 11(3), p.259.
AnEpidemicModelofNonmedicalOpioidUsewithSimulatedPublicHealthInterventions
563

Bates, C. et al., 2011. Overprescription of postoperative
narcotics: a look at postoperative pain medication
delivery, consumption and disposal in urological
practice. The Journal of urology, 185(2), pp.551–555.
Brownstein, J. S. et al., 2010. Geographic information
systems and pharmacoepidemiology: using spatial
cluster detection to monitor local patterns of
prescription opioid abuse. Pharmacoepidemiology and
drug safety, 19(6), pp.627–637.
Butler, S. F. et al., 2007. Internet surveillance: content
analysis and monitoring of product-specific internet
prescription opioid abuse-related postings. The
Clinical journal of pain, 23(7), pp.619–628.
Centers for Disease Control and Prevention, 2012.
Prescription Drug Abuse and Overdose: Public Health
Perspective. Available at: www.cdc.gov/primarycare/
materials/opoidabuse/docs/pda-phperspective-508.pdf
(Accessed May 3, 2013).
Compton, W. M. & Volkow, N. D., 2006. Major increases
in opioid analgesic abuse in the United States:
concerns and strategies. Drug and alcohol
dependence, 81(2), pp.103–108.
Crum, R. M., 2005. Epidemiology of opioid use, abuse,
and dependence. The treatment of opioid dependence,
p.43.
Dasgupta, N., Mandl, K. D. & Brownstein, J. S., 2009.
Breaking the news or fueling the epidemic? Temporal
association between news media report volume and
opioid-related mortality. PloS one, 4(11), p.e7758.
Drug Enforcement Administration, 2012. DEA’s Fifth
National Prescription Drug Take-Back Day Results in
Another Big Haul. News Release. Available at:
www.justice.gov/dea/docs/results_final.pd (Accessed
May 3, 2013).
Fishbain, D.A. et al., 2008. What Percentage of Chronic
Nonmalignant Pain Patients Exposed to Chronic
Opioid Analgesic Therapy Develop Abuse/Addiction
and/or Aberrant Drug-Related Behaviors? A
Structured Evidence-Based Review. Pain Medicine,
9(4), pp.444–459.
Food and Drug Administration, 2013. Extended-release
(ER) and long-acting (LA) opioid analgesics risk
evaluation and mitigation strategy (REMS), Available
at:
http://www.fda.gov/drugs/drugsafety/informationby-
drugclass/ucm163647.htm (Accessed May 3, 2013).
Gilson, A., 2012. Personal Communication: Findings of
Madison WI Drug Take-Back Day.
Gosin, M., Marsiglia, F. F. & Hecht, M. L., 2003.
Keepin’it REAL: a drug resistance curriculum tailored
to the strengths and needs of pre-adolescents of the
southwest. Journal of Drug Education, 33(2), pp.119–
142.
Hall, A. J. et al., 2008. Patterns of abuse among
unintentional pharmaceutical overdose fatalities.
JAMA: the journal of the American Medical
Association, 300(22), pp.2613–2620.
Levy, M. S., 2007. An exploratory study of OxyContin use
among individuals with substance use disorders.
Journal of psychoactive drugs, 39(3), pp.271–276.
Sterman, J., 2000. Business dynamics: systems thinking
and modeling for a complex world, Boston:
Irwin/McGraw-Hill.
Sterman, J. D., 2006. Learning from evidence in a
complex world. Journal Information, 96(3). Available
at: http://ajph.aphapublications.org/doi/abs/10.2105/
AJPH.2005.066043 (Accessed May 3, 2013).
SAMHSA - Substance Abuse and Mental Health Services
Administration, 2006. Results from the 2005 national
survey on drug use and health: national findings,
Rockville: Department of Health and Human Services.
Available at: http://oas.samhsa.gov/nsduh/2k5nsduh/
2k5results.pdf.
SAMHSA - Substance Abuse and Mental Health Services
Administration, 2012. Results from the 2011 National
Survey on Drug Use and Health: Summary of National
Findings. Available at: http://www.samhsa.gov/
data/2k11/WEB_SR_088/WEB_SR_088.pdf
(Accessed February 26, 2013).
Wakeland, W., Fitzgerald, J. & Haddox, J. D., 2010. Key
data gaps for understanding trends in prescription
opioid analgesic abuse and diversion among chronic
pain patients and nonmedical users. In College on
Problems of Drug Dependence, 72nd Annual
Scientific Meeting. Scottsdale, AZ.
Warner, M. et al., 2011. Drug Poisoning Deaths in the
United States, 1980-2008, Centers for Disease Control
and Prevention.
Winkler, D. et al., 2004. Estimating the relative efficiency
of various forms of prevention at different stages of a
drug epidemic. Socio-Economic Planning Sciences,
38(1), pp.43–56.
Young, A. M. & Havens, J. R., 2012. Transition from first
illicit drug use to first injection drug use among rural
Appalachian drug users: a cross-sectional comparison
and retrospective survival analysis. Addiction, 107(3),
pp.587–596.
SIMULTECH2013-3rdInternationalConferenceonSimulationandModelingMethodologies,Technologiesand
Applications
564
