
Using Andaptive Neuro Fuzzy Inference System to Build Models
with Uncertain Data for Rainfed Maize
Study Case in the State of Puebla (Mexico)
Anaïs Vermonden Thibodeau and Carlos Gay Garcia
Programa de Investigación en Cambio Climático,Universidad Nacional Autónoma de México,
Edificio de Programas Universitarios, Circuito Exterior, México City, CU, Mexico
Keywords: Fuzzy Logic, Agriculture, ANFIS, Uncertain Data, Mexico.
Abstract: Using the methodology of Adaptive Neuro Fuzzy Inference System (ANFIS) a model to determine the
relationship suitability index with the yields per hectare and the percentage of production area lost of rainfed
maize for the state of Puebla was built. The data used to build the model presented inconsistencies. The data
of the INEGI’s land use map presented more municipalities without rainfed maize agriculture than the
database of SAGARPA. Also the SAGARPA data, in terms of the percentage of production area lost, do not
show any distinctions between the loss due to climate, pests, or simply that the farmer did not plant the total
area that was declared, or had not harvested all the area declared. Even with data inconsistencies ANFIS
produced a coherent output reviewed by experts. The model shows that higher the percentage of production
area lost and high yields the higher the suitability index is. According to local studies this is due to the high
degradation of the soils.
1 INTRODUCTION
Adaptive Neuro Fuzzy Inference System, or simply
ANFIS, is a neural network based on Takagi-Sugeno
fuzzy inference system. By integrating both neural
networks and fuzzy logic principles, it has the
potential to capture the benefits of both in a single
framework. It has the ability to construct sets of
fuzzy if-then rules to approximate nonlinear
functions. ANFIS can also build appropriate
membership functions to generate the stipulated
input-output pairs to be used in the model. (Jang,
1993) The Neuro-adaptive learning techniques
provide a method for building a fuzzy model from
the information contained in a data set.
The fuzzy system enables a flexibility in the
variables, and representation of incomplete data, as
memebership to a fuzzy set is denoted by the degree
of membership to the set.
Since the ANFIS can deduce relations between
the inputs/outputs, ANFIS forms an input output
mapping based both on human knowledge (based on
fuzzy if then rules) and generated input/ouput data
pairs by using a hybrid algorithm that is the
combination of the gradient descent and least square
estimates. (Jang, 1993)
In this case study for the state of Puebla, ANFIS
was used to determine the relationship between the
natural suitability index of rainfed maize, yields and
the percentage of production area lost. The index of
suitability of rainfed maize was calculated with a
fuzzy model base don expert knowledge
(Vermonden, 2012) and on the previous work of
Monterroso. (Monterroso et al., 2011) The Index had
a resolution of 1 km by 1 km. The suitability index
is calculated using mean temperatures, mean
precipitation, depth of soil and slope. The data of
yield per hectare and the percentage of production
area lost is presented at municipality level from the
Secretaria de Agricultura, Ganaderia, Desarrollo
Social, Pesca y Alimentación (SAGARPA, 2000-
2008).
2 METHOD
The examination of the data obtained from
SAGARPA and the INEGI showed inconsistencies.
According to the data from SAGARPA only three
municipalities in the state of Puebla have no rainfed
maize agriculture, Altepexi, Atzala and Zinacatepec,
512
Vermonden Thibodeau A. and Gay Garcia C..
Using Andaptive Neuro Fuzzy Inference System to Build Models with Uncertain Data for Rainfed Maize - Study Case in the State of Puebla (Mexico).
DOI: 10.5220/0004622205120516
In Proceedings of the 3rd International Conference on Simulation and Modeling Methodologies, Technologies and Applications (MSCCEC-2013), pages
512-516
ISBN: 978-989-8565-69-3
Copyright
c
2013 SCITEPRESS (Science and Technology Publications, Lda.)
while the map of land use from INEGI (INEGI,
2005) shows that other 16 municipalities without
rainfed agriculture, see Figure 1.
Another assumption made for the land use map
for rainfed agriculture is that in all the area presented
maize is being cultivated. Since maize is the most
important cereal in the Mexican diet and 92% of the
farmers in Mexico that own between 0 to 5 hectares,
produce 56.4% of the maize, by the rainfed farming
practice. Therefore the assumption is the areas
presented as rainfed agriculture are rainfed maize
agriculture.
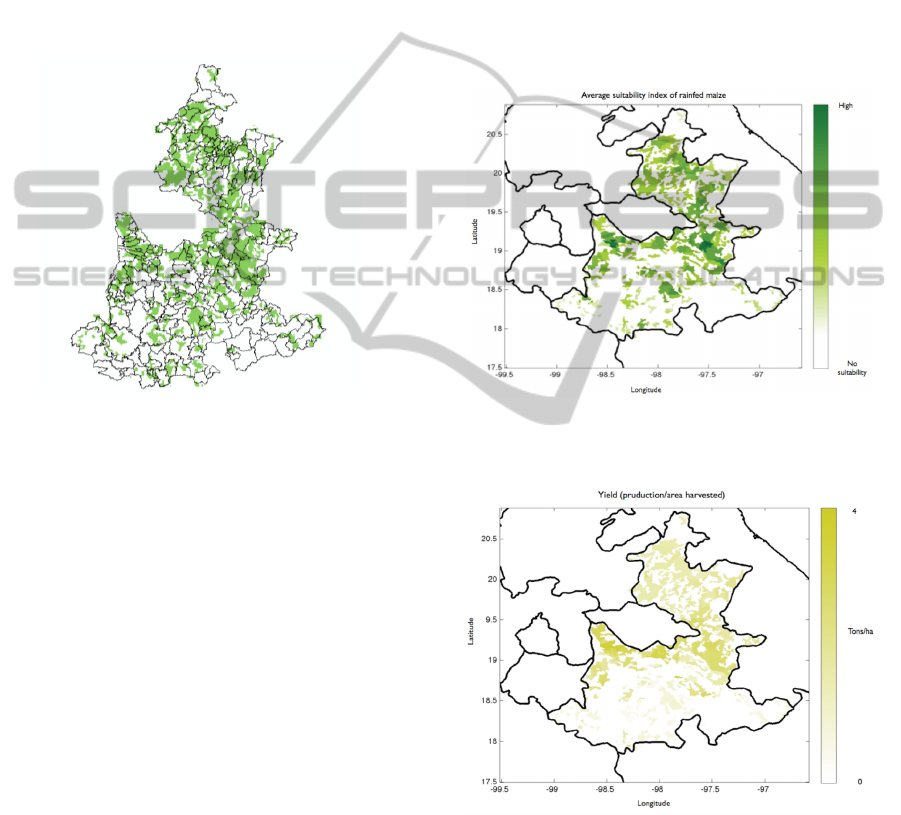
Figure 1: Map of the state of Puebla showing in green the
municipalities division and land use for rain-fed
agriculture.
Since the data from SAGARPA is at municipality
level for the period of 200 to 2008, the map of land
uses of INEGI, was used as a mask to extract the
data of the suitability index, since it would
correspond to the area marked where rainfed maize
agriculture is being produced. An average was
calculated to obtain the equivalent scale of the
following two variables (Figure 2). Figure 3 shows
the values of yield per hectare and Figure 4 the
percentage of production area lost.
To determine the relationship between the three
variables, a subtractive clustering algorithm (Chiu,
1994) was used to generate a fuzzy system. This
algorithm allows to estimate the number of clusters
and their centers, to latter build the membership
functions and the relations between the variables.
First the centers are established through subtractive
clustering method (Dubois and Prade, 1980), once
the center is calculated it determines the radius of
influence. For each data of the set a potential
measure is calculated to check the center of the
cluster using the density of surrounding data. This is
done to identify natural groupings of the data from a
large data set, allowing concise representation of
relationships embedded in the data. In this case four
clusters were calculated, and thus reducing the
complexity of the sets and the analysis of the
relationship between the variables. The data of the
clusters found was used later in the training of the
model.
After obtaining the clusters, these were used to
generate the if-then rules and membership functions.
The information was added to the genfis2 function
(MATLAB, 2008) and 75% of the data set was used
to train and generate a fuzzy inference system (FIS)
Sugeno type (Sugeno, 1977).
Figure 2: Map of the state of Puebla where the average of
the suitability index for rain-fed maize is shown with the
mask of land use for rain-fed agriculture
Figure 3: Map of the state of Puebla showing the yield per
hectare with the mask of land use for rain-fed agriculture.
First with the information obtained with the
subclustering method it determines the number rules
and antecedent membership functions and the uses
the least square estimation to determine each rule’s
consequent equations. Returning a FIS structure that
UsingAndaptiveNeuroFuzzyInferenceSystemtoBuildModelswithUncertainDataforRainfedMaize-StudyCasein
theStateofPuebla(Mexico)
513
contains a set of fuzzy rules to cover the feature
space.
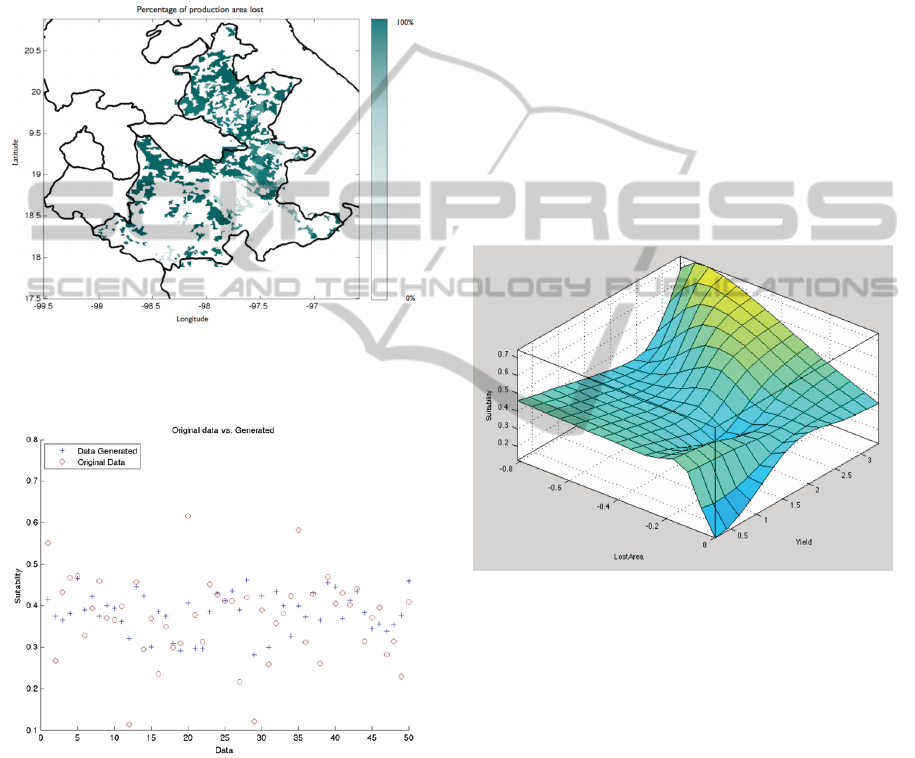
The 25% left of the data set is then used to verify
the model. To verify the model the root mean square
error of the system generated by the training data
was calculated to be 0.0736. The root mean square
error of the system was used for both checking and
testing the FIS parameters was 0.0947. Both very
close to zero.
Figure 4: Map of the state of Puebla showing the
percentage of production area lost with the mask of land
use for rain-fed agriculture.
Figure 5: Graph showing the 25% of the data used to
verify the model, in circles the original data, the calculated
data by the model after improving it’s capacity with
ANFIS in crosses.
ANFIS is used to improve the capacity of the FIS to
model the data. Again 75% of the data is used to
train the neuro-adaptive network. In this case the
hybrid optimization method was used, which
combines gradient descent and the least squares
method. The gradient descent is used on the premise
parameters that define the membership functions and
for the consequent parameters that define the
coefficients of each output equations the least
squares method is used. A hundred Epochs were
used and the training error tolerance was set to zero.
Stability of the training was achieved before Epoch
30. To verify the model the root mean square error
of the system generated by the training data was
calculated to be 0.0710. The root mean square error
of the system was used for both checking and testing
the FIS parameters was 0.0854. Improving the
previous the FIS generated by genfis2.
3 RESULTS
The fuzzy surface of the rules generated with the
data (Figure 6) show that the areas with the highest
suitability index have the highest percentage of
production area lost.
Figure 6: Graph of the surface crea12ted by the rules of
the FIS.
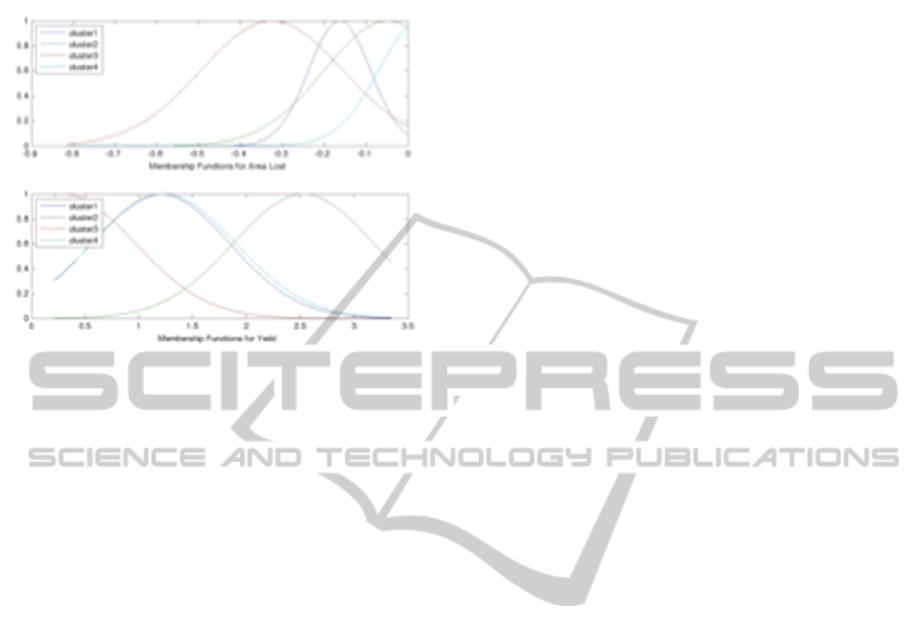
The FIS generated with the data gave; for the first
input variable (percentage of production area lost),
four membership functions that have a tendency to
the lower losses whilst the membership functions for
Yield area better distributed across the interval, but
cluster1 and cluster 4 cover a very similar area. As
shown in Figure 7.
Four rules were generated:
If (AreaLost is Cluster1) and (Yield is Cluster1)
then (Suitability is Cluster1)
If (AreaLost is Cluster2) and (Yield is Cluster2)
then (Suitability is Cluster2)
If (AreaLost is Cluster3) and (Yield is Cluster3)
then (Suitability is Cluster3)
If (AreaLost is Cluster4) and (Yield is Cluster4)
then (Suitability is Cluster4)
SIMULTECH2013-3rdInternationalConferenceonSimulationandModelingMethodologies,Technologiesand
Applications
514
This preliminary model can be used to formulate
scenarios on how the yield per hectare and the area
Figure 7: Membership functions generated by ANFIS.
of production loss due to the change in the suitability
index by climate change since two of the variables
used to build it are mean temperature and
precipitation.
The results of the model show an important
human hidden factor in the data, since a farmer can
declare production areas lost to claim insurance or
simply didn’t plant the area he declared, which is
reflected on the surface of figure 6, as well as in the
membership functions for this variable as they are
all in the same range, where high percentage of the
production area is lost and medium yield production
should have a low suitability index.
4 CONCLUSIONS
The state of Puebla is known for the origin of
cultivated maize. The methodology used was the
subtractive clustering analysis and ANFIS to
establish the relationships between the suitability
index for rain-fed maize and the other variables.
This preliminary model reflects where suitability is
higher then the area lost is higher. A study of the
municipality of Molcaxac (Gaspar Angeles et al.,
2010), which has a high suitability index for the
period of 2002 to 2003 only cultivated 35% of the
total production of the cereal, due to the degradation
of the soils. The data of SAGARPA has a few
inconveniences since they are presented at the
municipality level and within the same municipality
the range in suitability index may present high
variations. Also the SAGARPA data, in terms of
percentage of production area loss, do not show any
distinctions if the loss was due to climate, pests, or
simply that the farmer did not plant the total area
that had been declared, or hasn’t harvested all the
area declared (which can occur when the price of
corn falls and no longer compensates the harvesting
cost). The data obtained is from 2000 to 2008, since
in older data the number of municipalities decreased
(since new municipalities are created) and much
older data is only at the rural development districts
(DDR) level, which do not have a clear idea of the
municipalities belonging to each one, and some may
even belong to several, nor there is a map of them
adding more uncertainty to the model.
This model shows that agriculture as any human
system is complex, and it requires a greater number
of variables in order to make the results more
understandable. These variables could be the use of
fertilizer, pesticides, enhanced maize seeds, soil
degradation. Also interviews with farmer could
ameliorate the results and determining which areas
on the map are being used for maize and which are
not, this would also help understand why the hight
suitability areas have the highest losses. But
preliminary results allow us to establish
relationships between these variables that experts
find coherent and that more detailed studies like the
study of the Molcaxac municipality are showing to
be an alarming trend in the state of Puebla.
This kind of model can simplify the decision
making process since the results are objective and
transparent based in mathematical principles, and the
results of this model are significant even if the data
is insufficient, helping to understand reality better.
ACKNOWLEDGEMENTS
The present work was developed with the support of
the Programa de Investigación en Cambio Climático
(PINCC) of the Universidad Nacional Autónoma de
México (UNAM) and the Consejo Nacional de
Ciencia y Tecnología (Conacyt).
We would like to thank Dr. Cecilia Conde & Dr.
Alejandro Monterroso for their valuable inputs and
serving as the experts to validate the model.
REFERENCES
Chiu, S. L. (1994). "Fuzzy Model Identification Based on
Cluster Estimation." Journal of Intelligent & Fuzzy
Systems 2(3): 267-278.
Dubois, D. and H. Prade (1980). "Fuzzy Sets and Systems:
Theory and Applications." New York Academic Press.
UsingAndaptiveNeuroFuzzyInferenceSystemtoBuildModelswithUncertainDataforRainfedMaize-StudyCasein
theStateofPuebla(Mexico)
515

Gaspar Angeles, E., E. Ortiz Torres, et al. (2010).
"Caracterización y rendimiento de poblaciones de
maíz nativas de Molcaxac, Puebla." Revista
fitotecnica mexicana 33(4).
INEGI (2005). Uso del Suelo y Vegetación Puebla,
Instituto Nacional de Estadística y Geografía.
Jang, J.-S. R. (1993). "ANFIS: adaptive-network-based
fuzzy inference system." Systems, Man and
Cybernetics, IEEE Transactions on 23(3): 665-685.
MATLAB (2008). MATLAB. T. M. Inc. Natick,
Massachusetts.
Monterroso Rivas, A. I., C. Conde Álvarez, G. Rosales, J.
D. Gómez, C. Gay (2011). "Assessing current and
potential rainfed maize suitability under climate
change scenarios in México " Atmósfera 24(1).
SAGARPA, Secretaria de Agricultura, G., Desarrollo
Rural, Pesca y Nutrición (2000-2008). Producción
anual de maíz del estado de Puebla.
Sugeno, M. (1977). "Fuzzy measures and fuzzy integrals:
a survey." North-Holland, NY.
Vermonden, A. (2012). Modelo Difuso para la Evaluación
de la Aptitud Actual y Potencial del Maíz de Temporal
en México con Cambio Climático. Posgrado de
Ciencias de la Tierra. Mexico, Universidad Nacional
Autónoma de México. Maestría: 110.
SIMULTECH2013-3rdInternationalConferenceonSimulationandModelingMethodologies,Technologiesand
Applications
516
