
Emergency Ambulance Deployment in Val-de-Marne Department
A Simulation-based Iterative Approach
Lina Aboueljinane, Evren Sahin and Zied Jemai
Ecole Centrale Paris, Grande voie des Vignes, 92295 Chatenay-Malabry, France
Keywords: Emergency Medical Services, Ambulance Deployment, Discrete Event Simulation, Healthcare, Operations
Management.
Abstract: The French Emergency Medical services, known as SAMU, are public safety systems responsible for the
coordination of pre-hospital care under emergency conditions throughout a given geographic region. The
goal of such systems is to respond timely and adequately to population calls by providing first aid services
and transferring patients, when needed, to the appropriate care facility. In this paper, we propose a multi-
period version of the Maximum Expected Covering Location Problem applied to the case of the SAMU 94
responsible for the Val-de-Marne department (France). The assumption that the busy fractions are identical
for all demand points is relaxed by adopting an iterative method to compute a priori estimates of these
parameters in the model using an ARENA discrete-event simulation model of the SAMU 94. The solutions
obtained from the mathematical model are then assessed by simulation regarding the time required to
respond to an emergency call by getting to the patient location, known as response time, which is a critical
aspect for the SAMU providers. Experimental results showed that the proposed method increased average
percentage of most serious calls responded to within the target time of 15 minutes up to 15% compared to
the current system performance.
1 INTRODUCTION
Pre-hospital care refers to first aid services provided
to patients under emergency conditions from
incident reporting, i.e. an incoming call via an
emergency number, to definitive care, involving
facilities, equipment and personnel trained to
provide phone support, stabilization of patient’s
condition and transportation to an appropriate care
facility. In France, the emergency medical service
(EMS) system responsible for providing such
services is known as the SAMU system which
stands for the French acronym of “Urgent Medical
Aid Service”. It was established in 1968 to
coordinate the activity of the “Mobile Emergency
and Resuscitation Services”, named SMUR teams,
which are mobile response vehicles staffed with
qualified personnel and operated by public hospitals.
The SAMU rescue process is organized according to
two types of operations: Central operations,
performed in a reception and regulation (R&R)
centre, that aim to provide phone support and to
decide the proper response for each call received
depending on its degree of urgency, and External
operations that aim at sending one or several SMUR
team(s) to perform pre-hospital care for two types of
rescues: primary rescues which are related to major
injuries or illnesses that require immediate medical
assistance outside of the hospital (e.g., cardiac arrest,
trauma, childbirth...) and secondary rescues which
correspond to the transport of patients from one
hospital to another, in case medical staff assistance
is needed during the transfer. Between rescues,
SMUR teams are placed in fixed positions, called
bases that are currently located in public hospitals.
The SAMU system is managed at a department level
(i.e. a French administrative division corresponding
to a median area of about 6 000 km²) in order to
provide a 24-hour service for each department.
One of the critical performance measures for the
SAMU providers, particularly in case of life-
threatening emergencies, is the response time,
defined as the period between the receipt of a call
and the first arrival of a SMUR team at the scene of
incident. Several authors observed the association
between low response time and high survival rate of
patients (Cummins, 1989); (Vukmir, 2006); (White
et al., 1996). Hence, having a high coverage, i.e.
565
Aboueljinane L., Sahin E. and Jemai Z..
Emergency Ambulance Deployment in Val-de-Marne Department - A Simulation-based Iterative Approach.
DOI: 10.5220/0004623105650576
In Proceedings of the 3rd International Conference on Simulation and Modeling Methodologies, Technologies and Applications (HA-2013), pages
565-576
ISBN: 978-989-8565-69-3
Copyright
c
2013 SCITEPRESS (Science and Technology Publications, Lda.)

percentage of calls responded to within a specific
bound, is a commonly expressed objective for the
SAMU managers. Another concern of the SAMU
system is to reduce the significant expense involved
in its management, including capital (acquisition of
physical plant, vehicles, equipment, communication
etc.) and operating costs (salaries, training,
maintenance, etc.).
Both timeliness and economical goals can be
achieved through the optimization of several design
and operation decisions that are highly interrelated
and may be classified according to the following
classical operations management hierarchical
decision framework:
Long term decisions such as setting service level
objectives, identifying the location and the
capacity of the fixed facilities needed to perform
central operations as well as a set of potential
locations for SMUR teams bases throughout the
covered department ;
Mid-term decisions: such as allocating SMUR
teams to bases selected among those specified in
the long term level so as to ensure a brief delay in
reaching every call location (known as the
deployment problem) and scheduling shifts for
human resources;
Short-term decisions: such as determining the rules
of assigning one or several available SMUR teams
to a call (known as the dispatching problem),
allocating SMUR teams to bases in order to
improve coverage of future requests under
temporal and geographical fluctuations of demand
pattern (known as Multi-period redeployment) or
depending on the number of SMUR teams
available following the allocation or release of a
team (known as dynamic redeployment);
In literature, several operations research tools have
been used to improve the performance of EMS
systems through the optimization of these decisions.
The current research addresses the multi-period
redeployment problem as an improvement
opportunity to develop service coverage
performances of the SAMU system in the Val-de-
Marne department (south east of the city of Paris),
named SAMU-94, under limited number of
resources. In this regard, we propose an iterative
method that combines the use of a probabilistic
mathematical covering model to find the optimal
locations of the existing SMUR teams throughout
the service area for different periods of time, with
the use of a discrete-event simulation model of the
system, implemented in ARENA software, in order
to evaluate the busy fraction parameter (i.e. the
probability for a SMUR team of being unavailable to
answer a call) required to solve the analytical model
as well as to analyze the performance of the system
under the redeployment solutions obtained from this
model.
The paper is organized as follows: Section 2
briefly describes the literature review on the use of
simulation and mathematical models in EMS
management. Section 3 describes the detailed
methodology used to build the SAMU-94 simulation
model, including the process description, the data
collection and the validation of the initial
configuration of the model. In Section 4, we present
the probabilistic covering model and the iterative
approach to estimate the busy fraction parameters.
Experimental results are described in Section 5.
Finally, Section 6 provides conclusions and presents
some directions for future research.
2 LITERATURE REVIEW
In literature, mathematical programming is one of
the most studied analytical tools used to improve the
performance of EMS systems. Mathematical models
have been focused mainly on the decision of
assigning rescue teams to bases, in both mid-term
(deployment problem) and short term (dynamic and
multi-period redeployment) settings. Research on
this area has been largely derived from two early
deterministic models: The Location Set Covering
Problem (LSCP), developed by (Toregas et al.,
1971), which aims to minimize the number of rescue
teams needed to cover all demand points within a
target distance (time), and the Maximal Covering
Location Problem (MCLP), proposed by (Church
and ReVelle, 1974), which maximizes the
population coverage within a target distance (time)
using a limited number of available rescue teams.
These two basic models overestimate coverage since
they ignore some stochastic aspects such as the fact
that dispatched rescue teams become unavailable to
answer incoming calls. Two extensions have
therefore been proposed to provide more robust
location solutions. One extension is to consider the
deterministic covering problem with an extra
coverage, i.e. to maximize the demand covered by
more than one rescue team to serve simultaneous or
close calls (Daskin and Stern, 1981); (Eaton et al.,
1986); (Gendreau et al., 1997); (Hogan and ReVelle,
1986). The other extension consists of probabilistic
models that explicitly consider rescue teams’
potential unavailability through the use of the busy
fraction parameter. These models include the
expected covering location models that aim to
SIMULTECH2013-3rdInternationalConferenceonSimulationandModelingMethodologies,Technologiesand
Applications
566

maximize the expected demand covered, expressed
as a function of the busy fraction, such as the
MEXCLP (Maximum Expected Covering Location
Problem) of (Daskin, 1983) and its applications and
extensions (Bianchi and Church, 1988); (Fujiwara et
al., 1987); (Goldberg et al., 1990b); (Repede and
Bernardo, 1994). Another probabilistic approach
consists of the formulation of the deployment
problem as a chance constrained stochastic program
that incorporates the unavailability aspect as a linear
constraint. This constraint uses the busy fraction to
compute a lower bound of rescue teams required to
achieve a given reliability level α in serving each
demand point (ReVelle and Hogan, 1989); (ReVelle
and Marianov, 1991). These models typically
assumed that all rescue teams operate independently
and have the same busy fraction q, estimated by
dividing their total workload by their total operating
time, regardless of their location and the overall
number of teams servicing each demand point.
These assumptions are obviously not valid since the
team’s location affect the travel time to the call
location and therefore the total workload. Moreover,
the larger is the fleet size covering an area, the lower
is the probability of a team to be busy. The difficulty
of estimating the busy fraction parameters which are
related to the location of teams is that this location is
precisely the solution obtained from the optimization
model, while the latter requires these parameters to
be known a priori in order to provide a solution.
Yet, for a specific deployment plan, several authors
used descriptive tools such as hypercube queuing
models (Batta et al., 1989); (Larson, 1974);
(Marianov and Revelle, 1994) and computer
simulation (Ingolfsson et al., 2003); (Su and Shih,
2003) to pre-compute more accurate estimations of
these parameters.
Apart from the mathematical programming
approach mentioned above, computer simulation has
been one of the most widely used technique to
identify potential areas of improvement in EMS
systems without considering simplifying
assumptions needed to solve analytical models.
Indeed, the main advantage of simulation in dealing
with such problems is its ability to describe the
system in a high degree of detail, to estimate several
performance measure predictions and to handle
several sources of uncertainty such as time-
dependent arrival rate and location of calls, available
capacity and location of rescue teams, duration of
service time depending upon the medical needs of
patient and bed availability of definitive care
facilities. Research that is available in this area may
be classified into two groups:
Simulation models used to estimate the impact of
several scenarios (i.e. changes applied to
simulation model assumptions, algorithms and/or
data) on some selected performance outputs.
Simulation models primarily developed to assess
the performance of solutions that are obtained
from analytical models in a more realistic
framework
The scenarios considered in the first group are
typically related to the design and operation
decisions described in Section 1. The most explored
long term decisions related scenarios consist of
adding more rescue teams or new potential bases.
These two scenarios are usually explored
concurrently to be compared in terms of cost and
quality performance (Gunes and Szechtman, 2005);
(Inakawa et al., 2010); (Ingolfsson et al., 2003);
(Savas, 1969). Another scenario tested consists of
assessing the effect of an increase in demand
following for instance the growth of population or
the enlargement of the scope of EMS system
(Lubicz and Mielczarek, 1987); (Silva and Pinto,
2010). As for the mid-term decisions related
scenarios considered in EMS literature, they mainly
focused on the deployment problem which is usually
evaluated jointly with the long term scenario of
considering new potential bases in order to assess
the relocation of rescue teams close to high demand
areas (Fitzsimmons, 1971); (Goldberg et al., 1990a);
(Henderson and Mason, 2005). Finally, the available
literature in the area of short term decisions related
scenarios addresses changes either in dispatching
rules (Koch and Weigl, 2003); (Su and Shih, 2003),
destination hospital assignment policies (Wang et
al., 2012); (Wears and Winton, 1993), multi-period
redeployment strategy (Peleg and Pliskin, 2004),
dynamic redeployment strategy (Ingolfsson et al.,
200)3; (van Buuren et al., 2012) and travel speeds of
emergency vehicles (Aringhieri et al., 2007); (Liu
and Lee, 1988).
The second use of simulation with analytical
models has also largely been adopted in EMS
literature. Typically, this combined approach
involves using a location or a relocation
mathematical programming model first, in order to
determine sets of optimal locations, given the set of
feasible locations, and then using simulation to
estimate system performance under the resulting
deployment/redeployment plan. In the literature, the
mathematical programming models proposed in such
approach include deterministic models with simple
coverage (Berlin and Liebman, 1974); (Uyeno and
Seeberg, 1984), deterministic models with multiple
coverage (Aringhieri et al., 2007) and probabilistic
EmergencyAmbulanceDeploymentinVal-de-MarneDepartment-ASimulation-basedIterativeApproach
567

models (Fujiwara et al., 1987); (Harewood, 2002);
(Repede and Bernardo, 1994).
In this paper, we propose to apply this combined
approach to the EMS of Val-de-Marne department
(SAMU-94) in order to improve the response time
performance of the system. For this purpose, we
proposed a multi-period extension of the MEXCLP
(Daskin, 1983) that integrates some specificities
related to call priorities as well as site-specific busy
fraction parameters depending on the number of
rescue teams serving each site and the time period.
Busy fraction parameters are estimated using an
iterative method, derived from (Lee et al., 2012),
that uses a discrete event simulation model of the
system in each step to update the busy fraction
estimates based on the location solution obtained
from the optimization model in the previous step.
The updated estimates are subsequently used in the
optimization model to provide updated location
solution. This iterative process continues until the
location solution converges.
3 SIMULATION MODEL
3.1 Problem Description
This simulation study used the discrete event
simulation software ARENA (Rockwell
Automation, Milwaukee, Wisconsin) to build a
model that takes the SAMU 94 system as its subject
and seeks to compute credible estimates of busy
fraction and response time performance measures. A
first step in the methodology of performing the study
consists of conducting meetings and interviews with
the SAMU-94 experts in order to clarify the input
parameters and the detailed process associated with
the system which involves various types of human
and material resources which are:
Operators: Located in the R&R centre, they are
responsible for answering calls, identifying
inappropriate calls, creating a medical file and
recording the basic information relative to the
nature of the request;
Regulators: Located in the R&R centre, they are
responsible for performing medical evaluation of
calls and deciding on the best solution for the
patient. There are two types of regulators:
emergency physicians, named “SAMU regulators”,
responsible for high priority calls, and general
practitioners, named “PDS regulators”, responsible
for remaining calls;
SMUR teams: consisting of a vehicle staffed by
one physician, one driver, one nurse and/or one
emergency medical technician. There are two
types of vehicles: well-equipped ambulances,
called Mobile Intensive Care Units (MICU), and
medical vehicles (MV) which are usually
dispatched for the most serious calls because they
are faster than MICU but do not allow for the
transport of the patient. The SMUR teams are
currently located in two bases: one central base
located at Henri-Mondor Hospital (HM) and one
auxiliary base located in Villeneuve-Saint-Georges
Hospital (VSG);
Rescue physician: an emergency physician who
can either operate as a SAMU regulator or as a
physician in a SMUR team.
The SAMU-94 central operations are triggered when
a call is first received by an operator in the R&R
centre which is located in the central base HM.
Depending on the potential severity of the call, the
operator chooses to redirect the call to a SAMU or a
PDS regulator. The regulator performs a medical
evaluation which can lead to several possible
decisions: In the case of primary rescues, if the call
is not urgent, a simple advice is given to the patient
or a private ambulance is dispatched. If the request
is a relative emergency, the call is transferred to a
basic life support or BLS system such as fire-
fighters or red-cross. However, if the incident turns
out to be more urgent than the first evaluation, the
BLS calls back an operator to ask for the dispatch of
a SMUR team. These calls are referred to as primary
rescues with sending BLS as first effector.
Otherwise, if the request is an absolute emergency, a
SMUR team is immediately dispatched to the call
location, which is known as primary rescues with
sending SMUR team as first effector.
In the case of a secondary call, an appointment is
taken with the origin hospital in order to send a
SMUR team when more than one team is available
in the central station.
Once the regulator decides to send a SMUR
team, he evaluates the availability and the
geographical location of the fleet and notifies the
closest available unit. This is the beginning of
external operations. The interval between the arrival
of the call until a SMUR team is notified is referred
to as the dispatching time. The selected rescue team
prepares the rescue by gathering any necessary
equipment that may not be available on the vehicle,
inquiring information concerning the incident and
rushing to the vehicle. The interval between the time
the SMUR team receives the notification to the time
it leaves for rescue is called preparation time. Note
that this step is only performed if the SMUR team is
located at a base when notified of a call. The SMUR
SIMULTECH2013-3rdInternationalConferenceonSimulationandModelingMethodologies,Technologiesand
Applications
568

team then leaves for rescue. The travel time is the
time elapsed from the initial movement of the
vehicle until the arrival at the scene.
The SMUR team spends some time to stabilize
the patient. If more advanced care is deemed
necessary, the SAMU regulator determines the
appropriate destination hospital and communicates
this decision to the SMUR team. The choice of a
primary rescue’ destination hospital may depend on
several factors such as the proximity of hospital, its
available capacity and appropriate facilities for the
patient (specialists, particular equipment...) or
patient choice. The SMUR team therefore prepares
the patient for transportation and leaves the scene.
The interval between the time the rescue team
arrives at the scene and the time it leaves is usually
called on-site time. Before the transport to the
destination hospital, the patient may need a
diagnostic or therapeutic radiography (DTR) such as
MRI, X-ray (if the destination hospital does not have
the appropriate equipment or have long waiting
times). In this case, the SMUR team takes the patient
to the medical service where the DTR is performed.
The time interval between the SMUR team arrives at
the DTR medical service and the time it leaves is
called diagnostic or therapeutic radiography time.
After arriving at the destination hospital, the rescue
team transfers the patient to the hospital staff and
spends some time completing paperwork. The time
needed to perform these tasks is called drop-off time.
Finally, the SMUR team becomes available and can
travel for another rescue or return to the base to
which it is assigned to wait for the next mission.
3.2 Data Collection and Analysis
The rescue records of the SAMU 94 were collected
for a period of 15 months of operations. This
database, hereafter referred to as “regulation
database”, included for each call the following data:
(1) The time and date of each call; (2) The origin of
the call; (3) The type of call (primary/secondary);
(4) The first effector if primary call (SMUR team or
BLS); (5) The priorities assigned to the call, by the
regulator and by the SMUR team once at call
location. Priority 1 is assigned to life-threatening
emergencies (e.g. cardiac arrests, serious trauma,
etc.) and priority 2 is assigned otherwise; (6) The
response team that performs the rescue; (7) The
destination hospital; (8) The timing of the different
steps in the rescue process: SMUR team notified,
SMUR team leaves for the rescue, SMUR team
arrives at the scene, SMUR team leaves the scene,
SMUR team arrives at the diagnostic or therapeutic
radiography service, SMUR team leaves the
diagnostic or therapeutic radiography service,
SMUR team arrives at the hospital, SMUR team
finishes the rescue.
This database was first analysed to exclude any
record (call) containing missing data or errors in
measures. Only 2.1% of the logged calls were
therefore removed, resulting in a database of 9836
calls.
From the verified records, we extracted the
empirical distributions of the following:
The arrival rate of calls per hour of the day, day of
the week and type of call (primary/secondary);
The priority of each type of call: These priorities
are used in the developed simulation model to
establish a hierarchy in responding to simultaneous
calls or calls waiting for the dispatch of a SMUR
team;
The first effector (SMUR team or BLS) for
primary calls;
The location of calls and hospitals: In order to
accurately model this geographical distribution, we
aggregated the network road nodes based on their
proximity in a zone structure corresponding to
basic units of approximately 2000 residents,
developed by the French National Institute for
Statistics and Economic Studies (INSEE) and
known as “IRIS” for the French acronym of
“aggregated units for statistical information”. The
Val-de Marne department is composed of 527
IRIS. This division is a reasonable computational
trade-off that aggregate the large amount of calls
into small areas without having a significant travel
time within a given area;
The processing times per type and priority of calls:
These times include the dispatching time, the
preparation time, the on-site time, the diagnostic or
therapeutic radiography time and the drop-off time
for primary rescues. As for secondary rescues, they
are considered as low priority calls which aim to
provide transport of patient when possible without
timeliness constraints. Therefore they were
implemented in the model as an aggregated service
time so as to properly size the utilization rate of
resources ;
The historical data were first fitted to theoretical
distributions, using Kolmogorov-Smirnov and Chi-
Square goodness-of-fit tests, which provided low p-
values (less than 0.05). Therefore, we chose to use
the empirical distributions that allow to better
capture the characteristics of the data (Kelton et al.,
2008).
Unlike processing times, there are no empirical
travel times’ data available for currently unexplored
EmergencyAmbulanceDeploymentinVal-de-MarneDepartment-ASimulation-basedIterativeApproach
569
road networks due to different deployment
strategies. Hence, in cooperation with the National
Geographic Institute (IGN), we used a shortest path
algorithm to pre-compute travel times for every
possible origin, destination, time period and priority
of call. The origins and destinations correspond to
the 527 IRIS of the service area that include all
demand points, bases and hospitals. The time
periods represent the degree of traffic load at various
times of the day according to six shifts that
distinguish between weekdays (6:00-10:00, 10:00-
15:00, 15:00-21:00 and 21:00-6:00) and weekends
(12:00-21:00 and 21:00-12:00). Based on the GPS
traces database of the SAMU-94 vehicles, an
average travel time per time period was assigned to
each section of the road network of the Val-de-
Marne department according to its typology
(motorway, main road, minor road, local street). For
any given combination of origin IRIS, destination
IRIS and time period, a sample of 10 pairs of exact
addresses were randomly chosen within the two
IRIS. For each pair, travel time was computed by
summing up the average travel times associated with
the sections that form the shortest path between the
two addresses. The average of the 10 pairs’ travel
times provided a good approximation of the
combination travel time compared to the common
assumption of computing travel times between the
centres of the zones. Finally, as SMUR teams are
allowed to travel at all possible speed when
responding to primary calls of priority 1, related
travel times were weighted by a multiplicative factor
estimated at 0.937 to decrease them compared to
standard travel times.
3.3 Simulation Model Implementation
and Validation
The previously described SAMU-94 rescue process
and data were summarized in a computerized model
implemented using ARENA. The outcome variables
of the model included the response time of each
priority/effector of primary calls and the utilization
rates of each SMUR team for each time
period/priority. Different random number seeds were
used to replicate the model 20 times. Each
replication length corresponds to 15 months of
operations and 1 day as a warm up period.
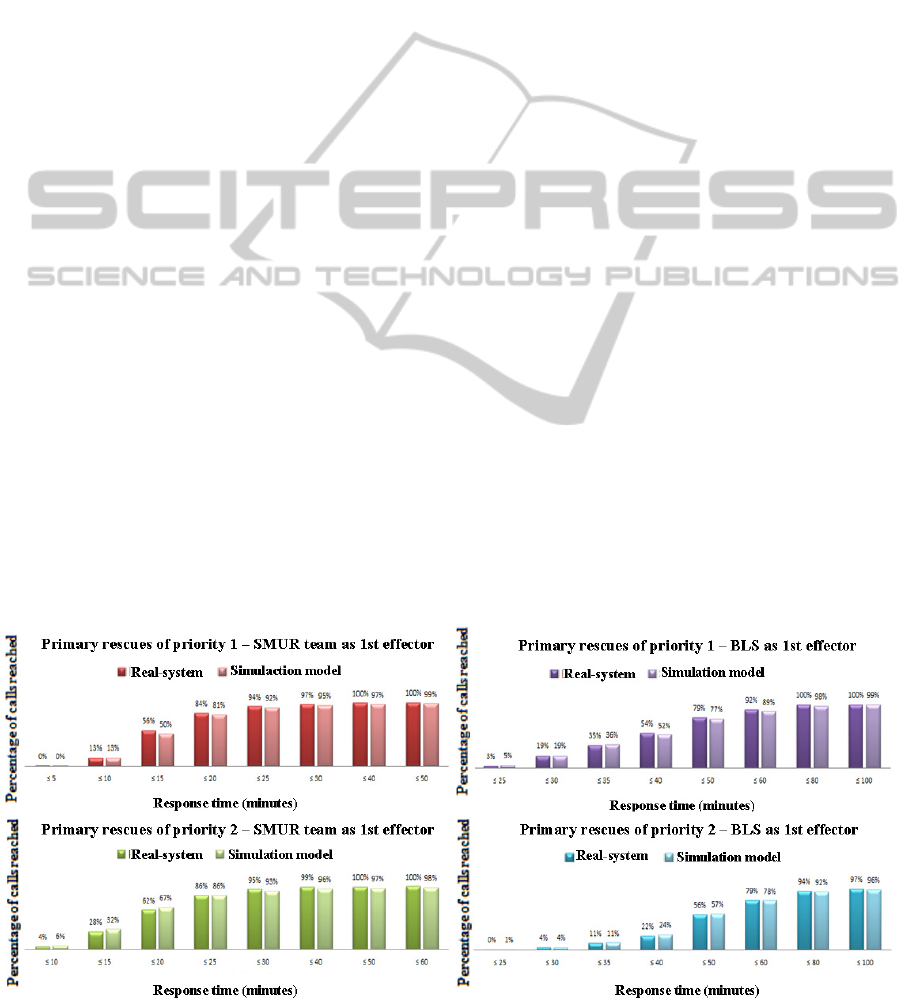
We performed a historical data validation by
comparing the system’s empirical data to the
corresponding simulation-derived distribution. An
example of response time measure validation for
primary rescues, shown in Figure 1, indicates that
model’s outputs are quite close to the observed
distributions as the differences do not exceed 5.7%.
4 OPTIMISATION MODEL
In order to optimally locate SMUR teams close to
primary demand so as to improve the corresponding
response time performance, we propose the use of a
probabilistic multi-period model that seeks to
maximize the expected primary demand covered
using a limited number of SMUR teams. The model,
which is derived from the Maximum Expected
Covering Location Problem (MEXCLP) of (Daskin,
1983), is as follows:
1
∈∈∈
(1)
Figure 1: The cumulative distributions of real and simulated response time for primary rescues.
SIMULTECH2013-3rdInternationalConferenceonSimulationandModelingMethodologies,Technologiesand
Applications
570

Subject to
∈
∈
∈
∈
(2)
∈
∈
(3)
∈
∈
∈
(4)
∈
0,1
∈,1,………..,
,
∈,∈
(5)
Set of Index
V is the set of all demand nodes.
W is the set of all potential bases.
T is the set of all periods of time.
P is the set of primary calls’ priorities.
Parameters
r
ijt
is the travel time from the base j to the demand
point i during the period t.
W
pit
= {j∈W : r
ijt
≤ S
p
} is the set of all potential bases
eligible to serve calls of priority p located in the
demand node i within a target travel time S
p
.
d
itp
is the total number of calls of priority p received
in the period t associated with the demand node i.
N
t
is the number of SMUR teams scheduled in the
time period t.
α
p
is the weight associated with the priority p
demand coverage.
q
ikpt
is the average busy fraction of k SMUR teams
eligible to serve demand of priority p located at node
i during the time period t.
Decision variables
x
jt
is an integer variable that corresponds to the
number of SMUR teams assigned to the base j
during the time period t.
y
ikpt
is a binary variable equal to 1 if demand of
priority p located in demand node i is covered by at
least k SMUR teams during time period t.
The objective function (1) aims to maximize the
total expected demand covered over all nodes and all
time periods. The weight
assigned to priority p
demand allows emphasizing the importance of high-
priority demand coverage and balancing the effect of
a more restrictive target travel time for high priority
calls. Constraint (2) ensures that for each time
period, a demand of priority p located in node i is
assigned to base j only if a team is located at j.
Constraint (3) restricts the number of SMUR teams
to be located to their scheduled capacity per time
period.
For the application of the model, 47 locations
corresponding to the centre of the 47 districts of the
Val-de-Marne department were selected as potential
bases. The 527 IRIS of the department were
considered as demand nodes. There are between 3
and 5 available SMUR teams during weekdays and 3
SMUR teams during weekends. Ten periods of time
were chosen corresponding to the six travel time
periods described in section 3.2 which are
subdivided whenever a change in the scheduled
number of SMUR teams occurs within a given travel
time period. The model was solved using different
weights (α
1
,α
2
)={(1,0); (0.75,0.25); (0.5,0.5)} and
different target travel times in minutes
(S
1
,S
2
)={(5,10); (10,10); (10,15)}. For each target
travel time, the vector of nodes that can cover each
demand of a given priority at a time period W
pit
was
computed.
The probability that a randomly selected SMUR
team is busy is estimated using the following
equation:
∑
∈
∈,1,…,
,∈,
∈,
(6)
where T
is the average amount of time
worked to serve demand of priority p in time period
t by all SMUR teams located at base j∈W
, T
corresponds to the total work time available at
period t for each SMUR team and k is the total
number of SMUR teams located at bases in
. In
case the number of SMUR teams located within S
p
is
different from k, we used the mean of the existing
estimates over the set of demand nodes to
approximate the busy fraction parameter, i.e. (6) is
replaced by:
∑
∈
∈,1,…,
,∈
, ∈ , ∈ :
(7)
We intuitively believe that this assumption will
provide good estimates for
that will avoid any
excessive underestimation or overestimation of the
ability of the system to cover a demand node under a
given number of vehicles, which will lead to fast
convergence of the iterative method.
We then apply the iterative method described in
(Lee et al., 2012) that consists of using the integer
program to obtain optimal location solution for a
given estimation of q
and then running the
simulation model with the obtained location solution
to tune the estimates of q
using (6) and (7). The
initial values of q
were computed based on the
"initial scenario” model that represents the current
SAMU-94 system. Using this initial estimation, the
integer program is solved to provide the optimal
EmergencyAmbulanceDeploymentinVal-de-MarneDepartment-ASimulation-basedIterativeApproach
571

location solution (y
,x
, which is in turn used
as an input in the simulation model. The resulting
simulated service time worked allows updating the
estimates of q
for the next iteration. This process
is repeated until the location solution converges, i.e.
remains the same for two successive rounds of
iterations, i.e. (y
∗
,x
∗
y
,x
y
,x
.
For each value of weight/target travel time
parameters, the model has been solved at each
iteration using CPLEX 12.5 on an Intel Core i3, at
2,30 GHz, with 4Go of RAM memory. Solution
times ranged from 3.2 to 9.7 minutes. The obtained
redeployment solution was then fed in the simulation
model and run for twenty 15 months-replications in
order to re-compute the corresponding busy
fractions per time period and priority of calls.
5 EXPERIMENTAL RESULTS
As the purpose of this study is to achieve a
substantial improvement in response time
performance for primary rescues with SMUR team
as first effector, the percentage of calls responded to
within target times of 15 minutes and 20 minutes
were set as the main performance measures used to
compare simulation results for priority 1 and 2
respectively. The optimal redeployment policies
resulting from the alternatives of weight/target travel
time combination, described in Table 1, were
analysed in sequence.
We were first interested in analysing how the
system performances behave through the steps of the
iterative method. In all eight tested alternatives, the
method converged within few iterations ranged from
4 to 7. Examples of the expected coverage
performances obtained from the optimization model
and the response time performances obtained from
the simulation model for each iteration step of
alternatives 1 to 3 are shown in Figure 2. The green
Table 1: Description of the alternatives.
Alternatives
S
1
S
2
α
1
α
2
Alt. 1 5 10 0.5 0.5
Alt. 2
5 10 0.75 0.25
Alt. 3
5 10 1 0
Alt. 4
10 10 0.5 0.5
Alt. 5
10 10 0.75 0.25
Alt. 6
10 15 0.5 0.5
Alt. 7
10 15 0.75 0.25
Alt. 8
10 15 1 0
boxes show the 95% confidence interval for the
percentage of calls responded to within the target
response time metric, and the whiskers show the best
and worst cases of the 20 independent runs of each
alternative. As illustrated in the figure, the larger
marginal differences in performances are achieved
between the initial scenario (iteration 0) and iteration
1 solution, achieving an absolute difference of
14,8% ± 0,3% and 9,3% ± 0,2% in the simulated
percentage of calls responded to within the target
response time for priority 1 and 2 respectively. The
results obtained from the subsequent iterations
showed no significant marginal differences that do
not exceed 0,9% ± 0,3% in the percentage of calls
reached within the target response time for both
priorities.
Now we examine the iterative method solution
quality by comparing the converging points’
performances of all the eight alternatives with each
other and with the initial scenario model (See Table
2). The converging redeployment solution
performances obtained from the optimization model
indicated that the expected coverage of priority 1
rescues could be improved by increasing the value
of the weight α
1
. This improvement is more
significant for low values of target times and
achieved up to 13%, while the corresponding
priority 2 expected coverage showed either a slight
or no decrease. This was however not supported by
the simulation framework. Indeed, simulation results
showed that fair coverage weights for both priority 1
and 2 rescues, associated with small target times
seem to significantly positively impact the response
time performance. Thus, implementing the
redeployment policy resulting from alternative 1
improved the percentage of calls responded to within
15 and 20 minutes by 15,0% ± 0,3% and 9,1% ±
0,1% for priority 1 and 2 respectively when
compared to the current SAMU-94 performances,
which represents an average relative improvement of
29,7% and 13,7%.
Differences between the simulation
performances and the optimization model coverage
seem to derive from the fact that the latter ignores
several aspects. First, a part of primary demand may
be served by the rescue physician who is necessarily
located in HM base since he also operates as a
SAMU regulator in the R&R centre. Thus, the
location of this resource cannot be considered as a
decision variable in the linear program, but yet
affects the response time performance in the
simulation model. Second, unlike the simulation
model, the temporal dimension of the arrival rate as
well as the service time distribution are ignored in
SIMULTECH2013-3rdInternationalConferenceonSimulationandModelingMethodologies,Technologiesand
Applications
572
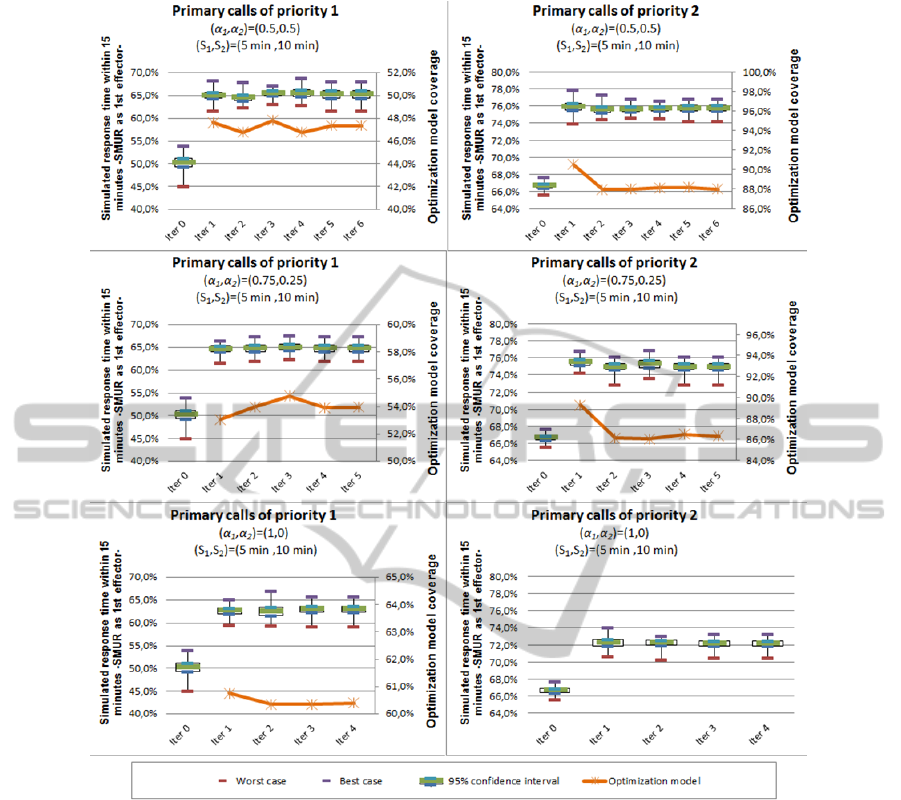
Figure 2: Iterative method performance measures for the (S1,S2)=(5min,10min) alternatives.
model, the temporal dimension of the arrival rate as
well as the service time distribution are ignored in
the optimization model as it uses the total number of
calls received in each time period and an estimation
of the average busy fractions. At this point, the
performances obtained from the simulation model
can be said to be more relevant and reliable.
Further comparisons between the best solution
(alternative 1) and the initial scenario were made by
using the distribution of response time in order to
test the robustness of the redeployment solution by
insuring that the responses that occur within larger
target times’ performances are not decreased
compared to the actual performances. The results
depicted in Figure 3 show that up to a target time of
50 minutes, the redeployment plan based on the
alternative 1 solution always provided better
response time performances than those obtained
from the initial model for both priorities 1 and 2.
The larger differences are obtained for a target time
of 15 minutes (15% ± 0,3% for priority 1 and 13,9%
± 0,1% for priority 2).
6 CONCLUSIONS
This research used a multi-period probabilistic
mathematical model for the location of rescue teams
and a discrete event simulation model embed in an
iterative method to help the SAMU-94 managers in
improving the system response time performances.
The optimization model aims to maximize the
demand covered within a target time under limited
resources, while the simulation model is used both to
EmergencyAmbulanceDeploymentinVal-de-MarneDepartment-ASimulation-basedIterativeApproach
573
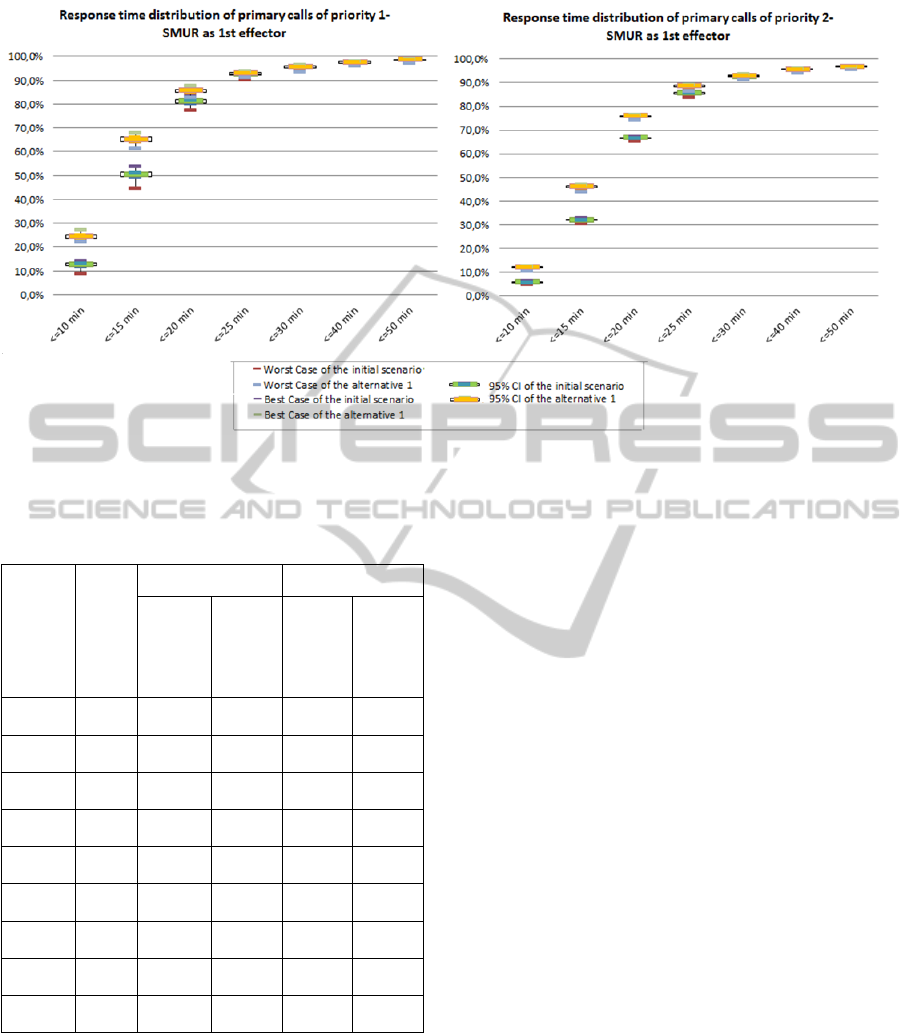
Response time distribution of primary calls of priority 1 –
SMUR as 1st effector
Response time distribution of primary calls of priority 2 –
SMUR as 1st effector
Figure 3: Comparison between the initial scenario and the alternative 1 response time distribution.
Table 2: Comparison of performance measures between
the initial scenario and the converging points for the
different alternatives.
Alternative
Number
of
iterations
to
c
onvergen
c
e
Priority 1 Priority 2
Optimal
expected
coverage
within S
1
Simulat
ed
response
time
within
15 min
Optimal
expecte
d
coverag
e within
S
2
Simulat
ed
response
time
within
20 min
Alt. 1 7 47,4%
65,3% ±
0,9%
88,0%
75,8% ±
0,3%
Alt. 2 6 54,0%
64,7% ±
0,7%
86,3%
75,0% ±
0,3%
Alt. 3 5 60,4%
63,1% ±
0,7%
-
72,2% ±
0,3%
Alt. 4 6 96,7%
63,4% ±
0,8%
89,0%
75,7%±
0,3%
Alt. 5 6 97,6%
63,7%±
0,6%
89,1%
75,8%±
0,4%
Alt. 6 4 98,2%
63,5% ±
0,8%
98,3%
74,8% ±
0,3%
Alt. 7 7 98,5%
62,3% ±
0,9%
98,5%
74,7% ±
0,4%
Alt. 8 4 99,0%
63,2% ±
0,8%
-
73,8% ±
0,3%
Initial
scenario
- -
50,3% ±
0,9%
-
66,6% ±
0,3%
estimate the busy fractions needed as input data in
the analytical model and to obtain reliable estimates
of the system performances given the location
solutions obtained from the optimization model. The
experimental results suggested that the iterative
method could increase the percentage of the demand
covered within 15 minutes up to 29,7% and 43,3%
compared to the current SAMU-94 system for
priority 1 and 2 respectively.
One shortcoming of the proposed redeployment
solution is that it is obtained from the historical
demand data of the SAMU-94. One possible
extension of this work can therefore be based on
forecasting the number of expected emergency calls
so as to derive sufficiently robust relocation strategy
of SMUR teams that covers future demand at the
desired service level. Another area of improvement
for this study is to combine the iterative method
solutions with other scenarios such as increasing the
number of the SAMU-94 resources or implementing
efficient dispatching policies so as to achieve more
considerable improvements in response time
performances.
REFERENCES
Aringhieri, R., Carello, G., Morale, D., 2007. Ambulance
location through optimization and simulation: the case
of Milano urban area, in: 38th Annual Conference of
the Italian Operations Research Society Optimization
and Decision Sciences.
Batta, R., Dolan, J. M., Krishnamurthy, N. N., 1989. The
Maximal Expected Covering Location Problem:
Revisited. Transportation Science 23, 277–287.
Berlin, G. N., Liebman, J. C., 1974. Mathematical analysis
of emergency ambulance location. Socio-Economic
Planning Sciences 8, 323–328.
Bianchi, G., Church, R. L., 1988. A hybrid FLEET model
for emergency medical service system design. Social
science & medicine 26, 163–171.
Church, R., ReVelle, C., 1974. The maximal covering
SIMULTECH2013-3rdInternationalConferenceonSimulationandModelingMethodologies,Technologiesand
Applications
574

location problem. Papers of the Regional Science
Association 32, 101–118.
Cummins, R. O., 1989. From concept to standard-of-care?
Review of the clinical experience with automated
external defibrillators. Annals of Emergency Medicine
18, 1269–1275.
Daskin, M. S., 1983. A Maximum Expected Covering
Location Model: Formulation, Properties and
Heuristic Solution. Transportation Science 17, 48–70.
Daskin, M. S., Stern, E. H., 1981. A Hierarchical
Objective Set Covering Model for Emergency Medical
Service Vehicle Deployment. Transportation Science
15, 137–152.
Eaton, D. J., Héctor, M. L., Sanchez, U., Lantigua, R. R.,
Morgan, J., 1986. Determining Ambulance
Deployment in Santo Domingo, Dominican Republic.
Journal of the Operational Research Society 37, 113–
126.
Fitzsimmons, J. A., 1971. An emergency medical system
simulation model, in: Proceedings of the 1971 Winter
Simulation Conference. ACM, New York, NY, USA,
pp. 18–25.
Fujiwara, O., Makjamroen, T., Gupta, K. K., 1987.
Ambulance deployment analysis: A case study of
Bangkok. European Journal of Operational Research
31, 9–18.
Gendreau, M., Laporte, G., Semet, F., 1997. Solving an
ambulance location model by tabu search. Location
Science 5, 75–88.
Goldberg, J., Dietrich, R., Chen, J. M., Mitwasi, M.,
Valenzuela, T., Criss, E., 1990a. A simulation model
for evaluating a set of emergency vehicle base
locations: Development, validation, and usage. Socio-
Economic Planning Sciences 24, 125–141.
Goldberg, J., Dietrich, R., Ming Chen, J., Mitwasi, M. G.,
Valenzuela, T., Criss, E., 1990b. Validating and
applying a model for locating emergency medical
vehicles in Tuczon, AZ. European Journal of
Operational Research 49, 308–324.
Gunes, E., Szechtman, R., 2005. A simulation model of a
helicopter ambulance service, in: Proceedings of the
2005 Winter Simulation Conference.
Harewood, S. I., 2002. Emergency ambulance deployment
in Barbados: a multi-objective approach. Journal of the
Operational Research Society 53, 185–192.
Henderson, S. G., Mason, A. J., 2005. Ambulance Service
Planning: Simulation and Data Visualisation, in:
Brandeau, M.L., Sainfort, F., Pierskalla, W.P. (Eds.),
Operations Research and Health Care. Kluwer
Academic Publishers, Boston, pp. 77–102.
Hogan, K., ReVelle, C., 1986. Concepts and Applications
of Backup Coverage. Management Science 32, 1434–
1444.
Inakawa, K., Furuta, T., Suzuki, A., 2010. Effect of
Ambulance Station Locations and Number of
Ambulances to the Quality of the Emergency Service,
in: The 9th International Symposium on Operations
Research and Its Applications (ISORA’10). Chengdu-
Jiuzhaigou, China, pp. 340–347.
Ingolfsson, A., Erkut, E., Budge, S., 2003. Simulation of
single start station for Edmonton EMS. The Journal of
the Operational Research Society 54, 736–746.
Kelton, W. D., Sadowski, R. P., Sturrock, D. T., 2008.
Simulation with Arena, 4th edition. ed. McGraw-Hill,
New York, NY, USA.
Koch, O., Weigl, H., 2003. Modeling ambulance service
of the Austrian Red Cross, in: Proceedings of the 2003
Winter Simulation Conference. S. Chick, P. J.
Sánchez, D. Ferrin, and D. J. Morrice, eds, pp. 1701 –
1706.
Larson, R. C., 1974. A hypercube queuing model for
facility location and redistricting in urban emergency
services. Computers & Operations Research 1, 67–95.
Lee, T., Cho, S.-H., Jang, H., Turner, J. G., 2012. A
simulation-based iterative method for a trauma center:
air ambulance location problem, in: Proceedings of the
2012 Winter Simulation Conference. . C. Laroque, J.
Himmelspach, R. Pasupathy, O. Rose, and A.M.
Uhrmacher.
Liu, M. S., Lee, J. T., 1988. A Simulation Of A Hospital
Emergency Call System Using SLAMII. Simulation
51, 216–221.
Lubicz, M., Mielczarek, B., 1987. Simulation modelling of
emergency medical services. European Journal of
Operational Research 29, 178–185.
Marianov, V., Revelle, C., 1994. The queuing probabilistic
location set covering problem and some extensions.
Socio-Economic Planning Sciences 28, 167–178.
Peleg, K., Pliskin, J. S., 2004. A geographic information
system simulation model of EMS: reducing ambulance
response time. The American Journal of Emergency
Medicine 22, 164–170.
Repede, J. F., Bernardo, J. J., 1994. Developing and
validating a decision support system for locating
emergency medical vehicles in Louisville, Kentucky.
European Journal of Operational Research 75, 567–
581.
ReVelle, C., Hogan, K., 1989. The Maximum Availability
Location Problem. Transportation Science 23, 192–
200.
ReVelle, C. S., Marianov, V., 1991. A probabilistic
FLEET model with individual reliability requirements.
European Journal of Operational Research 53, 93–105.
Savas, E. S., 1969. Simulation and Cost-Effectiveness
Analysis of New York’s Emergency Ambulance
Service. Management Science 15, 608–627.
Silva, P. M. S., Pinto, L. R., 2010. Emergency medical
systems analysis by simulation and optimization, in:
Proceedings of the 2010 Winter Simulation
Conference. B. Johansson, S. Jain, J. Montoya-Torres,
J. Hugan, and E. Yücesan, eds, pp. 2422 –2432.
Su, S., Shih, C. L., 2003. Modeling an emergency medical
services system using computer simulation. Int J Med
Inform 72, 57–72.
Toregas, C., Swain, R., ReVelle, C., Bergman, L., 1971.
The Location of Emergency Service Facilities.
Operations Research 19, 1363–1373.
Uyeno, D. H., Seeberg, C., 1984. A practical methodology
for ambulance location. Simulation 43, 79–87.
EmergencyAmbulanceDeploymentinVal-de-MarneDepartment-ASimulation-basedIterativeApproach
575

Van Buuren, M., van der Mei, R., Aardal, K., Post, H.,
2012. Evaluating dynamic dispatch strategies for
emergency medical services: TIFAR simulation tool,
in: Proceedings of the 2012 Winter Simulation
Conference. C. Laroque, J. Himmelspach, R.
Pasupathy, O. Rose, and A.M. Uhrmacher, pp. 46:1–
46:11.
Vukmir, R. B., 2006. Survival from prehospital cardiac
arrest is critically dependent upon response time.
Resuscitation 69, 229–234.
Wang, Y., Luangkesorn, K. L., Shuman, L., 2012.
Modeling emergency medical response to a mass
casualty incident using agent based simulation. Socio-
Economic Planning Sciences 46, 281–290.
Wears, R. L., Winton, C. N., 1993. Simulation modeling
of prehospital trauma care, in: Proceedings of the 1993
Winter Simulation Conference. G.W. Evans, M.
Mollaghasemi, E.C. Russel, W.E. Biles.
White, R., Asplin, B., Bugliosi, T., Hankins, D., 1996.
High Discharge Survival Rate After Out-of-Hospital
Ventricular Fibrillation With Rapid Defibrillation by
Police and Paramedics. Annals of Emergency
Medicine 28, 480–485.
SIMULTECH2013-3rdInternationalConferenceonSimulationandModelingMethodologies,Technologiesand
Applications
576
