
Policy Design, Eco-innovation and Industrial Dynamics
in an Agent-Based Model
An Illustration with the REACH Regulation
Nabila Arfaoui
1
, Eric Brouillat
2
and Maider Saint Jean
2
1
GREDEG, University of Nice Sophia Antipolis,250 rue Albert Einstein, Valbonne, France
2
GREThA, University of Bordeaux, Avenue Leon Duguit, Pessac, France
Keywords: ABM, Policy Design, Eco-innovation, REACH.
Abstract: The paper proposes an agent-based model to study the impact of European regulation REACH on industrial
dynamics. This new regulation adopted in 2007 establishes a new philosophy in how to design
environmental protection and health. For this reason, REACH appears as a privileged object of study to
analyze the impact of regulation on innovation strategies of firms and the market structure. Our model
focuses on the interactions between clients and suppliers in order to take into account interdependencies at
the heart of vertical relationships that are upset by the new principles introduced by REACH. The main
contribution of this paper is to show, through an agent-based model, how different combinations of flexible
and stringent instruments designed on REACH regulation (Extended Producer Responsibility, authorization
process and restrictions) create the incentives and the constraints to shape market selection and innovation.
1 INTRODUCTION
In 2006, after a long ‘legislative battle', the
European Union (EU) adopted the REACH
Regulation (Registration, Evaluation and
Authorization of Chemicals) one of the most
ambitious stringent regulation. This regulation
introduces a new legislative philosophy in how to
handle chemicals. Firstly, REACH adopts the
“principle of reversal of the burden of proof” from
authorities to industry. This principle postulates that
manufacturers and importers of chemicals must
register each substance used in a quantity higher
than one tone per year, and assess the health and
environmental risks associated; otherwise they will
be automatically excluded from the market ("No
data, no market"). Secondly, REACH extends
responsibility also to users, since they are now
responsible for the compliance of their production
factors to the requirements of the new regulation.
The downstream user is closely associated with
regulatory compliance, by actively supporting the
efforts of producers of substances. REACH does not
apply only to the chemical industry but concerns all
the industries. Lastly, a revolutionary aspect of
chemicals regulation under REACH lies in a process
of authorization and restriction to the most
dangerous substances. Public authorization is
required for the production and use of chemicals
considered to be especially worrisome: so-called
substances of very high concern (SVHC) "with the
aim of substituting them". SVHC are to be gradually
identified and once included in the Annex, they
cannot be placed on the market or used after a date
to be set (the so-called "sunset date") unless the
company is granted an authorization. All request of
authorization must be accompanied by a safety
report and an analysis of alternatives. Thus, with the
REACH Regulation, the precautionary principle is
complemented by a substitution principle.
From the start, REACH has been designed to
balance environmental objectives with
competitiveness aims, and has the scope to induce
the development and adoption of eco-innovation as a
side-effect of the regulation itself. Eco-innovation
can be defined as “the production, assimilation or
exploitation of a product, production process,
service or management or business methods that is
novel to the organization (developing or adopting it)
and which results, throughout its life cycle, in a
reduction of environmental risk, pollution and other
negative impacts of resources use (including energy
517
Arfaoui N., Brouillat E. and Saint Jean M..
Policy Design, Eco-innovation and Industrial Dynamics in an Agent-Based Model - An Illustration with the REACH Regulation.
DOI: 10.5220/0004623705170528
In Proceedings of the 3rd International Conference on Simulation and Modeling Methodologies, Technologies and Applications (MSCCEC-2013), pages
517-528
ISBN: 978-989-8565-69-3
Copyright
c
2013 SCITEPRESS (Science and Technology Publications, Lda.)

use) compared to relevant alternatives” (MEI
Report, 2007). In the economic literature, many
authors have emphasized a positive correlation
between innovation and environmental regulation
(cf. EEA, 2011, for an overview). However, eco-
innovations cannot be considered to be a systematic
response to regulation. Policy design turns to be
essential in inducing the development of eco-
innovations (Ashford et al., 1985); (Hahn, 1989);
(Johnstone, 2007); (Jänicke, 2008). In this respect, a
number of criteria such as stringency, flexibility,
timing and credibility are important factors to
consider. REACH seems to fit perfectly in this
context and appears as a privileged object of study to
analyze how policy design can stimulate or allow
eco-innovation.
This paper tries to model the key principles and
mechanisms on which REACH relies on in an agent-
based model. We try to show how different
combinations of flexible and stringent instruments
designed on REACH regulation (such as derived
from the Extended Producer Responsibility principle
and from the approval process and restrictions)
create the incentives and the constraints to shape
market selection and innovation. In particular, the
model is intended to assess in which extent
increased obligations on SVHC through
authorization provisions may lead to increased
moves towards the substitution of those substances
through the supply chain.
The paper is organized as follows. Section 2
draws on the literature on eco-innovation to
underline the importance of policy design in
inducing the development of eco-innovation. In this
perspective, we bring into light the main
mechanisms of the REACH regulation that can
stimulate innovation and substitution of chemical
substances. Section 3 presents the model following
the ODD (Overview, Design concepts, Details)
protocol (Grimm et al., 2006), (Grimm et al., 2010).
Such a protocol provides a standard procedure for
describing Agent-Based Models (ABMs) in order to
make them easier to analyze, understand and
communicate. Section 4 presents the baseline
simulations and examines the impact of regulation
upon the market dynamics by considering various
configurations in the policy design, especially
through the flexibility and the stringency variables.
Section 5 concludes.
2 ENVIRONMENTAL
REGULATION AND
INNOVATION
Theoretical and empirical analyses on the
relationship between environmental regulation and
innovation agree that eco-innovations are essentially
“policy-driven” (Jänicke, 2008). Policy design turns
to be essential, especially to spur eco-innovation.
2.1 Policy Design
We know from Porter and van der Linde (1995) that
« properly designed environmental standards can
trigger innovation that may partially or more than
offset the costs of complying with them » in some
instances (p.98). Porter argues that more stringent
environmental policies will lead to innovations to
reduce inefficiencies, and this, in turn, will
eventually reduce costs. This process may take some
time. Thus, only well-designed regulations lead to
innovation. In particular flexible regulatory policies
give firms greater incentives to innovate and thus are
better than prescriptive forms of regulation. In many
instances, these innovations are likely to more than
offset the cost of regulation.
According to Ashford et al. (1985) and Hahn
(1989), regulators must be careful to the severity, the
flexibility and the timing of the regulation. Policy
design is essential in inducing the development of
eco-innovations (Jänicke, 2008). The policy design
should in particular be based on ambitious and
reliable targets; and provide a flexible policy mix
supporting the innovation process from invention to
diffusion.
In the way REACH has been designed, the
European Commission was very attentive to these
criteria. A combination of hard and soft law has
been preferred such that REACH relies more on
open-ended standards (Fuchs, 2011) that combine
different criteria: stringent, reachable and flexible.
As a matter of fact, the consequences of an incorrect
application of the REACH Regulation are serious
and immediate as they result in exclusion from
market "No data, no market”. Moreover, Fuchs
(2011) describes REACH as a pragmatic regulation
which is both ambitious and realistic in his goals in
order to represent real incentive to undertake
innovation. Pragmatism lies also in other provisions
such as the multiple deadlines for phase-in
substances, the collective setting of priorities under
the authorization and restriction processes, the
various exemptions incorporated in the regulation, or
SIMULTECH2013-3rdInternationalConferenceonSimulationandModelingMethodologies,Technologiesand
Applications
518

the limited risk assessment requirements for
substances placed on the market in proportions of
less than 10 tones. Lastly, flexibility is present
through open-ended standards, flexible and revisable
guidelines, and other forms of “soft law”. It was
important that the system remain flexible in order to
ensure its workability (Fuchs, 2011). Moreover,
REACH promotes a mode of governance based on
the idea of "self-responsibility". This approach
involves giving more responsibilities to companies
and more flexibility on how to achieve the goals
(Fuchs, 2011). In total, these mechanisms can adapt
to diversity, tolerate alternative approaches to
problem-solving, and make it easier to revise
strategies and standards in light of evolving
knowledge (Scott and Trubek, 2002).
2.2 The Effect of REACH
on Innovation
REACH has been designed to enhance innovation.
For Nordbeck and Faust (2003), innovation is "the
most important advantage of the REACH
regulation". It is possible to modify the
technological trajectory in the chemical industry and
increase innovation towards sustainable
development. According to Eurostat (2009), a
number of innovation-friendly mechanisms in the
chemical industry are present in REACH. In our
model, we mainly focus on two crucial mechanisms
that can promote innovation in the chemical
industry: the authorization process and the extended
responsibility principle.
The authorization procedure for substances of
very high concern is connected to the principle of
substitution. The purpose of the authorization is to
ensure that the risks from substances of very high
concern are properly controlled and that these
substances are progressively replaced by other
substances or technologies where these are
economically and technically viable. The
authorization procedure is based on several steps:
identification of substances; request for
authorization before the sunset date; granting or
refusing authorization; review of authorization.
Substances eligible for authorization are
identified by a Member State or the European
Commission and are included in a list of substances
of concern “substances of very high concern”
(SVHC) listed in Annex XIV. Once included in that
Annex, every firm willing to use such a substance
must request for authorization before the “sunset
date”. Thus, SVHC cannot be placed on the market
or used after the “sunset date” unless the company is
granted an authorization.
The granting or refusal of authorization is
primarily based on the existence of economically
and technically viable alternatives. So, in the event
that there are economically viable alternatives,
companies will no longer be allowed to use
substances after the sunset date. However if there are
no technically and economically viable alternatives,
authorizations are granted only if firms prove that
they carry out serious analyses of alternatives. In
fact, under Article 5 of the regulation, all request of
authorization must be accompanied by a safety
report and an analysis of alternatives with
information about activities of Research and
Development (R&D). In that case, authorizations are
granted until a specific date by which the holder of
the authorization will have to resubmit an
application. Review dates are set on a case by case
basis and are driven by the information provided by
the applicant, in particular the substitution plan and
the analysis of alternatives. To renew an
authorization, a revised report must be sent to ECHA
(the European Chemicals Agency) before the expiry
date of the time-limited review period defined in
the authorization decision. Meanwhile, the
authorization may be reviewed or suspended by the
Commission at any time, if information regarding
possible replacement substances becomes available
or the circumstances of the authorization have
changed. So firms are encouraged to maintain
technology watch on alternatives. We see that the
process of authorization is characterized by different
time variables that combine stringency (the sunset
date) and flexibility (review date), but also
pragmatism (cost-benefit analysis) in order to
support the innovation process from invention to
diffusion.
The second innovation-friendly mechanism
present in REACH lies in the extended
responsibility to users since they are now
responsible for the compliance of their factors of
production to the requirements of the new
regulation. According to Wolf and Delgado (2003),
innovation in the chemical industry is influenced by
many factors, including the demand and supplier-
client relationships. By extending the principle of
responsibility, the aim of REACH is to place the
environmental impact of the activity throughout the
production chain, and to change the demand of
downstream users towards environmentally
friendlier products. The extension of the principle of
responsibility is accompanied by the obligation to
communicate in the supply chain. According to the
Eurostat report (2009), many companies state a
PolicyDesign,Eco-innovationandIndustrialDynamicsinanAgent-BasedModel-AnIllustrationwiththeREACH
Regulation
519

positive impact on innovation of that
communication. “The communication in the supply
chain provides chemical companies with new
information about customers and their needs”. This
illustrates the importance of information in the
innovation process as well as the need for
coordination and collective action to spur
innovation.
Since the introduction of REACH, organic
solvents are subject to the authorization procedure
which requires producers to develop and adopt
alternatives. Bio-solvents are good candidates to
replace organic solvents since they are less toxic,
have lower VOCs emissions and are biodegradable
(IRSST, 2010). Because of the extended producer
responsibility, downstream users are now induced to
change their preferences and to transmit their needs
to suppliers regarding product quality constraints
that must be achieved with alternative solvents.
REACH can thus involve innovation in the product
chain favored by a partnership and a support from
users in the experimentation stage of the new
processes for the concerned applications. We argue
that our ABM model can enable to illustrate how
REACH can stimulate the development and
adoption of alternatives to organic solvents.
3 THE MODEL
In this section, we present the model we have used
to analyse the impact of REACH upon innovation.
3.1 ABMs and the ODD Protocol
REACH aims at “ensuring a high level of protection
of human health and the environment while
enhancing innovation and competitiveness”. In order
to investigate such a relationship, we use an agent-
based model (ABM) because simulation models
provide a powerful tool for exploring such complex
systems as innovation and industrial dynamics.
ABM is used to deal with complex systems made up
of autonomous entities. It allows modeling the
behavior of heterogeneous agents, technological
diversity and the change in selection environment
that result from policy measures.
The objective is to study how system level
properties emerge from the adaptive behavior of
individuals as well as how, in turn, the system
affects individuals. This model is used as a learning
tool, and is not intended for accurate prediction. It
aims to provide insights about the directional effect
of instruments underlying the authorization
procedure of REACH on firms' innovation strategy
and the associated shift to alternative substances.
In order to present the model we have built, we
use the ODD protocol (Grimm et al., 2006, 2010).
The ODD protocol provides a standard protocol for
describing ABMs in order to make them easier to
analyze, understand and communicate. The protocol
consists in structuring the information about an
ABM in the same sequence: Overview, Design
concepts and Details (cf. Table 1). The logic behind
the ODD sequence is to first provide context and
general information, followed by more strategic
considerations, and finally more technical details.
Such a sequence allows the reader to easily absorb
information in a progressive way.
Table 1: The three blocks of the ODD protocol.
Overview
Purpose
State variables and scales
Process overview and scheduling
Design concepts Design concepts
Details
Initialization
Input
Submodels
3.2 Description of the Model
We follow the sequence given in Table 1.
3.2.1 Purpose
The purpose of our model is to understand how
different configurations in the policy design of
REACH affect the dynamics of eco-innovation and
shape market selection and innovation.
In our model we take into account the supplier-
user interactions since they represent an essential
element in the development of new technologies,
particularly in the chemical industry. Technological
progress is driven by an endogenous stochastic
innovation process relying on firms' R&D strategies.
We illustrate the competition between organic
solvents and biosolvents in the surface treatment
activity. The objective is to examine in which extent
different combinations of flexible and stringent
instruments of the REACH regulation can lead to
develop and diffuse alternative solvents
(biosolvents).
3.2.2 State Variables and Scales
The model comprises eight low-level entities:
supplier, client, two types of product (Technology 1
and Technology 2), and four product characteristics
SIMULTECH2013-3rdInternationalConferenceonSimulationandModelingMethodologies,Technologiesand
Applications
520

(technological performance, production cost, VOCs
emissions and biodegradability).
Suppliers produce and sell products (technology
1 and/or technology 2). They are mainly
characterized by the state variables: identity number
and identity of the technology portfolio. Suppliers
which do not perform well and do not have enough
budget will exit the market; they are automatically
replaced by new entrants. These new entrants are
characterized by the same state variables as the
suppliers. Clients buy and use one type of product
(technology 1 or technology 2) in their production
processes. They are characterized by the state
variables: identity number, identity of the product
they have bought, preferences, requirement
thresholds, reservation price and minimum product
quality.
There are two types of product-related
technology that may co-exist: T1 (e.g. organic
solvents) and T2 (e.g. biosolvents). Technology 1 is
characterized by an identity number and technology
2 is characterized by an identity number and initial
switching costs. At the start of the simulation run,
only T1 exists and is developed by the suppliers.
Each product is described by four attributes in a
Lancaster way (1971): technical performance,
production cost, VOCs emissions, biodegradability.
Technical performance X
k
is related to the solvent
power and is measured by the Kauri butanol index
(Kb). A good solvent power is characterized by an
index of Kb greater than 100. Production costs Cost
k
depend on the raw materials that are used (petrol vs
biomass) but also on the production facility
(traditional refinery vs biorefinery). Emissions of
volatile organic compounds (VOCs), VOC
k,
represent those gases and vapors containing
chemical elements emitted by the solvent. VOCs are
emitted during the manufacture, storage or use of the
solvent. The volatility of these chemicals can have
serious consequences on health and the environment.
VOCs emissions are measured by the evaporation
rate in kilo Pascal. Biodegradability, Bio
k,
represents
the capacity of air emissions from solvents to
degrade readily and to have a short atmospheric
lifetime.
Each of these attributes is characterized by a
potential of evolution which can be exploited by
suppliers according to their R&D and innovation
activities. The potential of evolution takes into
account the difference in order of magnitude
between the best (biosolvent) and the worst solvent
(conventional solvent). Technical performance is
characterized by a maximum limit X
max
; production
cost is characterized by a minimum limit Cost
min
;
VOCs emissions are characterized by a minimum
limit VOC
min
and biodegradability is characterized
by a minimum limit Bio
max
. These outer limits are
assumed to be different depending on the technology
T1 or T2. In particular, the potential of improvement
regarding environmental characteristics is higher for
the green technology T2 than for the conventional
technology T1: Cov
min T2
< Cov
min T1
and Bio
min T2
<
Bio
min T1
. We also take into account the technology
difference between T1 and T2 in the initial values.
Since the green technology T2 is emergent
compared to the well-established T1, we assume that
T2 has a disadvantage in terms of techno-economic
characteristics such that production costs are higher
and technical performance is lower than T1.
3.2.3 Process Overview and Scheduling
In the model, one time step represents one period of
purchase and simulations are run for 200 periods.
Within each time step, six modules are processed in
the following order: purchase, budget, entry/exit,
technology portfolio, R&D watch/innovation, rebuy.
Purchase depends on the utility that a product,
given its four attributes, brings to a client provided
economic and technical constraints are first satisfied
(reserve price and minimum technical quality). Once
a product is selected by a client, the corresponding
supplier registers a sale.
Budget of each supplier takes into account the
R&D expenses and the profit derived from the sales.
Within the exit/entry module, each supplier with
a negative budget exits and is replaced by a new
firm so that a constant number of suppliers is
observed over the whole time period. Each new
entrant will be able to copy an installed firm with
more or less success (absorptive capacity).
Technology portfolio enables a supplier to adopt
T2 or not on the one hand and to keep or abandon
T1 on the other hand so that in the end the supplier’s
portfolio can be constituted by T1 and/or T2.
R&D watch and innovation allow suppliers to
improve the characteristics of their product. R&D
watch concerns only suppliers that have not yet
adopted T2 but are required (by regulation) to prove
they are searching for substitutes and thus
accumulate knowledge on T2. Innovation activities
may then involve improvements on T1 and/or T2
depending on the technology portfolio of each
supplier.
Rebuy allows each client to compare the
performance achieved by its current supplier with its
requirement levels. If the current supplier does not
under-performs, the client keeps the same supplier;
PolicyDesign,Eco-innovationandIndustrialDynamicsinanAgent-BasedModel-AnIllustrationwiththeREACH
Regulation
521

otherwise, the client switches to a new supplier and
selects one with the purchase module.
3.2.4 Design Concepts
Our model draws on basic principles developed by
the evolutionary theory of technological change
(Chiaromonte and Dosi, 1993); (Malerba et al.,
1999, among others). Thus, a strong emphasis is put
on dynamics, changing structures and disequilibrium
processes with an evolutionary perspective. We find
several design concepts common to ABMs in our
model.
According to the evolutionary approach,
bounded rationality characterizes economic agents
that have limited cognitive capacities to collect and
treat information. Suppliers seek for increased
market share thanks to innovation while users seek
for selecting the best product according to their
preference and requirement criteria. Individuals
cannot predict the future conditions they will
experience; they are myopic and their decisions
follow some routines and a satisficing principle
rather than a maximizing one. In our model,
suppliers make their decisions regarding technology
portfolio by considering specific thresholds that
reflect bounded rationality. Likewise, in the rebuy
module, clients compare the performance achieved
by their current supplier with their own requirement
threshold and decide to keep or leave the supplier.
The decision rules are adaptive which means the
agents adapt according to their performance and
their past experience. In our model, suppliers adapt
their R & D investment based on sales achieved in
the past, and customers adapt their requirement
levels according to suppliers’ performance.
Adaptation is thus modeled through the change in
threshold levels used in the decisions of agents.
Given that decision rules are agent-specific,
heterogeneity among individuals is a core aspect of
such an evolutionary theory. Interactions between
heterogeneous agents generate permanent diversity.
Industry dynamics emerge from the behavior of the
heterogeneous individuals.
Innovation is an endogenous and uncertain
process. Indeed, firms cannot know with certainty
the results of their R&D activity. That is why we
model a stochastic process of innovation. Other
stochastic processes are included where behavioral
parameters are randomly drawn. Like the innovation
process, the accumulation of knowledge that results
from technology watch on T2 is stochastic. Lastly,
the selection of a supplier by a client is also based on
a purchase probability (reflecting errors or imperfect
information).
Regarding innovation, a distinction is implicitly
made between incremental and radical innovation.
Incremental innovation allows small changes
whereas radical innovation leads to a technological
jump with significant cost and experience effects. In
our model, the adoption of T2 brings radical changes
that are materialized by high switching costs.
3.2.5 Initialization
At the start of a simulation run, the number of
suppliers is 10 and the number of users is 200. Some
initial values of the state variables are chosen
randomly in a range of parameters. Others are scale
parameters which have been set to plausibly
calibrate the model.
For product characteristics (VOCs emissions,
biodegradability, costs and technological
performance), initial values are based on data to
account for the difference in order of magnitude
between organic solvent and biosolvent (IRSST,
2010).
3.2.6 Input Data
The model does not use input data to represent time-
varying processes.
3.2.7 Submodels
Here, we specify the equations and the assumptions
underlying them to better understand the modules
listed in process overview and scheduling (cf.
subsection 3.2.3).
Purchase: The demand for products is expressed as
a demand for specific product characteristics in the
Lancaster vein. The purchase probability is
proportional to the utility derived by each client
(j=1,…,200) from each product present on the
market (k=1,2). We consider the following utility
function:
,,
,,
,,
,,
,,
,
0,0.1
(1)
With ,,,, ∈
0,1
. So the purchase decision
depends on the performance achieved by each
supplier (i=1,…,10) on each characteristic and on
the client’s preferences with respect to the product
characteristics represented in the parameters a, b, c
and d. A, B, C and D are technical parameters only
used to avoid negative terms in the utility
calculation. u(0,0.1) is drawn from a uniform
distribution with values between 0 and 0.1. The
SIMULTECH2013-3rdInternationalConferenceonSimulationandModelingMethodologies,Technologiesand
Applications
522

parameter e can be interpreted as a bandwagon
effect (Leibenstein, 1950) reflecting imitation
behaviors. Indeed, there is information asymmetry
regarding suppliers’ performance. So clients refer to
the behavior of other customers buying similar
goods (Cowan et al, 1997). The clients use also the
market share of the firm (Ms) which reflects the
relative reputation of the supplier. The market share
as an indicator provides information on the quality
of the product observed by customers who have
already adopted.
Each client is also supposed to be limited by
economic and technical constraints. So we assume a
reserve price and a minimum technical performance
for each client. If one of these constraints is not
satisfied when selecting a product on the market, the
associated utility will be equal to zero.
The price P is deduced from the production cost
by applying a mark-up rate:
,,
1
,,
(2)
Where µ is a mark-up rate over production costs. For
simplicity, µ is supposed to be constant and identical
for every firm.
Budget: The budget B is determined by the residual
budget from the previous period, the profit and the
R&D expenses:
For typical suppliers:
,
,
,
,
(3)
For new T2 adopters:
,
,
,
,
,
(3’)
Where SC are the switching costs resulting from the
adoption of the radically new technology T2.
The profit is determined as follows:
,
,
,
(4)
Where
,
is the total number of products sold by
firm i; FC are the fixed costs which are supposed to
be identical for all the firms for simplicity reasons.
Entry/Exit Processes: Firms with a negative budget
B go bankrupt and disappear from the market. When
one firm exits the market, we assume that a new firm
enters so that the number of firms in the industry is
kept constant.
Entry occurs with a new firm imitating an
existing one. This choice is based on probabilities
proportional to the installed firms’ market shares.
The new firm copies the technology portfolio and
the product characteristics of the imitated firm. We
assume that the new firm has an absorptive capacity
which enables her to copy the attributes of the
imitated firm in a range of [0.8;1.2]. This allows the
new entrant to under-perform or inversely to over-
perform in comparison with the imitated firm.
The initial budget (B) and the initial fixed costs
(FC) of the new firm are set in the same way as for
the firms created at the start of a simulation run. The
knowledge stock (K) and the switching costs (SC) of
the new firm are function of the industry average.
Technology Portfolio: Every period, firms examine
the possibility to change their technology portfolio.
They compare an adoption index with a certain
threshold.
When T2 has not yet been adopted by anyone,
we have the following adoption index:
,
,
(5)
K stands for the knowledge stock cumulated on the
green technology T2 derived from the firm’s activity
of technological watch. φ is a parameter reflecting
the “first-mover advantage” i.e. the advantage
gained by the very first firm adopting T2.
When T2 has already been adopted, the
probability that a firm adopts the green technology
T2 depends on the following adoption index:
,
,
(5’)
Ms
T2
represents the total market share of the Green
technology T2. Thus the probability to adopt T2
depends positively on the stock of knowledge K
accumulated on T2 but also on how T2 has diffused
on the market.
The decision to adopt T2 follows a two steps
procedure. First, the firm compares its adoption
index with an adoption threshold under which the
firm will not adopt T2. If its adoption index is above
the threshold, then the second step determines if the
firm has a sufficient budget to bear the switching
costs related to the green technology.
For firms that decide to adopt the green
technology, they can continue to produce and sell
the conventional technology T1. They will have a
technology portfolio constituted of T1 and T2.
However firms can decide to abandon the
conventional technology and focus only on the
development of the green technology T2. Here we
assume that firms calculate the return on investments
of technology T1 and compare it with a certain
threshold. The return on investment is based on the
ratio:
,
,
,
,
(6)
The ratio turnover/R&D gives an indication of the
ability of the technology to recover one euro spent in
R&D in the total return. The lower the return on
PolicyDesign,Eco-innovationandIndustrialDynamicsinanAgent-BasedModel-AnIllustrationwiththeREACH
Regulation
523

investment of technology T1 compared to the
minimum threshold, the higher the likelihood to be
abandoned.
Innovation Process and Green Technological
Watch: At each period, every firm can improve the
product performance in their portfolio by carrying
out R&D and innovation activities.
Every firm will allocate a certain proportion of
its budget to R&D activities:
,
,
(7)
Then, each firm is assumed to split its global R&D
budget between both technologies T1 and T2:
1
,
,
(8)
2
,
1
,
(9)
Where
is the share of total R&D allocated to
R&D1 (technology T1).
For firms developing only the green technology
T2,
0. For firms developing both technologies
T1 and T2,
0.5. For firms developing only the
conventional technology T1,
0.5 since they
devote the other part to technological watch on the
green technology T2 (RDwatch).
R&D watch follows a stochastic process.
Success occurs if the following condition is
satisfied:
1
,
0,1
(10)
Where
is a scale parameter determining the
speed at which the level of the current R&D
expenditure allows knowledge accumulation and
2
,
represents R&D expenses allocated to
technology T2. u(0,1) is a uniform random value
selected between 0 and 1. The closer to 1, the more
difficult it is to satisfy the condition (10) with a
given R&D investment.
In case of success, new knowledge on T2 is
accumulated and the switching costs linked to the
potential adoption of T2 decrease.
,
,
0,1
,
(11)
,
,
0,1
(12)
Where
and
are scale parameters.
The innovation process is similar to the previous
procedure. Two steps are considered for each
product characteristic. First, the innovation
probability depends on the R&D investment
allocated to the technology. Success of innovation
depends on the following condition:
1
,,
0,1
(13)
Where
represents the speed of the innovation
process and
,,
the R&D expenses devoted by
firm i to product k at time t.
Then, in case of success, the outcome of innovation
needs to be calculated. For the different
characteristics, we have:
∆
,,
0,1
,,
(14)
∆
,,
0,1
,,
(15)
∆
,,
0,1
,,
(16)
∆
,,
0,1
,,
(17)
Where
,
,
are scale parameters;
u(0,1) is a uniform random value selected between 0
and 1 which reflects the efficiency of the R&D
activity and thus impacts the innovative outcome.
The last term of the equation represents the distance
to the technological frontier associated to each
product characteristic. By doing so, when the level
of a given product characteristic comes closer and
closer to the limit of what is achievable with the
considered product design, a given R&D
expenditure will achieve less and less further
progress (lower technological opportunities and
R&D decreasing returns).
Rebuy: each client j is assumed to use one single
product at the same time and to renew its purchase
every period. When renewing the product, the client
compares its minimum thresholds on each
characteristic with the performance actually
achieved by its current supplier. Requirement
thresholds change with the average performance in
the industry. For the technical performance criteria,
_
,,
_
,,
0,
,
_
,,
(18)
And so on for the other criteria (equations 19, 20 and
21). The parameters a, b, c and d represents the
client’s preferences for the considered characteristic;
is a scale parameter; for each product k, the
average performance of industry on each
characteristic is given by:
,
∑
,,
⁄
;
,
∑
,,
⁄
;
,
∑
,,
⁄
;
,
∑
,,
⁄
If one of the minimum thresholds is not met (i.e. is
below the current supplier’s performance), then the
client leaves the current supplier and chooses
another one through the purchase procedure.
4 RESULTS
Before presenting the results of our simulations, we
SIMULTECH2013-3rdInternationalConferenceonSimulationandModelingMethodologies,Technologiesand
Applications
524

first expose the simulation protocol we have
followed
4.1 The Experimental Protocol
Results are analyzed through specific indicators and
are based on a high number of simulations in order
to deal with stochastic processes.
4.1.1 Main Indicators Characterizing
the Industrial Dynamics
The following indicators are used to exhibit the main
characteristics of the industrial dynamics:
The inverse Herfindahl-Hirshman index of
concentration (1/HHI with HHI the sum of the
squares of the firms’ market shares), which value
is comprised between 1 (monopoly) and N
(atomicity). The higher invHHI the higher the
degree of competition and inversely;
The number of failures, which takes into account
the number of exiting firms in each period. In our
model, the higher the number of failures, the
higher the number of new entrants that come and
replace the exiting firms;
The respective market share of technology T1 and
technology T2;
A global environmental indicator which traces
back the stock of VOCs emissions at the industry
level. We consider the following equation:
,
,
(22)
Where ABS stands for the assimilative capacity of an
ecosystem receiving pollution (VOCs emissions) at
each period. It is set exogenous and constant over
time. According to equation (22), the current stock
of VOCs emissions depends on the previous stock of
VOCS (the ‘history’ of pollution flows) less
assimilated emissions by the ecosystem plus the
current flow of emitted VOCs. Such a global
environmental indicator enables to grasp the ability
of the industry to decrease its VOCs emissions over
time. Such a decrease in VOCs can result from two
effects: a qualitative effect through innovation
(decrease in the VOC and/or Bio characteristics) and
a quantitative effect through lower market size in the
case where clients cannot afford the product (too
costly and/or too low quality).
4.1.2 The Baseline Simulations
and the Regulation Module
The baseline simulations serve as a benchmark to
study the effect of regulation upon industrial
dynamics. In order to cope with stochastic processes,
the results of our benchmark are drawn from a
battery of 500 simulations. For each indicator, the
average over 500 simulations is computed at
different time steps: 0, 50, 100, 150 and 200.
The regulation module includes the authorization
procedure and the extended responsibility principle.
The purpose of the authorization process is to
progressively replace substances of very high
concern by other substances or technologies where
these are economically and technically viable. Two
action leverages are considered in our model.
First, target-thresholds for techno-economic
performances of alternative solutions (X* and
Cost*) are incorporated. If technology T2 reaches
both thresholds of technical and economic
performance, then the public authorities can consider
the existence of viable solutions and can prohibit the
use of technology T1 after the sunset date. On the
contrary, if technology T2 does not reach the target
thresholds, the public authorities can consider that
there are no techno-economically viable alternatives.
In that case, authorizations are granted and firms can
use technology T1 after the sunset date, but only if
they prove that they carry out serious analyses of
alternatives providing information on their R & D
activity.
In our model, the budget allocated to R&D
watch on T2 is used to check whether a firm is
searching for new alternatives. Below a certain
threshold, authorization will not be granted. Above
the threshold, authorizations are granted for a period
and can be reviewed if “new information on
possible substitutes is available”. The threshold for
R&D watch depends on the average R&D watch
performed in the industry multiplied by a parameter
(
RDwatch
*) which value expresses the degree of
severity of regulation (the closer to 1 the stricter the
regulation, the closer to 0 the softer the regulation).
The timing of regulation is the second action
leverage for public authorities. Indeed an early
sunset date associated to close revision dates can be
considered to be strict. On the contrary a late sunset
date and distant revision dates impose softer
constraints. In order to take timing into account, we
assume that the probability to adopt technology T2
(equation 5’) is modified as follows:
,
,
1α
t
T
(5’’)
The meaning of T and thus its value depends on
whether it is the first time a deadline is given to
firms before public authorities check the existence of
suitable alternatives (in such a case, T=the sunset
date, T
sunset
) or if authorization has been granted and
PolicyDesign,Eco-innovationandIndustrialDynamicsinanAgent-BasedModel-AnIllustrationwiththeREACH
Regulation
525
subsequent checks will be carried out (in such a case
T=the revision date, T
revision
). α
i
R
is a parameter
reflecting the credibility that a firm i confers to
regulation (ranges between 0 and 1).
With equation (5’’), we thus assume that
regulation positively influences the adoption of the
green technology T2: the earlier and the closer to the
sunset date, the higher the adoption index; the more
frequent the revision of authorization the higher the
adoption index; the higher the credibility given to
regulation, the higher the adoption index.
By extending the responsibility principle,
REACH aims at changing the demand of
downstream users of chemical products towards less
toxic and harmful substances. In order to take into
account such a change in our model, we will now
consider that the technology portfolio hold by
suppliers matters in the clients’ decisions such that:
first, the utility of a product (equation 1) will tend to
decrease for suppliers which portfolio is only
constituted by technology T1; in that case the utility
is weighted by a factor
1α
where α
j
R
is a
parameter reflecting the credibility that a client j
gives to regulation (ranges between 0 and 1) and T
will represent alternatively the sunset date or the
revision date; second, the decision made by a client
to leave its current supplier will be subject to a
probability of defection based on
α
when
the supplier’s portfolio is only constituted by
technology T1. According to these changes, the
closer the sunset date or the revision date, the lesser
the weight given to suppliers holding a portfolio
with only technology T1 in the calculation of utility
(equation 1) in the purchase module but also in the
update of requirements in the rebuy module
(equations 20 and 21).
4.2 The Impact of Regulation upon
the Market Dynamics
In the following, we study two opposite
configurations (cf. Table 2), the “less stringent
scenario” and the “most stringent scenario”,
depending on the target-thresholds and on the timing
of regulation.
4.2.1 Initialization
The initial values for techno-economic performances
are chosen in relation with the size of the techno-
economic potential which can be covered by
innovators. In the low stringency configuration, 90%
of the potential must be covered while in the high
stringency configuration 10% needs to be covered.
Table 2: Policy variables in the REACH model.
Scenario
Policy variables
Less
stringent
Most
stringent
Target-
thresholds
Techno-eco
performances
High X* Low X*
Low Cost* High Cost*
R&D watch
R&Dwatch
*
close to 0
R&Dwatch
*
close to 1
Timing
Sunset date T
sunset
late T
sunset
early
Revision
date
T
revision
distant
T
revision
close
The mechanism is the following: at the sunset date,
if the average cost of T2 is below the corresponding
target-threshold and the average technical
performance of T2 is above the corresponding
target, then T1 is forbidden for every firm in the
industry. If not, the budget of R&D watch is checked
for each firm. If such a budget is below a certain
threshold, then T1 is forbidden for the considered
firm. If not, it is possible to continue developing T1
as if the authorization had been individually granted
until a certain period of time. At the revision date, a
similar sequential checking is made.
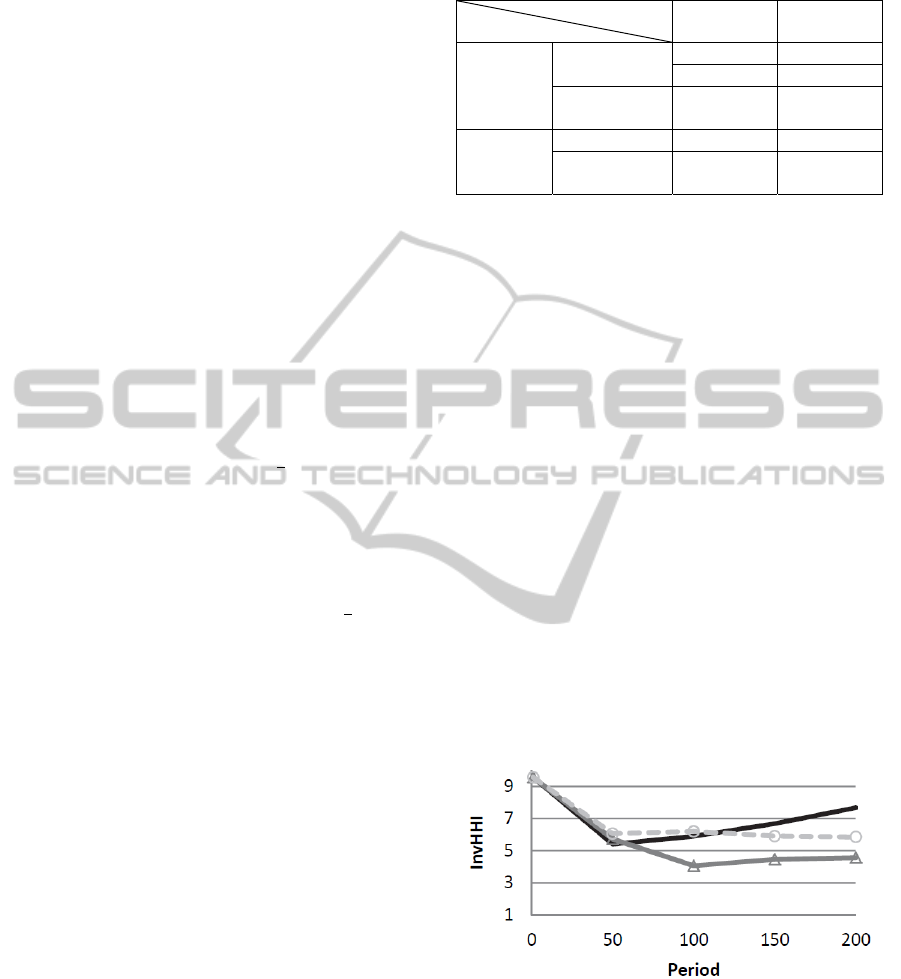
4.2.2 Main Results
The graphs below depict the evolution of each
indicator in the different cases: the benchmark
scenario (black line), the less stringent scenario
(grey dotted line) and the most stringent
scenario (grey full line).
Results show that regulation increases
industrial concentration all the more strongly
that regulation is more stringent (cf. Figure 2).
Figure 2: Evolution of the inverse HHI (average for 500
simulations).
Figure 3 shows that regulation helps technology T2
to take off and to increase its market share compared
to the benchmark scenario where T2 was doomed to
a niche (12% in average at t=200). However, only
the most stringent scenario allows domination of T2
due to an early ban of T1 (in t=50).
SIMULTECH2013-3rdInternationalConferenceonSimulationandModelingMethodologies,Technologiesand
Applications
526
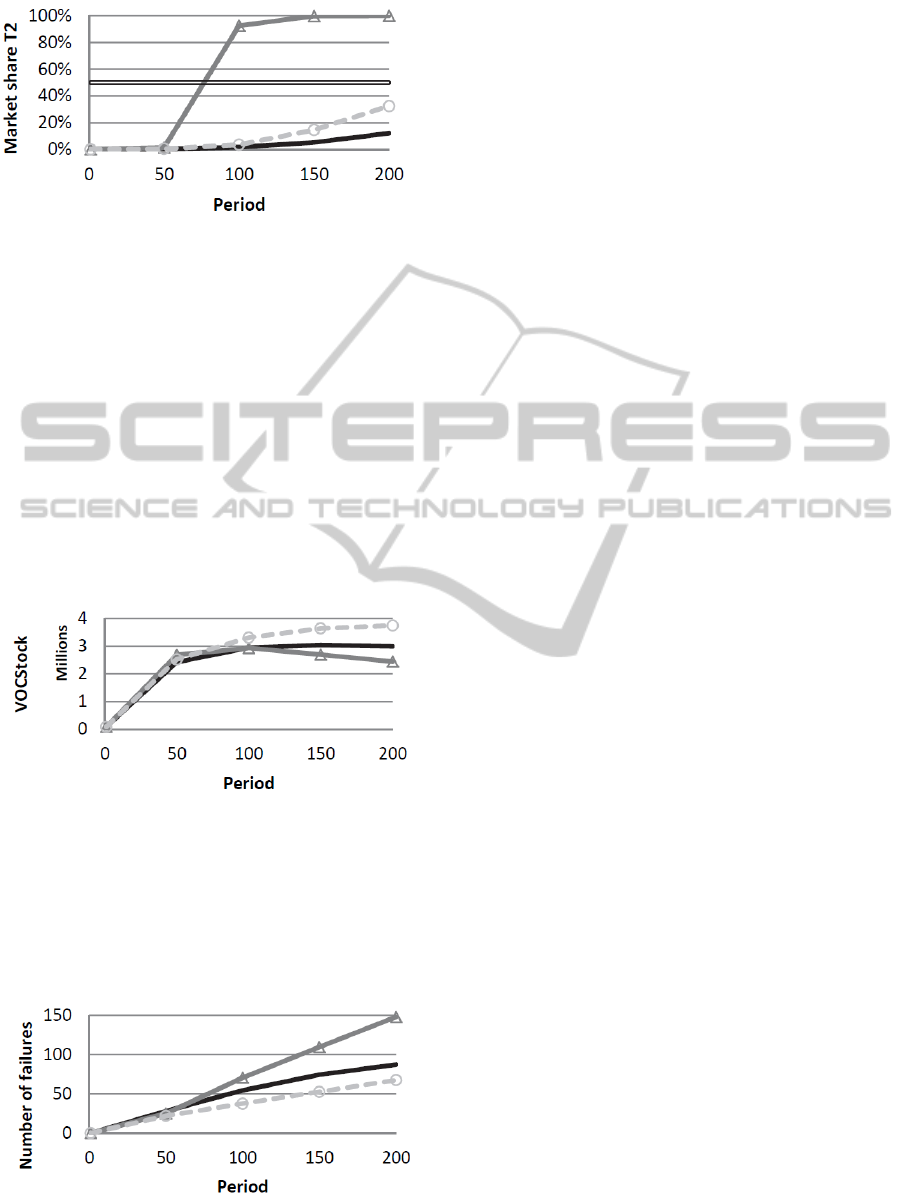
Figure 3: Evolution of market shares for T2 (average for
500 simulations).
As to the stock of VOCs, we observe a kind of
inverted U curve in the most stringent scenario as
VOCs emissions rise in a first place and then fall
with the advances of innovation and the diffusion of
T2 but also with a decrease in market size (cf. Figure
4). By contrast, the less stringent scenario exhibits
systematically higher levels of VOCs over time
compared to the benchmark. This is due to the fact
that firms specialised on T1 (and very efficient in
improving the product characteristics) are disturbed
by regulatory mechanisms during the whole time
period without yet experiencing complete
prohibition of T1.
Figure 4: Evolution of the global stock of VOCs (average
for 500 simulations).
In our model, failures result from a combination of
different effects: low sales (and thus insufficient
budget) and attachment of clients to their suppliers
(fidelity effect) that both prevail in the benchmark
scenario; forced exit due to not enough R&D watch
Figure 5: Evolution of failures (average for 500
simulations).
on T2 or to T1 ban when regulation is incorporated.
Results show that the number of failures due to this
combination of effects is much higher in the most
stringent scenario than in the benchmark while it is
lower in the less stringent scenario (cf. Figure 5).To
summarize, we see that the most stringent scenario
characterized by strict timing (early sunset date and
frequent revisions) and strict techno-economic
performances for alternative substances (low price-
quality ratio for T2) pushes radical environmental
innovation by allowing strong and early take-off of
technology T2 and prohibition of technology T1.
But being detrimental to incremental innovation on
T1, such a scenario leads to lower global
environmental performances (higher stock of VOCs)
in the short term. This illustrates the tension between
the short and the long term underlying the
development of radical environmental technologies.
5 CONCLUSIONS
This paper intends to contribute to a better
understanding of the relationship between policy
design and eco-innovation through an agent-based
model. Stringency, flexibility and timing of
regulation are crucial to spur eco-innovation. These
are key aspects to consider in the REACH
regulation, especially to foster the development of
alternative substances (like biosolvents) to replace
toxic and harmful substances (like organic solvents).
The ABM model we propose in this paper is
original in many aspects: evolutionary modeling of
innovation and industrial dynamics; vertical
interactions between suppliers and users; technology
portfolio; authorization procedure and extended
producer responsibility. The model is used as a
learning tool, and is not intended for accurate
prediction. It aims to provide insights about the
directional effect of instruments underlying the
authorization procedure of REACH on firms'
innovation strategy and the associated shift to
alternative substances.
ACKNOWLEDGEMENTS
The authors would like to thank the Regional
Council of Aquitaine for its financial support in the
ECOCHIM project.
PolicyDesign,Eco-innovationandIndustrialDynamicsinanAgent-BasedModel-AnIllustrationwiththeREACH
Regulation
527

REFERENCES
Ashford, N. A, Ayers, C., Stone, R., 1985. Using
regulation to change the market for innovation,
Harvard Environmental Law Review, 9 (2):419-66
Chiaromonte, F., Dosi, G., 1993. Heterogeneity,
competition and macroeconomic dynamics. Structural
Change and Economic Dynamics 4 (1), pp. 39-46
Cowan, R., Cowan, W., Swann, P., 1997. A model of
demand with interactions among consumers,
International Journal of Industrial Organization, vol.
15, n° 6, 711-732.
EEA Technical report, 2011. Environmental tax reform in
Europe: opportunities for eco-innovation. n°17,
Publications Office of the EU.
European Commission-DG Environment, 2007. Designing
environmental policy to be innovation friendly, Final
report CM International.
Eurostat, 2009. The REACH baseline study,
Methodologies and working papers, European
Commission.
Fuchs, O., 2011. REACH: A new paradigm for the
management of chemical risks, Health and
Environment Report n°4, IFRI.
Grimm, V., Berger, U., Bastiansen, F., Eliassen, S., Ginot,
V., Giske, J., Goss-Custard, J., Grand, T., Heinz, S.,
Huse, G., Huth, A., Jepsen, J.U., Jørgensen, C., Mooij,
W.M., Müller, B., Pe’er, G., Piou, C., Railsback, S.F.,
Robbins, A.M., Robbins, M.M., Rossmanith, E.,
Rüger, N., Strand, E., Souissi, S., Stillman, R.A.,
Vabø, R., Visser, U., DeAngelis, D.L., 2006. A
standard protocol for describing individual-based and
agent-based models. Ecological Modelling, 198, 115–
126.
Grimm, V., Berger U., DeAngelis D.L., Polhill J.G., Giske
J., Railsback S.F., 2010, The ODD protocol: A review
and first update, Ecological Modelling, 221, 2760-
2768.
Hahn, R.W., 1989. Economic prescriptions for
environmental problems: How the patient followed the
doctor’s orders, Journal of Economic Perspectives, 3
(2), 95-114.
IRSST, 2010. La substitution des solvants par les esters
méthyliques d’acides gras d’huiles végétales.
RAPPORT B-079.
Jänicke, M., 2008. The policy design of environmental
innovation and sustainable production, Portoroz,
Slovenia, 14-16 May.
Johnstone, N., 2007. Environmental Policy and Corporate
Behaviour, Edward Elgar.
Lancaster, K., 1971. Consumer demand: A new approach,
Columbia Studies in Economics, n°5 New York and
London, Columbia University Press.
Leibenstein, H., 1950. Bandwagon, Snob, and Veblen
effects in the theory of consumers’ demand, The
Quarterly Journal of Economics, vol.64, n°2, 183-207.
Malerba, F., Nelson, R., Orsenigo, L., Winter, S., 1999.
History-friendly models of industry evolution: the
computer industry, Industrial and Corporate Change 8
(1), pp. 3-40.
MEI Report, 2007, Measuring Eco-innovation, MEI
project, UM MERIT.
Nordbeck, R.; Faust, M., 2002. European chemical
regulation and its effect on innovation - An assessment
of the EU's White Paper on the strategy for a future
chemicals policy, Leipzig: UFZ Centre for
Environmental Research.
Porter, M., Van der Linde, C., 1995. Toward a New
Conception of the Environment-Competitiveness
Relationship, in Journal of Economic Perspectives 9,
pp. 97-118.
Scott, J., Trubek, D., 2002. Mind the Gap: Law and New
Approaches to Governance in the European Union,
European Law Journal, 2002, n° 1
Wolf, O., Delgado, L., 2003. The impact of REACH on
innovation in the chemical industry, EC-JRC, EUR
20999 EN.
SIMULTECH2013-3rdInternationalConferenceonSimulationandModelingMethodologies,Technologiesand
Applications
528
