
Carbon Dioxide Capture from Synthesis Gas Containing Steam
by Pressure Swing Adsorption at Mid-high Temperature
Cheng-tung Chou
1
*, Yu-Hau Shih
1
, Yu-Jie Huang
1
and Hong-sung Yang
2
1
Department of Chemical and Materials Engineering, National Central University, Jhong-Li, Taiwan
2
Center for General Education, Hwa-Hsia Institute of Technology, New Taipei City, Taiwan
Keywords: Pressure Swing Adsorption, CO
2
Capture, Synthesis Gas.
Abstract: Global warming has become more and more serious, which is caused by greenhouse gases. Therefore,
decreasing the emission of CO
2
has become an important research topic in the world. This study aimed to
utilize a pressure swing adsorption (PSA) process to capture CO
2
from synthesis gas, which is the effluent
stream of water-gas-shift reactor. The PSA process studied is a single-bed four-step process at mid-high
temperature using K
2
CO
3
-promoted hydrotalcite. The feed gas entering the PSA process consists of
27 % H
2
O, 5 % CO, 28 % CO
2
and 40 % H
2
. It uses the method of lines combined with upwind differences,
cubic spline approximation and LSODE of ODEPACK software to solve the equations. The optimal
operating condition is obtained by varying the operating variables, such as feed pressure, bed length, etc.
Furthermore,
single-bed four-step process could achieve 98.49% recovery of H
2
as the top product and
96.42% purity and 96.57% recovery of CO
2
as the bottom product.
1 INTRODUCTION
Carbon dioxide is considered to be one of the major
greenhouse gases that is directly influencing the
global climate changes. The United Nations
Intergovernmental Panel on Climate Change (IPCC)
has studied these problems and a general conclusion
has been achieved between researchers, industry
leaders, and politicians that dramatic reduction in
greenhouse gas emissions must be achieved in order
to stop climatic changes (IPCC, 2005); (Abu-Zahra
et al., 2009). So using coal more efficiently and
turning it into a clean energy source is an important
issue for the whole world. An integrated gasification
combined cycle (IGCC) is a potential electric power
technology that turns coal into synthesis gas, which
can be burned to generate power.
The CO composition in syngas reacts with steam
to generate CO
2
and H
2
via the water-gas-shift
reaction, CO + H
2
O→CO
2
+ H
2
. In this study,
pressure swing adsorption (PSA) is utilized to
capture CO
2
from the effluent stream of water-gas-
shift reaction at mid-high temperature, and the
purified H
2
can be sent to gas turbine for generating
electrical power or can be used for other energy
source.
This technology consists of gas adsorption at
high
pressure and desorption at low pressure to
produce high-purity products. Conventionally, PSA
is used to separate CO
2
and H
2
at ambient
temperature. For traditional physical adsorbent, such
as zeolite and activated carbon, the adsorbed amount
of CO
2
is too low to separate CO
2
/H
2
at mid-high
temperature. Because the outlet stream from water-
gas-shift reactor is already at nearly 400
o
C, in order
to avoid separating CO
2
and H
2
at ambient
temperature, and later raise the temperature of H
2
for
power generation, which will cause energy waste, in
this study PSA processes with K
2
CO
3
-promoted
hydrotalcite adsorbent are studied to capture CO
2
from the outlet stream of water-gas-shift reactor at
400
o
C. According to literature (Lee et al., 2007a),
K
2
CO
3
-promoted hydrotalcite is a chemisorbent that
adsorbs CO
2
at mid-high temperature and it does not
adsorb other gases, such as CO, H
2
and H
2
O. As
required by the U.S. Department of Energy, it is
important to be able to concentrate the captured CO
2
into >90 % concentration that is suitable for
underground storage.
The feed gas entering the PSA process consists
of CO, CO
2
,
H
2
and H
2
O according to National
Energy Technology Laboratory report (NETL,
2009).
Most PSA papers assume that steam is removed
before entering CO
2
-capture PSA process. In this
529
Chou C., Shih Y., Huang Y. and Yang H..
Carbon Dioxide Capture from Synthesis Gas Containing Steam by Pressure Swing Adsorption at Mid-high Temperature .
DOI: 10.5220/0004624705290536
In Proceedings of the 3rd International Conference on Simulation and Modeling Methodologies, Technologies and Applications (MSCCEC-2013), pages
529-536
ISBN: 978-989-8565-69-3
Copyright
c
2013 SCITEPRESS (Science and Technology Publications, Lda.)

study we intend to consider the steam composition
in feed gas into PSA process for real-case study.
2 METHODOLOGY
2.1 Mathematical Modelling
In the non-isothermal dynamic model, the following
assumptions are made:
1. The linear driving force model is used because
mass transfer resistance between the gas phase
and solid phase exists.
2. Only CO
2
is adsorbed in K
2
CO
3
-promoted
hydrotalcite.
3. The ideal gas law is applicable.
4. Adiabatic system.
5. Only axial concentration and temperature
gradient are considered.
6. The pressure drop along the bed can be neglected
due to large particle size.
These assumptions are used in the following
equations:
Overall mass balance:
(1)
Mass balance for component i:
(2)
Energy balance:
(3)
Linear driving force model:
*
i
L
DF i i
N
K
NN
t
(4)
The adiabatic system means that there is no heat
transfer between bed and surrounding so that h = 0
in Eq. (3).
Boundary conditions can be assumed as follows:
At the inlet end:
t,0
t
,
t,0
(5)
At the outlet end:
,
0 ,
,
0
(6)
The flow rates at the two ends of the bed are
estimated by using the valve equation recommended
by Fluid Controls Institute Inc.:
q
16.05
for P
2
> 0.53P
1
(7)
q
13.61
for P
2
≤ 0.53P
1
(8)
Twenty-one basic grid points are marked in the bed
to set up the initial concentration, initial temperature,
and initial pressure. The partial differential equations
are converted to ordinary differential equations by
the method of lines. The spatial derivatives of the
concentration and the gas temperature are evaluated
by upwind differences at every grid point. The cubic
spline approximation is used to estimate the flow
rates in the adsorptive bed. The concentration,
temperature, and adsorption quantity in the bed are
integrated with respect to time by LSODE of
ODEPACK software with a time step of 0.1s. The
simulation is stopped by using Eq. 9 when the
system reaches a cyclic steady state.
1
Y
lastcycle
Y
thiscycle
110
(9)
2.2 PSA Process
The PSA process studied is a single-bed four-step
process at mid-high temperature using K
2
CO
3
-
promoted hydrotalcite. The feed gas is from the
effluent stream in the water-gas-shift reactor which
is cited in the report of National Energy Technology
Laboratory (NETL, 2009). The feed gas entering the
PSA process consists of 27 % H
2
O, 5 % CO,
28% CO
2
and 40 % H
2
. The process is described as
follows: feed pressurization (I), high pressure
adsorption (II), cocurrent depressurization (III),
vacuum desorption (IV). During step (I), the bed
pressure increases from atmospheric pressure to high
pressure, and less-adsorbed products are produced.
Strongly adsorptive carbon dioxide is produced
during step (IV) when the bed pressure decreases
from high pressure to low pressure (0.1 atm). The
procedure of the sing-bed four-step process is shown
in Figure 1. The step time and the physical
parameters of adsorption bed are shown in Tables 1
and 2.
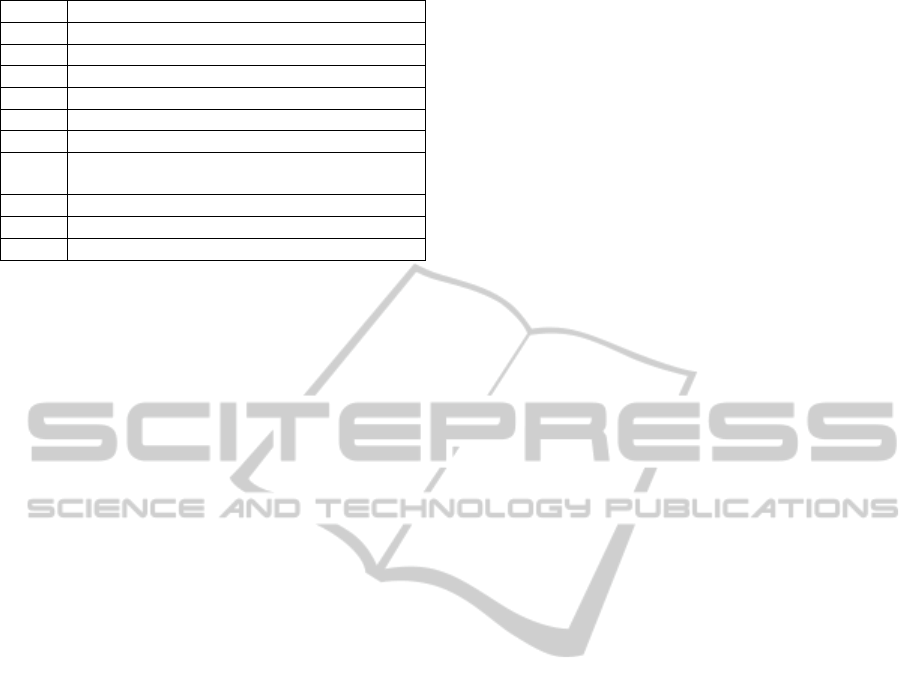
Table 1: Step time for single-bed four-step process.
(I) 10s
(II) 39s
(III) 10s
(IV) 39s
n
i
i
t
n
A
t
TP
R
A
z
q
1
)1(
,
(1 )
ax i i
iii
AD P y q
yyPn
A
A
zRTz z RtT t
2
2
1
ˆ
11
p
n
pipiisps
i
T
Ak C qT Dh T T
zz
A
T
CP ε AnCTH ε CA
Rt t t
SIMULTECH2013-3rdInternationalConferenceonSimulationandModelingMethodologies,Technologiesand
Applications
530
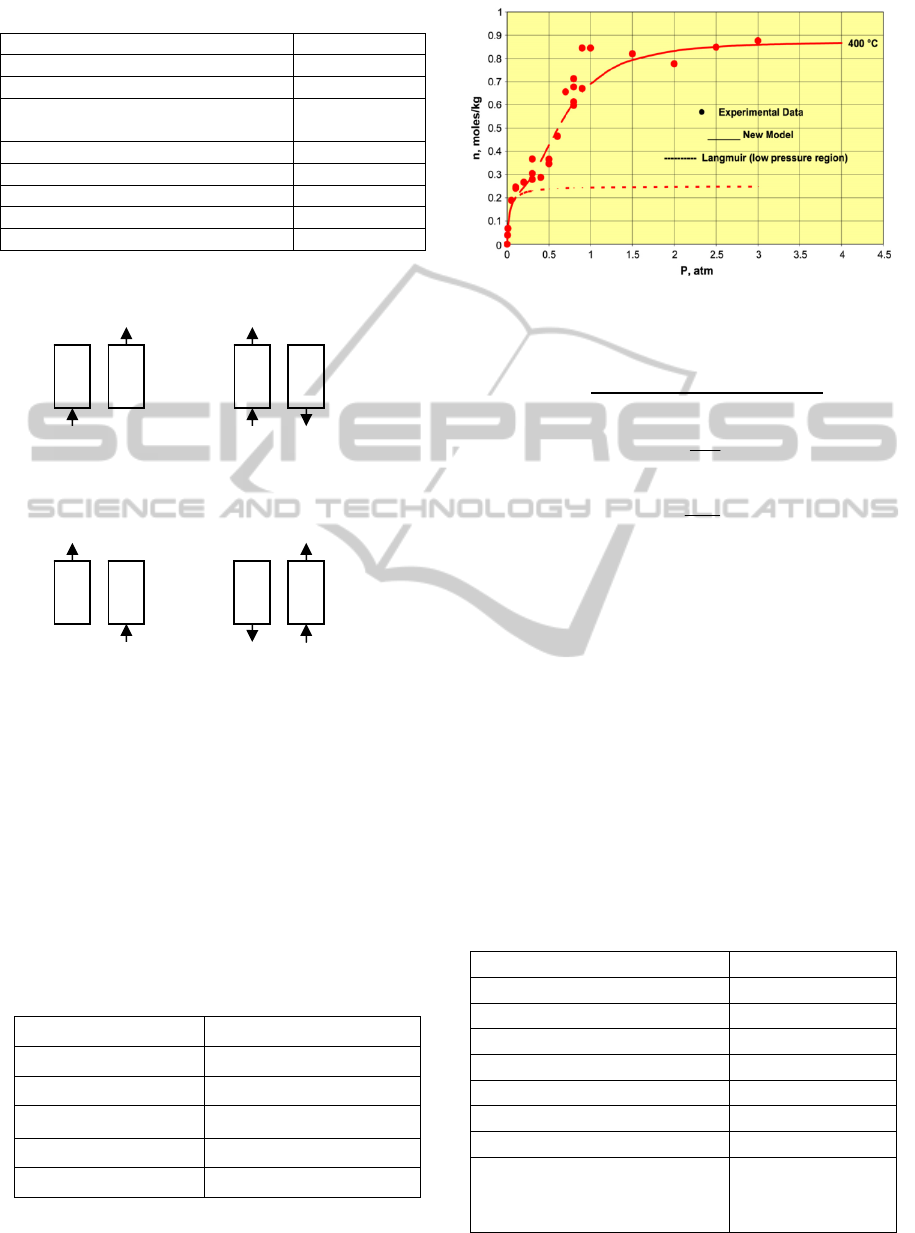
Table 2: Physical parameters of bed.
Bed length(cm) 100
Bed diameter(cm) 100
Bed volume(L) 784
Adsorbent density(g/cm
3
) 1.563
#
Adsorbent heat capacity(J/g.K) 0.85
#
Bed void 0.37
Operating temperature(K) 673.14
Feed pressure(atm) 25
Vacuum pressure(atm) 0.1
#
Ding and Alpay, 2000
Figure 1: Procedure of single-bed four-step PSA process
Isotherm of K
2
CO
3
-promoted hydrotalcite was
measured at 400
o
C in the pressure range of 0-3atm
by Lee et al. (2007a) and shown in Figure 2. The
figure also shows the best fit of the CO
2
chemisorption isotherms using the following
Eq. (10). The parameters of model for sorption of
CO
2
are given in Table 3.
Table 3: Parameters of model for sorption of CO
2
on
K
2
CO
3
-promoted hydrotalcite.
m(mole/kg) 0.25
a 2.5
q
c
(J/mole) 2.098*10
4
ΔH
R
(J/mole)
4.210*10
4
k
c
(atm
-1
) 37.4
k
R
(atm
-a
) 2.5
Figure 2: CO
2
chemisorption isotherm on K
2
CO
3
-
promoted hydrotalcite at 400 ◦C (Lee et al., 2007a).
∗
,
1
1
1
(10)
0 exp( )CC
cq
KK
RT
(11)
0 exp( )
R
RR
H
KK
RT
(12)
3 RESULTS AND DISCUSSION
3.1 Simulation Verification
The breakthrough curve studied by Lee et al. (2007a)
was used to verify the simulation program. Different
compositions of CO
2
+ N
2
mixtures were used as the
feed gas.The operating conditions used are given in
Table 4. The results are shown in Figures 3 and 4. It
shows that the simulation results are very close to
experiment data. Therefore, the simulation program
can be trusted.
Table 4: Operating parameters of breakthrough curve
simulation.
Operating pressure(atm) 1
Operating temperature(K) 673.14
Feed flow rate(L/min) 5.0*10
-3
Bed length(cm) 101.6
Bed diameter(cm) 1.73
Bed volume(L) 0.238
Bulk density(g/cm
3
) 0.82
Adsorption Time Constant (min
-1
) 3.0
Feed composition
(40% CO
2
, 60% N
2
)
(50% CO
2
, 50% N
2
)
(60% CO
2
, 40% N
2
)
Feed Feed
Feed
Feed
Step 1
Step 3
Step 2
Step 4
CO
2
CO
2
Less-adsorbed product
Less-adsorbed product
Less-adsorbed product
Less-adsorbed product
CarbonDioxideCapturefromSynthesisGasContainingSteambyPressureSwingAdsorptionatMid-highTemperature
531
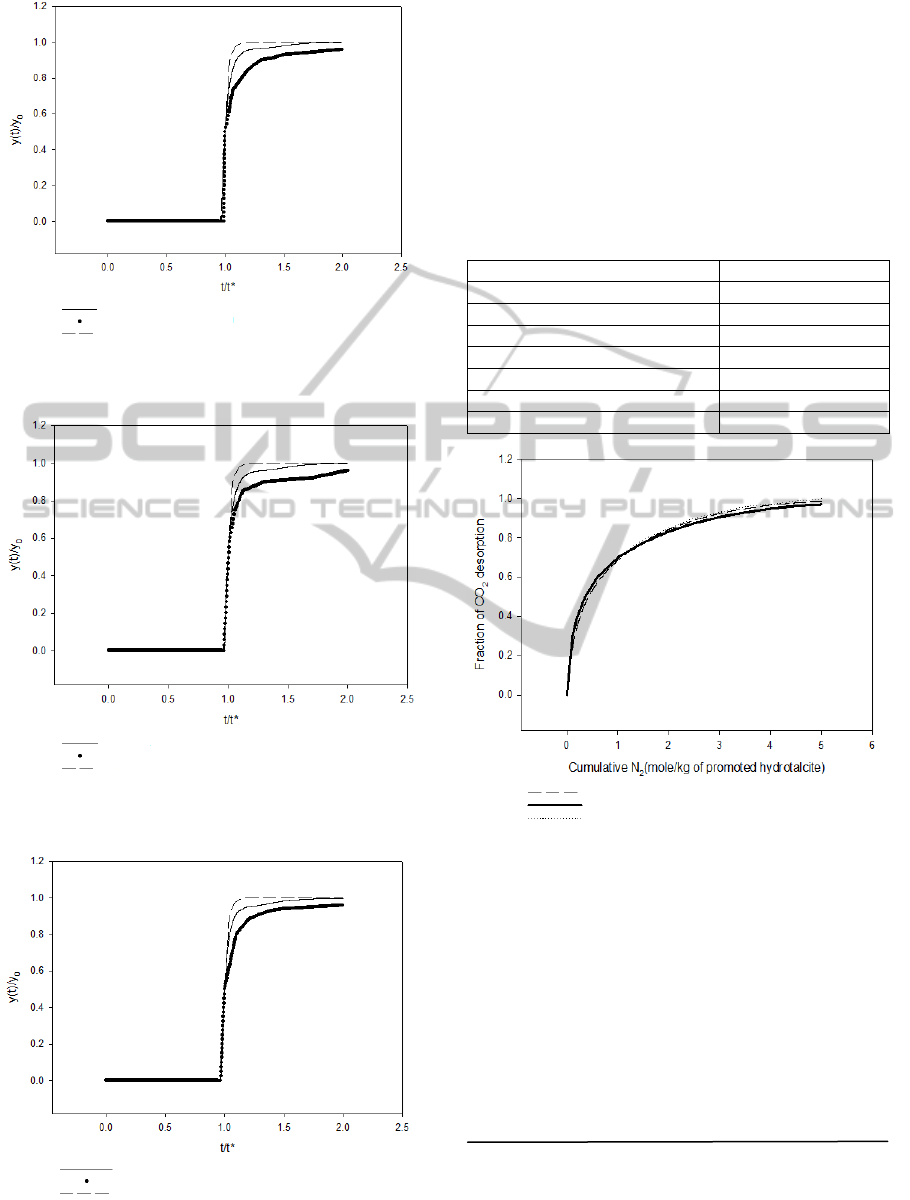
Figure 3: Simulation of breakthrough curve (inlet CO
2
mole fraction=0.4) .
Figure 4: Simulation of breakthrough curve (inlet CO
2
mole fraction=0.5).
Figure 5: Simulation of breakthrough curve (inlet CO
2
mole fraction=0.6).
The desorption curve studied by Lee et al. (2007b)
was also compared to our simulation. Figure 6
shows the column dynamic data (fraction of CO
2
desorbed as a function of inlet N
2
purge gas
quantity) for desorption of 40% CO
2
+N
2
by N
2
purge. The operating conditions used are given in
Table 5. The agreement between our simulation and
the experimental data is pretty good.
Table 5: Operating parameters of desorption curve
simulation.
Operating pressure(atm) 1
Operating temperature(K) 793.14
Feed flow rate(L/min) 6.667x10
-3
Bed length(cm) 100
Bed diameter(cm) 1.73
Bed volume(L) 0.23882
Bulk density(g/cm
3
) 0.82
Initial gas phase concentration 40%CO
2
/N
2
Figure 6: Simulation of desorption curve.
3.2 Single-Bed Four-step PSA Process
Simulation
In this study, the optimal operating conditions are
discussed by varying the operating variables, such as
feed pressure, bed length, vacuum pressure, feed
flow rate, high pressure adsorption time and vacuum
desorption time.
Definition of the recovery is:
Recovery =
product flow per cycle × product concentration feed
flow per cycle × feed concentration
3.2.1 Feed Pressure
All the operating variables such as vacuum pressure,
simulation (this study)
experimental data (Lee et al. 2007a)
simulation (Lee et al. 2007a)
simulation (this study)
experimental data (Lee et al. 2007a)
simulation (Lee et al. 2007a)
simulation (this study)
experimental data (Lee et al. 2007a)
simulation (Lee et al. 2007a)
simulation (this study)
experimental data (Lee et al. 2007b)
simulation (Lee et al. 2007b)
SIMULTECH2013-3rdInternationalConferenceonSimulationandModelingMethodologies,Technologiesand
Applications
532
bed length, feed rate and step time are fixed, except
for feed pressure. Because the amount of gas
adsorbed on K
2
CO
3
-promoted hydrotalcite increases
as feed pressure increases, the flow of the strong
adsorptive component to the bottom of the bed
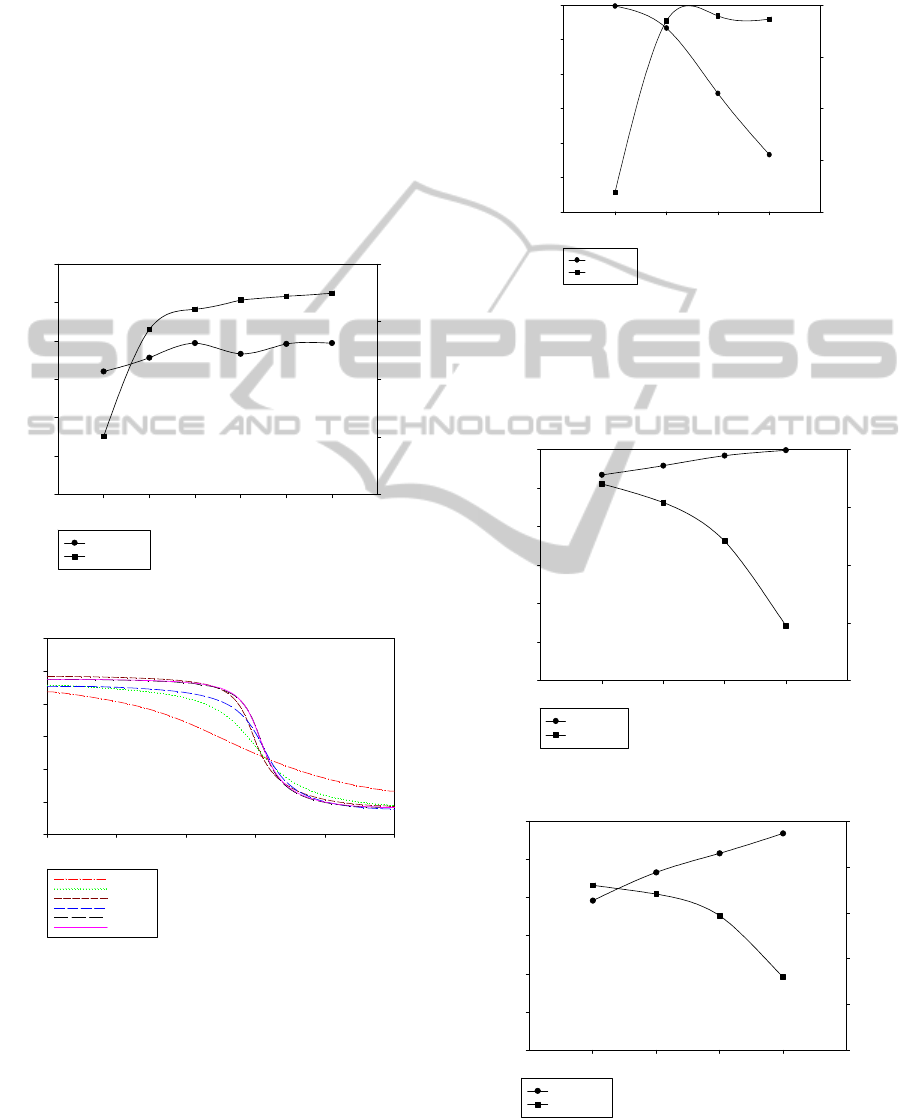
during desorption increases. Figure 7 shows that as
feed pressure increases, the CO
2
purity and recovery
in bottom product increases because CO
2
adsorption
quantity becomes larger.
Figure 8 shows that the mole fraction of CO
2
which does not change too much with different feed
pressure after cocurrent depressurization step.
Therefore weak adsorptive component recovery
doesn’t vary in top product.
feed pressure(atm)
5 1015202530
CO
2
purity(%)
97.0
97.5
98.0
98.5
99.0
99.5
100.0
CO
2
recovery*%)
80
85
90
95
100
CO
2
purity
CO
2
recovery
Figure 7: Effect of feed pressure on CO
2
in bottom product.
dimensionless bed position
0.0 0.2 0.4 0.6 0.8 1.0
mole fraction of CO
2
0.0
0.2
0.4
0.6
0.8
1.0
1.2
5atm
10atm
15atm
20atm
25atm
30atm
Figure 8: Mole fraction of CO
2
after concurrent
depressurization step.
3.2.2 Bed Length
All the operating variables are fixed except bed
length. With increasing bed length, the amount of
adsorbent and the amount of adsorbed gas increase.
Figure 9 shows that as bed length decreases, the CO
2
purity increases due to that the amount of CO
2
flow
to the top product increases. At the same feed flow
rate CO
2
recovery decreases due to that the amount
of CO
2
flow to the top product increases.
Figure 9: Effect of bed length on CO
2
in bottom product.
3.2.3 Vacuum Pressure
All the operating variables are fixed except vacuum
pressure. As the vacuum pressure increases, the
vacuum pressure(atm)
0.1 0.2 0.3 0.4
CO
2
purity(%)
97.0
97.5
98.0
98.5
99.0
99.5
100.0
CO
2
recovery(%)
80
85
90
95
100
CO
2
purity
CO
2
recovery
Figure 10: Effect of bed length on CO
2
in bottom product.
Figure 11: Effect of feed flow rate on CO
2
in bottom
product.
bed length(cm)
50 100 150 200
CO
2
purity(%)
97.0
97.5
98.0
98.5
99.0
99.5
100.0
CO
2
recovery(%)
60
70
80
90
100
CO
2
purity
CO
2
recovery
feed flow rate(L (STP)/min )
22000 26000 30000 34000
CO
2
purity(%)
97.0
97.5
98.0
98.5
99.0
99.5
100.0
CO
2
recovery(%)
90
92
94
96
98
100
CO
2
purity
CO
2
recovery
CarbonDioxideCapturefromSynthesisGasContainingSteambyPressureSwingAdsorptionatMid-highTemperature
533
amount of desorption gas at desorption step
decreases. Figure 10 shows that as the vacuum
pressure increases, the CO
2
recovery decreases due
to that the amount of adsorbed gas flow to the
bottom product at desorption step decreases.
3.2.4 Feed Flow Rate
All the operating variables are fixed except feed
flow rate. As the feed flow rate increases, the
amount of CO
2
increases at high pressure adsorption
step. Figure 11 shows that as the feed flow rate
increases, the CO
2
recovery decrease due to that the
amount of adsorption/desorption are approximately
fixed. The CO
2
purity increases as the amount of
adsorbed gas increases.
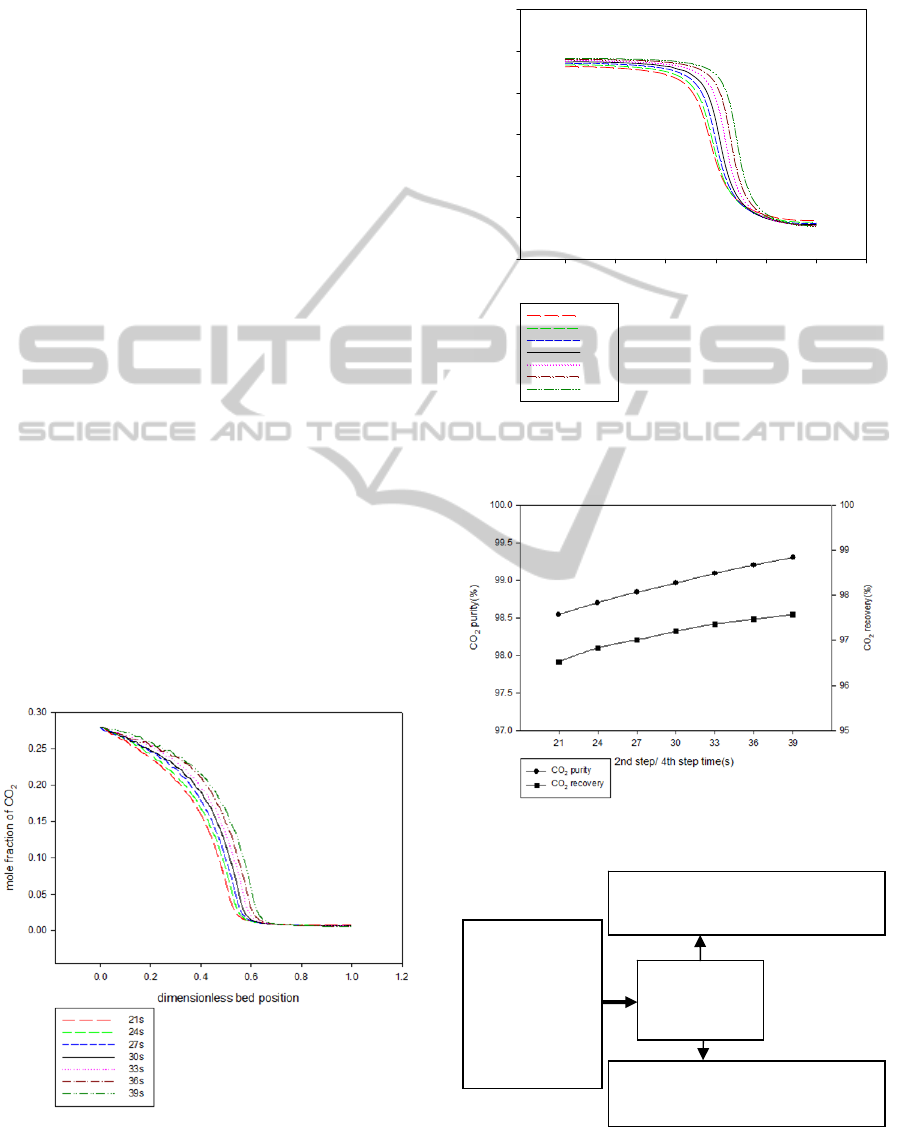
3.2.5 High Pressure Adsorption Time
and Vacuum Desorption Time
All the operating variables are fixed except high
pressure adsorption time/vacuum desorption time.
The amount of CO
2
increases in the column as the
pressure adsorption time increases. Figures 12 and
13 show that the amount of CO
2
flow to the top
product increases with increasing high pressure
adsorption time/vacuum desorption time. Therefore,
Figure 14 shows that CO
2
recovery decreases with
decreasing 2nd/4th step time.
The best operating conditions for the single-bed
four-step PSA process at mid-high temperature is
shown in Figure 15. The results of best operating
condition for the single-bed four-step process at
mid-high temperature are 96.42% purity and96.57%
Figure 12: Mole fraction of CO
2
after high pressure
adsorption step at different high pressure adsorption time
/vacuum desorption time.
recovery of CO
2
as bottom product as shown in
Figure 15. Table 6 shows the optimal operating
condition for the single-bed four-step process.
Figure 13: Mole fraction of CO
2
after vacuum desorption
step at different high pressure adsorption time/vacuum
desorption time.
Figure 14: Effect of 2nd/4th step time on CO
2
in bottom
product.
Figure 15: Results of the single-bed four-step PSA process
at mid-high temperature.
dimensionless bed position
0.0 0.2 0.4 0.6 0.8 1.0 1.2
mole fraction of CO
2
0.0
0.2
0.4
0.6
0.8
1.0
1.2
21s
24s
27s
30s
33s
36s
39s
28% CO
2
5% CO
40% H
2
40% H
2
O
feed flow rate:
22025
L(STP)/min
CO
2
purity:98.96% recovery:97.2%
bottom flow rate: 6057L(STP)/min
H
2
: purity:54.95% recovery:99.56%
top flow rate: 15961L(STP)/min
Single-bed
Four-step PSA
(673.14K)
SIMULTECH2013-3rdInternationalConferenceonSimulationandModelingMethodologies,Technologiesand
Applications
534
4 CONCLUSIONS
A single-bed four-step pressure swing adsorption
process is explored in this simulation study. The
adsorbent K
2
CO
3
-promoted hydrotalcite was used
(Lee et al., 2007a). The accuracy of the simulation
program is verified by comparing our simulation
results with the experimental data of breakthrough
curve and desorption curve from Lee et al. (2007a,
2007b). The optimal operating condition is obtained
by varying the operating variables, such as feed
pressure, bed length, feed flow rate, etc.
Furthermore, the optimal operating condition for
inlet (27 % H
2
O, 5 % CO, 28 % CO
2
and 40 % H
2
)
at mid-high temperature 673K and bed diameter
100cm is bed length 200cm, feed pressure 25atm,
vacuum pressure 0.1atm and step times at10s, 30s,
10s and 30 s. The best results and the optimal
operating condition for the single-bed four-step PSA
process at mid-high temperature are shown in Figure
15 and Table 6. In the future, our research will
proceed with dealing the top stream from CO
2
-PSA
by a second stage H
2
-PSA to improve H
2
purity.
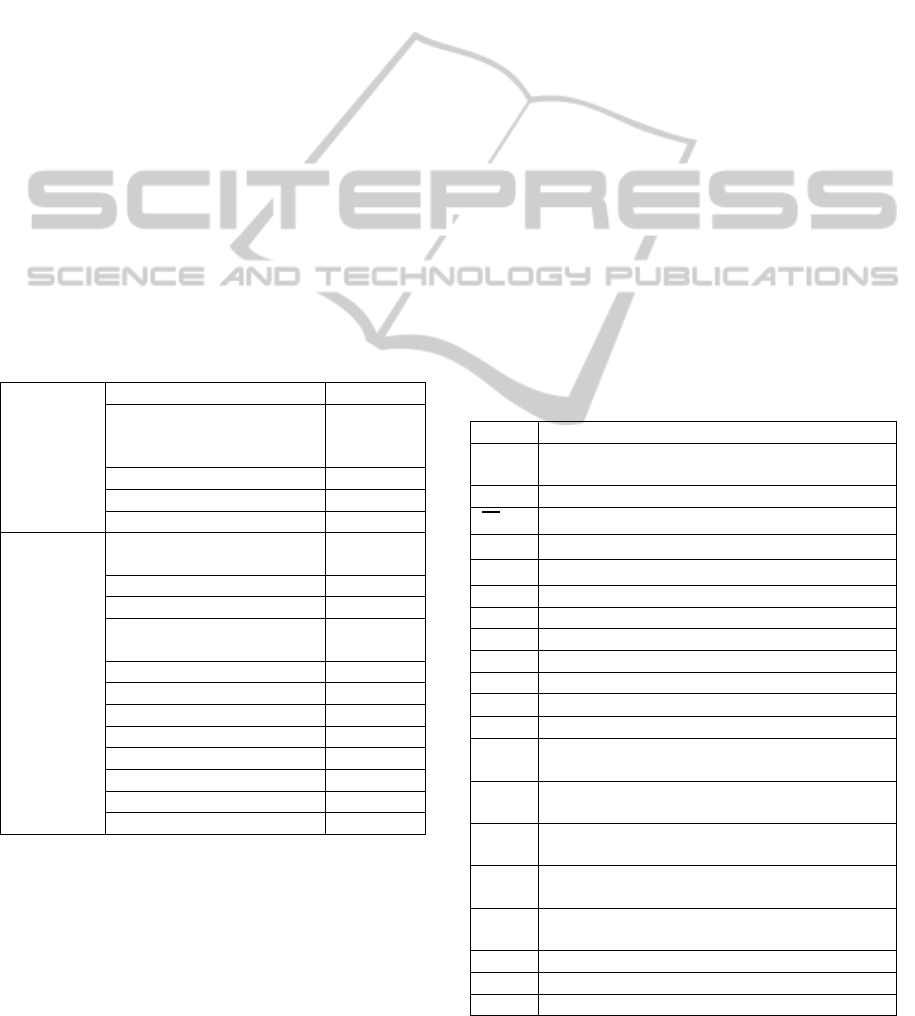
Table 6: The optimal operating condition for the single-
bed four-step process.
operating
condition
Feed pressure(atm) 25
high pressure adsorption
time and vacuum
desorption time (s)
30
Vacuum pressure(atm) 0.1
Feed flow rate L(STP)/min 22000
Bed length(cm) 200
Simulation
result
bottom flow rate
L(STP)/min
6187
CO
2
purity 96.42
CO
2
recovery 96.57
top flow rate
L(STP)/min
15870
CO
2
purity 1.34
CO
2
recovery 3.45
H
2
purity 54.77
H
2
recovery 98.49
CO purity 6.86
CO recovery 98.69
H
2
O purity 37.02
H
2
O recovery 98.64
ACKNOWLEDGEMENTS
The authors wish to thank the financial support from
National Science Council, Taiwan under project
number NSC 102-3113-P-008 -007.
REFERENCES
Abu-Zahra M. R. M., Feron P. H. M., Jansens P. J.,
Goetheer E. L. V., 2009, New process concepts for
CO
2
post-combustion capture process integrated with
co-production of hydrogen, International J. of
Hydrogen Energy, 34, 3992-4004.
Ding Y. and Alpay E., 2000, Equilibria and kinetics of
CO2 adsorption on hydrotalcite adsorbent, Chemical
Engineering Science, 55, 3461-3474.
IPCC (Intergovernmental Panel on Climate Change),
2005, Carbon dioxide capture and storage, Cambridge
University Press.
Lee K. B., Caram H. S., Verdooren A., Sircar S., 2007a,
Chemisorption of carbon dioxide on potassium
carbonate promoted hydrotalcite, J. of Colloid and
Interface Science, 308, 30-39.
Lee K. B., Beaver M. G., Caram H. S., Sircar S., , 2007b,
Reversible chemisorption of carbon dioxide:
simultaneous production of fuel-cell grade H
2
and
compressed CO
2
from synthesis gas, Adsorption, vol.
13, pp. 385-392.
NETL (National Energy Technology Laboratory), 2009
Evaluation of Alternate Water Gas Shift
Configurations for IGCC Systems, DOE/NETL-
401/080509.
APPENDIX
A cross-sectional area of packing bed (cm
2
)
a the stoichiometric coefficient for the
complexation reaction
C
i
concentration of component i
heat capacity of gas mixture (J/K·mol)
heat capacity of component i (J/K·mol)
heat capacity of adsorbent (J/K·g)
C
v
valve flow coefficient
D bed diameter (cm)
D
ax
,
i
axial dispersion coefficient (cm
2
/s)
h heat transfer coefficient (J/K·cm
2
·s)
H
i
adsorption heat of component i (J/mole)
average thermal conductivity (J/K·cm·s)
K
LDF
linear driving force coefficient (min
-1
)
k
c
the equilibrium constant for the chemisorption
reaction(atm
-1
)
k
R
the equilibrium constant for the
additional complexation reaction(atm
-a
)
n
i
adsorptive quantity on the solid phase of
component i (mole/cm
3
)
n
i
*
equilibrium adsorptive quantity on the solid
phase of component i (mole/cm
3
)
m the saturation chemisorption capacity of the
chemisorbent surface(mole/kg)
P pressure (atm)
P
1
upstream pressure (atm)
P
2
downstream pressure (atm)
CarbonDioxideCapturefromSynthesisGasContainingSteambyPressureSwingAdsorptionatMid-highTemperature
535
q mole flow rate (mole/s)
q' flow rate (L/min at 1atm, 273K)
R gas constant (82.06 atm·cm3/gmol·K)
SG specific gravity of gas
T temperature (K)
T
∞
room temperature (K)
t time (s)
y
i
mole fraction of component i in the gas phase
(dimensionless)
z axial coordinate (cm)
ε bed porosity (dimensionless)
particle density (g/cm
3
)
SIMULTECH2013-3rdInternationalConferenceonSimulationandModelingMethodologies,Technologiesand
Applications
536
