A Framework for Optimizing the Supply Chain Performance of a
Steel Producer
Ali Diabat
1
, Raid Al-Aomar
2
, Mahmoud Alrefaei
3
, Ameen Alawneh
4
and Mohd Nishat Faisal
4
1
Masdar Institute, Abu Dhabi, U.A.E.
2
Abu Dhabi University, Abu Dhabi, U.A.E.
3
Jordan University of Science and Technology, Irbid, Jordan
4
Qatar University, Doha, Qatar
Keywords: Supply Chain Management, Linear Programming, Simulation, Simulated Annealing, Steel Industry.
Abstract: Supply Chain Management (SCM) is focused on developing, optimizing, and operating efficient supply
chains. Efficient supply chains are characterized by cost effective decisions, lean flow and structure, high
degree of integration, and well-chosen Key Performance Indicators (KPIs). Although there exists a large
body of literature on optimizing individual supply chain elements (transportation, distribution, inventory,
location, etc.), the literature does not provide an effective methodology that can address the complexity of
the supply chain of a large scale industry such as steel producers. This paper, therefore, builds on existing
research methods of supply chain modeling and optimization to propose a framework for optimizing supply
chain performance of a steel producer. The framework combines deterministic modeling using Linear
Programming (LP) with stochastic simulation modeling and optimization. A holistic LP deterministic
optimization model is first used to characterize and optimize the supply chain variables. The model
minimizes the annual operating cost of the steel company’s supply chain. Simulation-based optimization
with Simulated Annealing is then used to determine the operational levels of the supply chain drivers that
meet a desired level of customer satisfaction. The proposed approach is applied to the supply chain of a
major steel producer in the Arabian Gulf.
1 INTRODUCTION
Supply chain management (SCM) has attracted ever
increasing attention over the last two decades in
response to a highly competitive and globalized
marketplace and the pressure to cut the cost of
creating and delivering value to customers. As
discussed in (Min and Zhou, 2002), a supply chain is
an integrated system which synchronizes a series of
inter-related business processes in order to. (1)
Acquire raw materials and parts; (2) transform these
raw materials and parts into finished products; (3)
add value to these products; (4) distribute and
promote these products to either retailers or
customers; (5) facilitate information exchange
among various business entities, e.g. suppliers,
manufacturers, distributors, third-party logistics
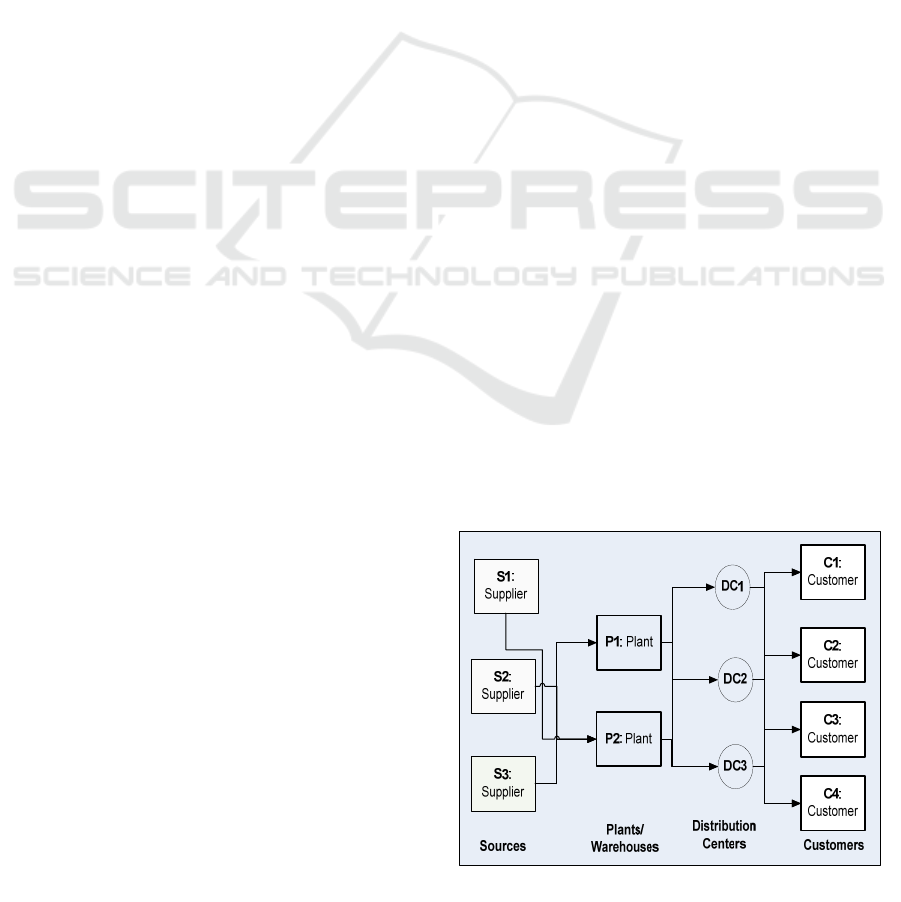
providers, and retailers. Figure 1 shows the main
elements/stages in a supply chain network from raw
materials’ sources to customers.
Figure 1: A generic framework for a supply chain
network.
Cost effective supply chain management under
various market, logistics and production
uncertainties is a critical issue for companies in
554
Diabat A., Al-Aomar R., Alrefaei M., Alawneh A. and Faisal M..
A Framework for Optimizing the Supply Chain Performance of a Steel Producer.
DOI: 10.5220/0004628405540562
In Proceedings of the 15th International Conference on Enterprise Information Systems (SSOS-2013), pages 554-562
ISBN: 978-989-8565-59-4
Copyright
c
2013 SCITEPRESS (Science and Technology Publications, Lda.)

general and for steel industry in particular. Such
uncertainties often result in multiple planning and
operational issues that challenge planners and
potentially lead to bad decisions. In order to
optimize the performance of a supply chain, it must
be first modeled using deterministic mathematical
models that maximize/minimize some or all supply
chain costs or using stochastic simulation-based
models. Mula et al. (Mula et al., 2010) presented a
review of mathematical programming models for
supply chain production and transport planning.
However, the assumptions used when developing
such models may not be realistic resulting in exact
solutions that may be infeasible for problems of any
reasonable size. Heuristic global optimization
methods such as Tabu Search (TS), Simulated
Annealing (SA), and Genetic Algorithms (GA) can
escape some of these assumptions and can often
yield good (near-optimal) solutions (Arostegui et al.,
2006).
Another issue is the fact that optimizing the
supply chain performance is a multi-attribute
decision. Altiparmak et al. (Altiparmak et al., 2006)
formulated supply chain design as a multi-objective
optimization problem in which the objective is not
only to minimize supply chain costs, but also to
maximize customer service while at the same time
maximizing the capacity utilization balance at the
distribution centers. Finally, the complexity of the
supply chain network largely contributes to the
difficulty of optimizing supply chain performance.
Jayaraman and Ross (Jayaraman and Ross, 2003)
described the PLOT (Production, Logistics,
Outbound, Transportation) system to address
network design problems involving a central
manufacturing plant, multiple distribution centers
and cross-docking sites, and retail outlets stocking
multiple products.
In the context of steel industry, however, little
research is directed at optimizing the supply chain
using deterministic or stochastic methods. Some
literature is focused on optimizing individual supply
chain elements (transportation, distribution,
inventory, location, etc.) but it does not provide an
effective methodology that can address the
complexity of the supply chain of a steel producer.
While optimizing the performance of each supply
chain element is important, steel industry is focused
on improving the overall performance of the supply
chain network. This requires a comprehensive and
dynamic modeling and optimization approach.
Thus, this research intends to build on the current
research methods of supply chain modeling and
optimization for a steel company. To this end, the
proposed research method combines deterministic
modeling with LP with stochastic simulation
modeling and optimization. The proposed approach
develops a comprehensive deterministic LP model to
minimize the annual cost of the steel company’s
supply chain including transportation, inventory, and
distribution. The viability of decision variables
resulted from the solution of the LP model is
verified in a dynamic and stochastic Discrete Event
Simulation (DES) model of the supply chain. The
model is set to produce a specific set of Key
Performance Indicators (KPIs) that are developed to
characterize the supply chain performance in terms
of responsiveness, efficiency, and utilization.
Finally, simulated annealing is used to set values to
model variables that achieve a multi-criteria tradeoff
of the defined supply chain KPIs. The proposed
approach will be applied to the supply chain of Qatar
Steel (QS) which is a main steel producer in Qatar
and the Arabian Gulf.
2 LITERATURE SURVEY
Many case studies have appeared in the literature
documenting the effectiveness of SCM in reducing
costs and increasing customer satisfaction. Sharma
et al. (Sharma et al., 2008) analyze the results of a
survey to assess the effect SCM practices have had
on the Indian automobile industry, and conclude that
SCM practices have had a positive impact on design
quality, and on the quality of conformance, the
degree to which a product's operating characteristics
meet its design specifications. Walker (Walker,
2009) discusses the implementation of a SCM
system at a manufacturing company, focusing on the
experiences and lessons learned from a management
perspective; the resulting system led to a cost
savings of $8.8 million, with an internal rate of
return of 32%. Scarsi (Scarsi, 2007) reports on a
case study in the steel industry, logistics challenges
were dealt with successfully.
Efficient supply chains are characterized by a
high degree of integration and well-chosen Key
Performance Indicators (KPIs) to provide feedback
and to rapidly diagnose potential problems. Stevens
(Stevens, 1989) proposed a four-stage evolutionary
model for supply chain integration. Potter et al.
(Potter et al., 2004) discussed the benefits achieved
through integration of a steel supply chain. These
include a halving in cycle times for many of the
more popular products, reducing the levels of safety
stock required, and reducing the lead times, resulting
in significant cost savings. Chae (Chae, 2009)
AFrameworkforOptimizingtheSupplyChainPerformanceofaSteelProducer
555

emphasizes the role of KPIs in closing the gap
between planning and execution of supply chain
operations, and offers guidelines for developing such
indicators. KPIs are suggested for four of the
processes in the Supply Chains Operations-
Reference (SCOR) framework; Plan, Source, Make,
and Deliver.
Simulated Annealing, in particular, plays a
critical role in keeping the time required to optimize
the model manageable for practical problems.
Ulungu et al. (Ulungu et al., 1995) conceived a
Multi-Objective Simulated Annealing (MO-SA)
algorithm for solving combinatorial optimization
problems. Alrefaei and Diabat (Alrefaei et al., 2009)
also proposed a simulated annealing for solving a
multi-objective optimization problem and
implemented it on an inventory problem. Another
example of using SA for SCM optimization can be
found in (Yanling et al., 2009). There has been also
an increasing interest in the use of simulation to
model the performance of supply chains. Jahangirian
et al. (Jahangirian et al., 2010) provide a
comprehensive review of the simulation literature as
it relates to manufacturing and business. Terzi and
Cavalieri (Terzi and Cavalieri, 2004) survey the
literature on the use of simulation in a supply chain
context. Other examples of simulation-based supply
chain management applications can be found in
(Longo and Mirabelli, 2008; Jung et al., 2004; Yoo
et al., 2010). A complete list of advantages and
disadvantages in using simulation approach for
supply chain modeling can be found in (Ingalls,
1998).
Existing analytical methods, however, are not
able to handle all the dynamically changing supply
chain variables. A dynamic simulation approach is a
better tool for managing the stochastic behavior of
supply chains. Effective supply chain management,
therefore, requires the integration of deterministic
and stochastic optimization the supply chain based
on a dynamic simulation platform. To this end, we
propose the integration of LP, DES, and SA. A
holistic LP deterministic optimization model is first
used to characterize and optimize the supply chain
variables. The problem of determining the
operational levels of supply chain drivers to meet a
desired level of customer satisfaction is then
approached using a simulation-based optimization
method based on simulated annealing. An industrial-
scale case study (i.e., Qatar Steel) is presented to
demonstrate the utility of the proposed approach.
This includes modeling and analyzing the supply
chain of the steel company, verifying the results of
deterministic LP using DES, developing a specific
set of KPIs to measure the performance of QS
supply chain, and optimizing such performance with
simulated annealing.
LP model is solved with GAMS software tool.
Supply chain simulation is carried out in general
purpose simulation software. The SA module is
developed to function with simulation in an integral
mode. Anticipated results include developing a total
cost model using key elements of QS supply chain,
recommending optimal settings to critical decision
variables in the cost model, and recommending a set
of operational KPIs to maintain a high level of QS
supply chain performance.
In addition to industry contributions, research
contributions to existing literature include
developing a comprehensive LP model of key
supply chain components (supply, warehouse,
production, inventory, and distribution), combining
LP optimization (a classical supply chain
deterministic optimization method) and simulation-
based optimization (a stochastic optimization
method), and optimizing the supply chain
performance using multiple KPIs. The approach can
be adapted to other steel industries and will be
generalized to a flexible company structure.
3 RESEARCH DESIGN AND
METHOD
This research proposal consists of three major
phases; Phase I is data collection and network
development for Qatar Steel supply chain. Phase II
is formulating and solving a LP that minimizes the
total cost of QS supply chain subject to supply,
demand, and operational constraints. Phase III is the
developing of DES model of QS supply chain
including a set of KPIs. Finally, Phase IV is
optimizing the supply chain using Simulated
Annealing. Figure 2 summarizes the four stages of
the research method.
As this is an ongoing research project, further
details of the research methods will be specified
later. The functionality of the proposed research
method is depicted in Figure 3. Once QS supply
chain (QS-SC) is analyzed and pertinent data is
collected, a LP model is developed so the total cost
(C) of the supply chain is minimized subject to given
constraints at the company. A DES model of QS-SC
is also developed to include other stochastic
variables that impact the supply chain performance.
The resulting set of decision variables (X) is used in
the DES model and the model is set to generate the
ICEIS2013-15thInternationalConferenceonEnterpriseInformationSystems
556
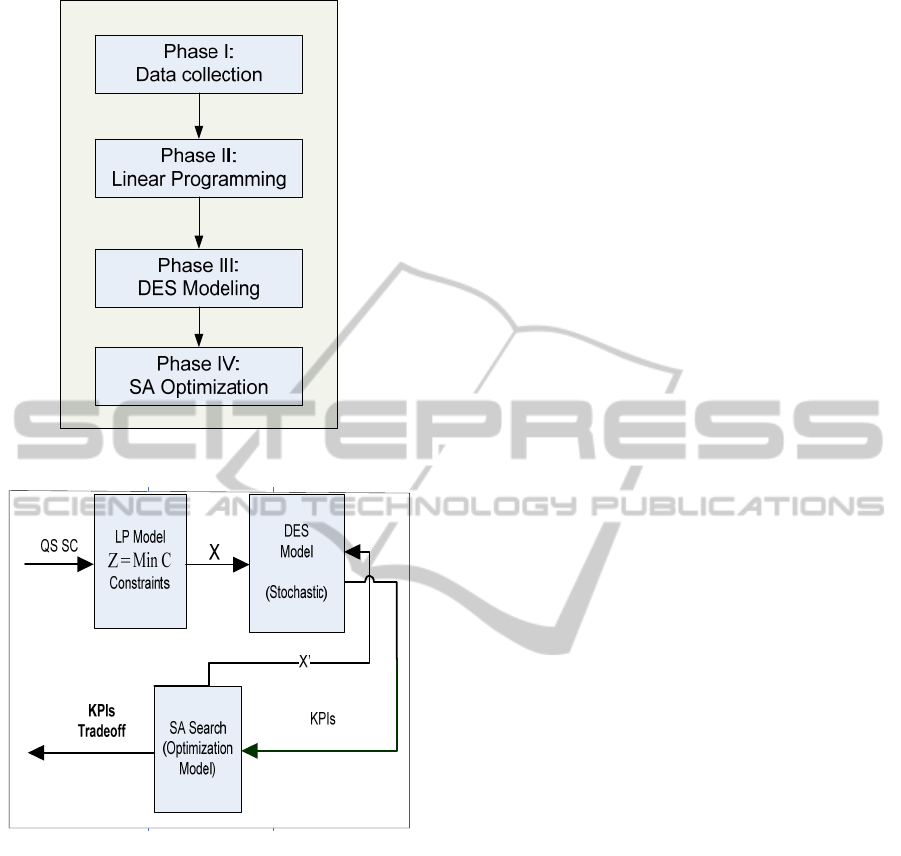
Figure 2: Research method plan.
Figure 3: Prototype of the proposed SC optimization
framework.
defined set of KPIs. The Simulated Annealing (SA)
module is used to optimize similar or enhanced set
of decision variables (X’) using the DES model as a
multi-criteria objective function. Iteration of SA
search and simulation evaluation of KPIs will
eventually lead to an efficient tradeoff of the defined
KPIs of QS-SC. The QS-SC performance will be
monitored using the SA-set levels of KPIs.
3.1 The LP Module
A LP model is developed and will be later
customized to the SC of the application case study.
The theoretical background of LP method is
assumed to be well known to readers. In this
research, the LP model formulation includes the
following:
Objective function: Minimize total yearly
cost of inbound transportation, inventory,
and distribution
Decision Variables: Pricing, inventory
policies, quantity shipped from each
supplier, and quantity shipped to traders
(distributors)
Constraints: Capacity, demand, and budget
Based on the preliminary analysis of the supply
chain optimization problem, a generic LP
optimization model is developed for the supply
chain. The data, variables, objective function, and
constraints of the proposed LP model are not
presented here for the sake of efficiency.
3.2 The DES Module
In the proposed method, simulation is used as an
overall representation of the supply chain. The DES
model incorporates variability in terms of demand,
lead time, process reliability, etc., into the supply
chain model and it is used to assess supply chain
performance based on multiple KPIs. The
preliminary plan for the DES model of the supply
chain can be described as follows:
Model Structure
A simulation module is developed to represent each
component in the underlying supply chain including
supply, warehouse, production, Inventory, and
Shipping. The details of each module (in terms of
structure, logic, and data) will be developed during
Phase III of the project.
Model Variables
The variables defined in the LP model will be
included in the DES model. This includes material
supplies, inventory, and processing in addition to
facility activities and capacity. However, time-based
variables and probabilistic variables will be
dynamically changed during run time to mimic the
actual behavior of the supply chain.
Model Data
The data elements defined in the LP model will be
included in the DES model. Pertinent data will be
collected from the five modules; supply, warehouse,
production, inventory, and shipping. Collected data
will also include supply chain constraints (facility,
AFrameworkforOptimizingtheSupplyChainPerformanceofaSteelProducer
557

capacity, etc.) as well as supply and demand
requirements.
Model Logic
The flow logic of materials, information, and money
throughout the supply chain will be developed using
the flexibility of DES software tool. This includes
material flow from suppliers (local and
international) to the company’s warehouse, through
production, finished items inventory, and shipping to
customers.
Model Outcomes
The DES model will be set to produce relevant
statistics that are essential to optimize the
performance of the supply chain. For the case study
application, the developed KPIs of QS-SC can be
categorized as follows:
Responsiveness:
o Average yield time: order-to-
delivery time.
o Fill rate: Fraction of
orders/demand met on time from
inventory.
Efficiency:
o Average inventory measured in
units, days of demand, and
financial value.
o Average inbound transportation
cost as % of sales or cost of each
ton of steel.
Utilization: Four KPIs are developed; one
for each of the four main operations in steel
production including Direct Reduction,
Electrical Furnace, Continuous Casting,
and Rolling Mill.
3.3 The SA Module
SA is an optimization method that is based on the
structural properties of materials (mainly metals)
undergoing the annealing process, where materials
are melted down and then cooled slowly in a
controlled manner (Metropolis et al., 1953). Such
process resembles the SA search in seeking global
optima while avoiding being trapped at local optima.
As a global search engine, SA has become a popular
tool for solving problems where mathematical
programming formulations become intractable. This
includes solving various combinatorial optimization
problems in circuit design, scheduling, path
generation, and many others. Further descriptions of
SA and its applications can be found in (Eglese,
1990; Laarhoven and Aarts, 1987).
SA algorithm starts by setting SA control
parameters; initial temperature (T), cooling
parameter (), number of T decrement steps (S), and
the maximum number of iterations (n) at each T
step. The temperature T, which is modulated by a
predetermined cooling schedule, controls the degree
of randomness presents within the search.
Determining the initial T value is a problem-specific
that depends on the scaling of the objective function.
Generally speaking, T must be high enough to allow
the search to move to almost any neighbourhood
state in order to avoid being trapped in local optima.
The search will seek convergence to the local optima
toward the end of the computation, when the
temperature T is nearly zero.
The cooling parameter [0,1] controls the rate
at which the temperature is reduced, where large
values (typically between 0.70 and 0.99) will
produce better results through slow cooling
schedules. Longer temperature steps (large number
of iterations n) will also produce slower cooling rate
at a fixed by allowing the system to stabilize at
that temperature step. The combination of cooling
rate () and the length of temperature step (or
cooling time) in terms of n establishes the SA
cooling schedule. Such schedule is highly problem-
dependent and has a considerable impact on the
quality of the solution found. Slow SA cooling
results in longer computation time and higher chance
of finding the optimum solution.
After setting SA parameters, an initial solution is
generated randomly and used as the first current
solution. The initial solution, as well as future
solutions, is evaluated using some objective function
(the MCS-based estimation of NP in this case).
When employed with SA search, a modification to
the simple Monte Carlo method is made so that a
new point in search space is sampled by making a
slight change to the current point and unrealistic
samples are not placed into the ensemble. This
modified procedure, which is known as a Metropolis
MCS or Metropolis annealing, was proposed by
Kirkpatrick in 1983 to find the lowest energy (most
stable) orientation of a system.
The SA module will interact with the DES model
during search iterations. The DES model will serve
as an evaluation mechanism of the supply chain
objective function under stochastic and dynamic
conditions. Model KPIs will be assessed using
multiple simulation runs and fed into the SA
“evaluate solution” step. A mechanism will be
developed to combine KPIs into a multi-criteria
ICEIS2013-15thInternationalConferenceonEnterpriseInformationSystems
558
utility function. The plan is to translate supply chain
KPIs into an overall cost/revenue model that can be
used in the SA search method. An excel sheet
interface will be used to implement the
communication between SA module and the DES
model. An alternative is to use a built-in SA module
that comes with some of the new simulation
packages such as WITNESS™ (Lanner Group Inc.,
2011).
4 APPLICATION CASE STUDY
The proposed framework will be applied to optimize
the performance of supply chain at Qatar Steel (QS).
Qatar Steel (QS) is one of the leading companies in
the region that has impact on the growth of Qatar
economy. With the price of steel declining over the
past year, due to recession in the shrinkage in
construction sector, steel companies face tight
margins and fierce competition. Therefore, steel
companies are increasingly looking for methods to
cut costs in their production and business operations
and provide extra value to their customers
throughout the supply chain. To stay competitive,
QS is increasing its focus on cutting cost and adding
more value to customers rather than increasing
prices. A major cost element is contributed by the
company’s supply chain.
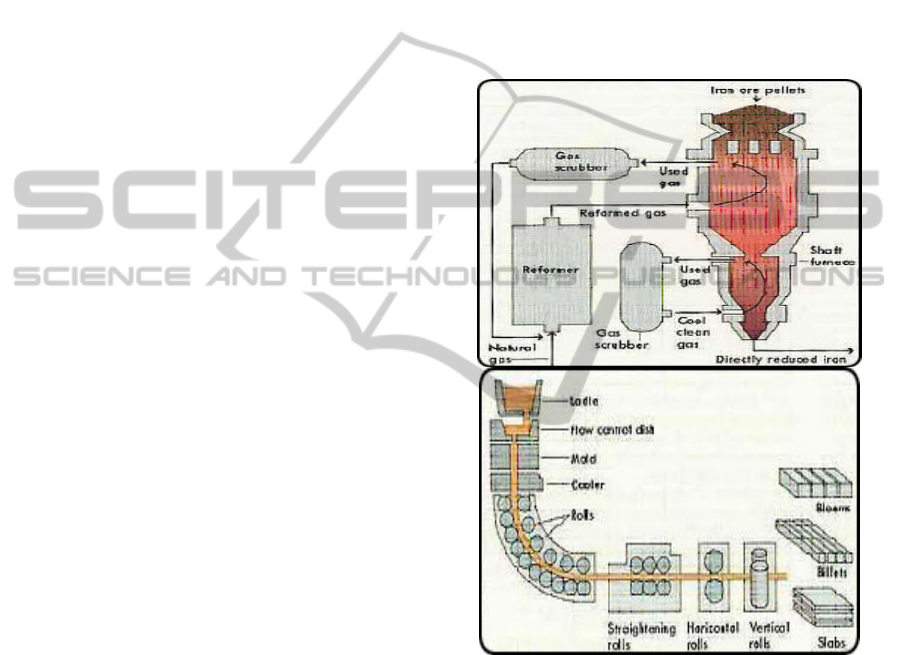
Steel manufacturing at Qatar Steel (QS)
comprised of four integrated primary units: Direct
Reduction (DR), Electric Arc Furnace (EAF) for
molten steel production, continuous casting, and
rolling mill. DR plant produces solid iron using Iron
ore pellets. The reformer converts natural gas into
hydrogen and carbon monoxide. These gases remove
oxygen from the heated ore in the furnace,
converting the ore into metallic iron. Cool gas/water
circulates through the lower part of the furnace and
cools the iron. The process produces what is called
Directly Reduced Iron (DRI), and is fed into the
Electric Arc Furnace (EAF). The EAF is used to
produce molten steel from DRI. The furnace, with
its roof swung aside, is charged with scrap using
powerful electric current arcs (jumps) between the
electrodes and the charge. This action produces
intense heat, which melts the charge and promotes
chemical reactions that produce steel.
Workers turn off the power to the electrodes at
the end of the refining process. Then they tilt the
furnace, which is mounted on rockers, to pour out
the slag. After the slag has been poured off, the
electric arc furnace is tilted in the opposite direction.
The liquid steel rushes out through the tap hole and
is collected in a ladle. The molten steel produced in
the electric furnace is poured into the continuous
casting unit, which shapes molten steel into billets.
The steel flows through a specially shaped mold.
Cold water quickly cools the steel, causing it to
harden as it moves through the rolls of the caster.
These billets are one type of QS products. This is
another unit which shapes molten steel. Rolling
Steel bars takes place in a bar mill, which resembles
a hot-rolling mill. A bar mill has rolls that are
grooved to roll hot billets into square, round, oval or
hexagonal. Figure 4 depicts the steel manufacturing
process at QS.
Figure 4: QS manufacturing process.
The main functions of Qatar Steel’s supply chain
include procurement, logistics, warehousing, and
distribution. Procurement focuses raw materials,
equipment, spares and consumables, and supply
contracts. Logistics is focused on customs and
transportation. Warehousing is focused on inventory
control, warehouse operations (receiving and
shipping), and item management. Bulk materials do
not enter the warehouse. They are stored in the
outside yard. Finished items are not also entered to
the warehouse and stored in the plant’s internal
storage bays prior to shipping. Bays can host items
up to 14 days of production. Distribution is a
AFrameworkforOptimizingtheSupplyChainPerformanceofaSteelProducer
559
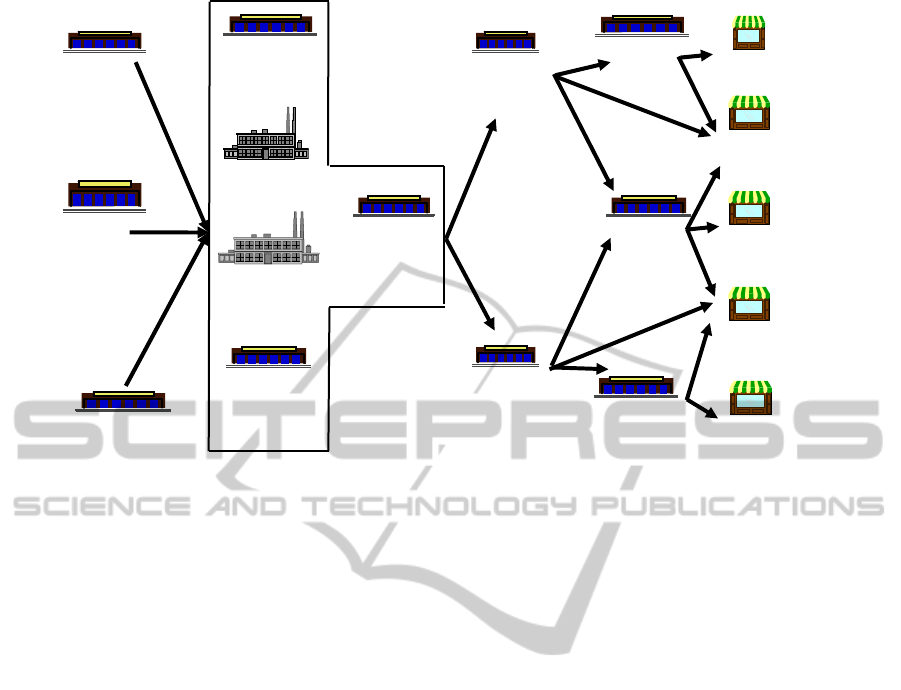
Figure 5: QS supply chain.
function controlled by the domestic and regional
traders (dealers) who order steel products and pick
up their orders from the plant. Figure 5 depicts the
generic structure of QS supply chain network.
5 ANTICIPATED RESULTS
This is still an ongoing research project so results are
not ready yet. However, preliminary data collected
from QS company indicates some operational and
coordination problems with the supply chain. This
resulted in increased cost at various elements of the
supply chain including inbound transportation,
inventory, and distribution. Anticipated results
include the QS-SC KPIs, decision variables, total
cost, and pull framework. Several other useful
findings and results are expected from analyzing the
supply chain of steel industry. Few researchers have
approached this before including (Potter et al., 2004;
Heidrich, 2002). In particular key results will be
specified when developing an Integrated Supply
Chain Network (ISCN) for QS Company and
developing DES to model a dynamic and stochastic
network.
Developing a set of informative KPIs for QS-SC.
Measuring the supply chain performance using a
specific set of KPIs is imperative to quantify
improvement, monitor progress, identify potential
problems, and reveal gaps between planning and
execution. As discussed in (Chae, 2009), KPIs can
be developed to cover each stage of the Supply
Chain Operations Reference (SCOR) model which
includes Planning, Sourcing, Making, and Delivery.
Alternatively, and as discussed in (Chopra and
Meindl, 2007), KPIs can be developed for each
supply chain driver including facilities, inventory,
transportation, sourcing, pricing, and Information
Technology (IT). In this research, KPIs will be
developed based on what is essential for the success
of QS supply chain in terms of responsiveness,
efficiency, and utilization. The final form of the
proposed KPIs will be set after collecting further
information on QS supply chain stages and drivers.
As a starting point, however, the following set of
KPIs will be developed for QS supply chain:
Average yield time: order-to-delivery time
Fill rate: Fraction of orders/demand met on
time from inventory
Average inventory measured in units, days
of demand, and financial value
Average inbound transportation cost as %
of sales or cost of each ton of steel
The utilization of the four main operations
in QS steel production: Direct Reduction,
Electrical Furnace, Continuous Casting,
and Rolling Mill
Measuring and validating the values of these
KPIs will be used to evaluate the research results as
well as for monitoring the QS-SC performance. To
validate project results, these KPIs will be first
C
C
u
u
s
s
t
t
o
o
m
m
e
e
r
r
M
M
a
a
t
t
e
e
r
r
i
i
a
a
l
l
s
s
W
W
a
a
r
r
e
e
h
h
o
o
u
u
s
s
e
e
S
S
t
t
e
e
e
e
l
l
P
P
l
l
a
a
n
n
t
t
B
B
i
i
l
l
l
l
e
e
t
t
V
V
e
e
n
n
d
d
o
o
r
r
F
F
i
i
n
n
a
a
l
l
P
P
r
r
o
o
d
d
u
u
c
c
t
t
i
i
o
o
n
n
F
F
i
i
n
n
i
i
s
s
h
h
e
e
d
d
G
G
o
o
o
o
d
d
s
s
D
D
C
C
C
C
o
o
m
m
p
p
o
o
n
n
e
e
n
n
t
t
s
s
W
W
a
a
r
r
e
e
h
h
o
o
u
u
s
s
e
e
S
S
p
p
a
a
r
r
e
e
p
p
a
a
r
r
t
t
s
s
V
V
e
e
n
n
d
d
o
o
r
r
P
P
l
l
a
a
n
n
t
t
W
W
a
a
r
r
e
e
h
h
o
o
u
u
s
s
e
e
F
F
i
i
n
n
i
i
s
s
h
h
e
e
d
d
G
G
o
o
o
o
d
d
s
s
D
D
C
C
T
T
r
r
a
a
d
d
e
e
r
r
D
D
C
C
T
T
r
r
a
a
d
d
e
e
r
r
D
D
C
C
T
T
r
r
a
a
d
d
e
e
r
r
D
D
C
C
C
C
u
u
s
s
t
t
o
o
m
m
e
e
r
r
C
C
u
u
s
s
t
t
o
o
m
m
e
e
r
r
C
C
u
u
s
s
t
t
o
o
m
m
e
e
r
r
O
O
t
t
h
h
e
e
r
r
V
V
e
e
n
n
d
d
o
o
r
r
s
s
C
C
u
u
s
s
t
t
o
o
m
m
e
e
r
r
ICEIS2013-15thInternationalConferenceonEnterpriseInformationSystems
560

measured for previous year of supply chain
operation and then used for planning the coming
year. The flexibility of DES model will facilitate the
validation of current performance and the prediction
of the future performance. The total cost results from
the LP model will be more meaningful to company’s
management and can be used to validate the project
results. The total cost of supply chain using last year
data will be first computed from the LP model. The
result will be compared to the actual values as
reported in the company’s book.
The values of defined decision variables in the
QS-SC will be also produced as project outcomes.
These variables will be identified during the project,
approved by management, and used to formulate the
LP total cost model. The DES model will be used to
test the QS-SC performance under other stochastic
variables and the SA algorithm will be used to
develop robust settings for these variables under
similar-to-real-world conditions. The proposed
solution is expected to result in a reduced total cost
of the supply chain. Finally, a pull framework for the
QS-SC case study is also expected from this
research to reduce the waste and costs and develop a
lean supply chain. This result can be evaluated by
implementing the proposed framework and
reassessing the developed KPIs. Other issues that
would make this research significant to QS include:
The accuracy of demand forecasting
including market traders orders, sales, and
marketing. This forces the company to keep
14 days’ worth of finished products in
inventory.
Currently, the company adopts a push
system for the supply chain. As a result,
staged inventory is increasing across the
facilities due to production fluctuation.
Difficulties in monthly plan translation into
RM requirements and weekly production
plan. Estimated variability of mismatch is
5-10%.
Long order lead time of 1-2 months for
inbound shipments. This results in keeping
1-3 months safety stock of raw material:
Overseas suppliers use ships to deliver RM
through company operated port and
additives from Doha port.
Material management: bar-coding project is
still in progress for items excluding bulk
materials. Along with that, better material
handling equipment and methods are in
need.
MRP module is not effective when linked
to company’s Enterprise Resources
Planning (ERP) system
6 CONCLUSIONS
This paper presented a framework for optimizing the
supply chain of a major steel producer. This
framework integrates mathematical programming
with simulation and simulated annealing. This
includes modeling and analyzing the supply chain of
the steel company, verifying the results of
deterministic models using simulation, developing a
specific set of KPIs to measure the performance of
the supply chain, and optimizing such performance
with simulated annealing. The framework defines
specific set of Key Performance Indicators (KPIs)
that are developed to characterize the supply chain
performance in terms of responsiveness, efficiency,
and utilization. The framework is part of an ongoing
research project. Further details and results will be
presented at the conference.
ACKNOWLEDGEMENTS
The researchers would like to acknowledge Qatar
National research Fund (QNRF) of Qatar
Foundation for funding this research.
REFERENCES
Min, H., and Zhou, G., 2002. “Supply chain modeling:
Past, present and future,” Computers & Industrial
Engineering, 43, 231–249.
Mula, J., Peidro, D., Diaz-Madronero, M., and Vicens, E.,
2010. “Mathematical programming models for supply
chain production and transport planning,” European
Journal of Operational Research 204, 377–390.
Arostegui, M. A., Kadipasaoglu, S. N., Khumawala, B.
M., 2006. “An empirical comparison of Tabu Search,
Simulated Annealing, and Genetic Algorithms for
facilities location problems,” International Journal of
Production Economics 103, 742 - 754.
Altiparmak, F., Gen, M., Lin, L., Paksoy, T., 2006. “A
genetic algorithm approach for multi-objective
optimization of supply chain networks,” Computers &
Industrial Engineering 51, 196 - 215.
Jayaraman, V., Ross, A., 2003. “A simulated annealing
methodology to distribution network design and
management,” European Journal of Operational
Research 144, 629 - 645.
AFrameworkforOptimizingtheSupplyChainPerformanceofaSteelProducer
561

Sharma, V., Sahay, B. S., Sardana, G. D., 2008. “An
Empirical Assessment of the Impact of SCM Practices
on Quality Performance: A Case in the Indian
Automobile Industry,” Supply Chain Forum 9(1), 28 -
40.
Walker, K., 2009. “Ingredients for a Successful Supply
Chain Management System Implementation,” Supply
Chain Forum 10(1), 44 - 50.
Scarsi, R., 2007. “Recovering Supply Chain Cost
Efficiency Through Original Logistics Solutions: A
Case in the Steel Industry,” Supply Chain Forum 8(1),
74 - 82.
Stevens, G. C., 1989. “Integrating the Supply Chain,”
International Journal of Physical Distribution &
Logistics Management 19(8), 3-8.
Potter, A., Mason, R., Naim, M., Lalwani, C., 2004. “The
evolution towards an integrated steel supply chain: A
case study from the UK,” International Journal of
Production Economics 89, 207-216.
Chae, B. K., 2009. “Developing key performance
indicators for the supply chain: and industry
perspective,” Supply Chain Management: An
International Journal 14(6), 422-428.
Ulungu, E.L., Teghem, J., and Fortemps, Ph., 1995.
“Heuristic for multi-objective combinatorial
optimization problems by simulated annealing,” in: J.
Gu, G. Chen, Q. Wei, S. Wang (Eds), MCDM: Theory
and Applications, Sci-Tech, 229–238.
Alrefaei, M. H., and Ali Diabat., 2009. “A Simulated
Annealing Technique for Multi-Objective Simulation
Optimization,” Applied Mathematics and
Computation, 215, 3029-3035.
Yanling, W., Deli, Y., Guoqing, Y., 2010. “Logistics
supply chain management based on multi-constrained
combinatorial optimization and extended simulated
annealing,” 2010 International Conference on
Logistics Systems and Intelligent Management, 188-
192.
Jahangirian, M., Eldabi, T., Naseer, A., Stergiouslas, L.
K., Young, T., 2010. “Simulation in manufacturing
and business: A review,” European Journal of
Operational Research 203, 1-13.
Terzi, S., Cavalieri, S., 2004. “Simulation in the supply
chain context: a survey,” Computers in Industry 53, 3-
16.
Longo, F., Mirabelli, G., 2008. “An advanced supply
chain management tool based on modeling and
simulation,” Computers & Industrial Engineering 54,
570–588.
Diabat, A., Richard, J. P., Codrington, C. W., 2013. “A
Lagrangian relaxation approach to simultaneous
strategic and tactical planning in supply chain
design,” Annals of Operations Research, 203(1), 55-
80.
Jung, J. Y., Blau, G., Pekny, J. F., Reklaitis, G. V.,
Eversdyk, D., 2004. “A simulation based optimization
approach to supply chain management under demand
uncertainty,” Computers & Chemical Engineering 28,
2087-2106.
Yoo, T., Cho, H., Yücesan, E., 2010. “Hybrid algorithm
for discrete event simulation based supply chain
optimization,” Expert Systems with Applications 37,
2354-2361.
Ingalls, R. G., 1998. “The value of simulation in modeling
supply cha
in,” In Proceedings of the 1998 winter
simulation conference, Washington DC, 1371–1375.
Metropolis, N., A. Rosenbluth, M. Rosenbluth, A., Teller,
E., 1953. “Equation of state calculations by fast
computing machines,” Journal of Chemical Physics,
21, 1087-1092.
Eglese, R. W., 1990. “Simulated annealing: a tool for
operational research,” European Journal of
Operational Research 46(3), 271- 279.
Laarhoven, P. J. M. and E. Aarts, 1987. “Simulated
Annealing: Theory and Applications,” D. Reidel
Publishing Company, Holland.
Lanner Group Inc., 2011. http://www.lanner.com/
Heidrich, J., 2002. “Implementation of supply chain
management systems in steel industry,” Industry
Management, 18(5), 46-49.
Chopra, S. and Meindl, P. 2007. Supply Chain
management; Strategy, Planning, and Operations.
Prentice Hall, New Jersey.
ICEIS2013-15thInternationalConferenceonEnterpriseInformationSystems
562
