
Comparison of Parametric and Non-Parametric Spectral Estimation
Methods for Automatic Tremor Detection against Clinical Evaluation
O. Martinez-Manzanera, J. H Elting, J. W. van der Hoeven and N. M. Maurits
Department of Neurology, University Medical Center Groningen (UMCG), University of Groningen,
Groningen, The Netherlands
Keywords: Tremor, Accelerometry, Biomedical Signal Processing, Psychogenic Tremor.
Abstract: Psychogenic tremor (PT) is a condition where the person affected suffers from tremor with variable
characteristics that can make it difficult to diagnose. To help in the diagnosis an automatic tremor detection
method applied to long-term kinematic recordings is proposed. The recorded signal is divided in segments
which are analyzed and classified automatically as “tremor” or “no tremor”. The classification is done
according to the location of the dominant frequency of the power spectral density (PSD) of each segment.
Different PSD estimation methods are explored to determine the optimum method for segments of short
length. The performance of each method is compared against a clinical assessment of tremor.
1 INTRODUCTION
Psychogenic movement disorders (PMD) are
characterized by the presence of abnormal
movements that cannot be attributed to an organic
neurological disorder and are considered to be
psychologically mediated (Kranick et al., 2011). PT
is the most common form of PMD (Jankovic et al.,
2006). The diagnosis of a movement disorder is
mainly a clinical process where patients are
interviewed and undergo clinical observation. For a
diagnosis of PT the movement characteristics must
be incongruent with any organic tremor and the
tremor may not be fully explained by an organic
disease (Jankovic et al., 2006). PT often shows
variable amplitude and frequency, suggestibility and
entrainment and it changes character or is
suppressed when the patient is distracted (Kenney et
al., 2007). While these features are useful clues the
certainty of a final diagnosis largely depends on the
experience of the examiner (Jankovic et al., 2006).
These features can be quantified using
electromyographic (EMG) (O’Suilleabhain and
Matsumoto, 1998) or kinematic recordings (Salarian
and Russmann, 2007). A clinician can detect
episodes of tremor in these recordings by assessing
the signals qualitatively (by visual inspection) and
quantitatively (by using PSD estimation).
In patients with PT (where tremor symptoms are
variable) long term recordings could be beneficial
for accurate diagnosis.
Kinematic recordings have been used to assess
tremor duration (Pareés et al., 2012). The presence
of tremor was compared with a self-report from the
patient from the same period resulting in an
overestimation of tremor by the patient. Detailed
analysis of the signals would require a large time
investment of a clinician. In this study we therefore
compare several automatic tremor detection methods
based on PSD estimation applied to long-term
accelerometry recordings. The goal is to evaluate the
accuracy of the automatic detection methods in
identifying tremor compared to a clinician’s
assessment.
2 METHODS
Kinematic recordings obtained from the diagnostic
work-up of 15 patients with different disorders (12
males, 3 females, mean age=68.2, standard
deviation=9.7 years, 5 parkinsonism, 4 essential
tremor, 2 enhanced physiological tremor, 2 PT, 1
dystonia, 1 ataxia) at UMCG were used in this study.
The signal obtained from a uniaxial accelerometer
placed on the dorsal side of the hand of the most
affected limb was used for analysis. Methods to
estimate the PSD of a signal can be divided in
Martinez-Manzanera O., H. Elting J., W. van der Hoeven J. and Maurits N..
Comparison of Parametric and Non-Parametric Spectral Estimation Methods for Automatic Tremor Detection against Clinical Evaluation.
Copyright
c
2013 SCITEPRESS (Science and Technology Publications, Lda.)
parametric (the signal is represented by a model plus
noise) and non-parametric (no model assumption).
For this study both methods were used to determine
the dominant frequency in the accelerometer signal.
2.1 Non-Parametric Methods
Two methods to estimate the PSD based on the Fast
Fourier Transform (FFT) were used. The modified
periodogram (Hann window) was used since it is
one of the less computationally intensive methods.
Also the Welch method (a very popular method to
reduce the variance of the PSD) (Welch, 1967) was
used (2, 3 or 8 windows with 50% overlap). For both
methods, the dominant frequency was selected as the
frequency of the peak with the highest amplitude
within the 0-20 Hz frequency band.
2.2 Parametric Methods
We selected an autoregressive (AR) model because
it is suited for estimating spectra that are
characterized by their peaks, making it the most
appropriate method for the analysis of tremor data
(Spyers-Ashby et al., 1998). AR modelling of a time
series is based on the assumption that each value of
the series can be predicted as a weighted sum of the
previous values (and posterior values for the Burg
method) of the same series plus an error term
(Takalo et al., 2005). The number of values used in
the prediction is the model order. In this study we
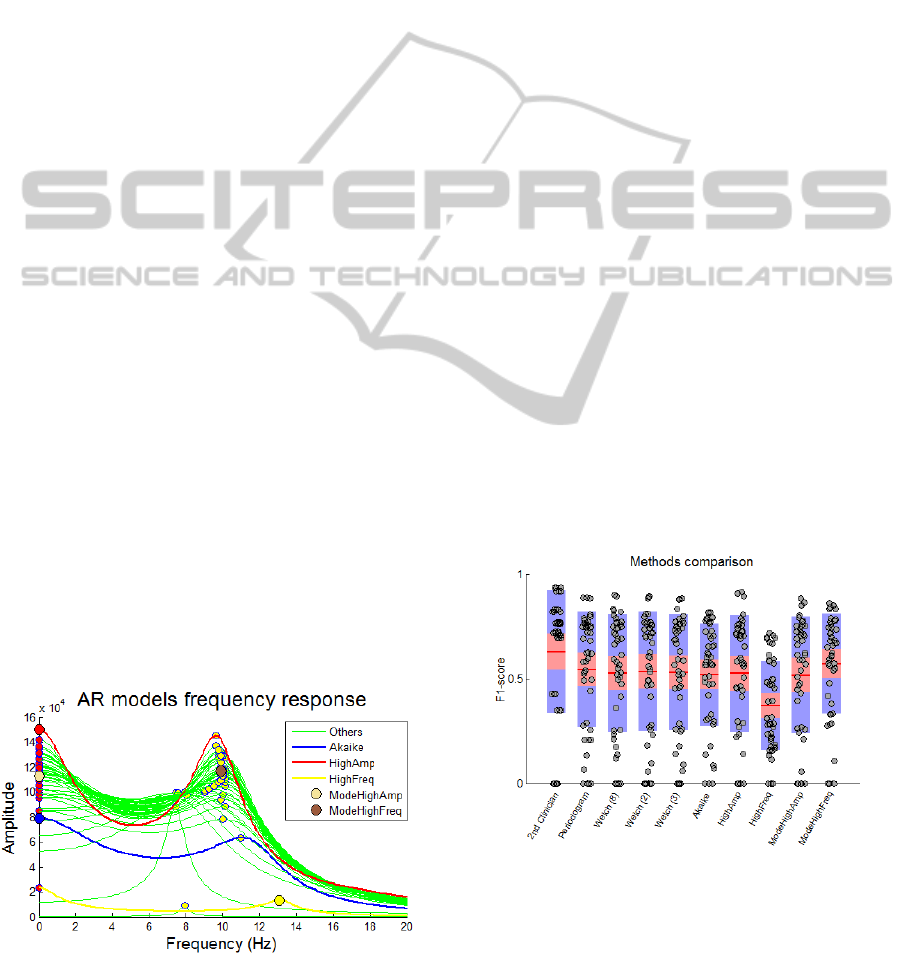
used the Akaike criterion (Akaike, 1974) and four
criteria based on the evaluation of the frequency
responses from the 2nd order filter to the 50th order
(Fig. 1). For each response we determined the
frequency of the peak with the highest amplitude
(HighAmp) and the frequency of the peak with the
highest frequency (HighFreq; up to 20 Hz) of all the
responses. ModeHighAmp is the most occurring
frequency in all the responses when HighAmp is
Figure 1: Frequency response of models (2
nd
to 50
th
order)
obtained from one segment and their dominant frequencies
according to five criteria (see text).
searched. ModeHighFreq is the most occurring
frequency in all the responses when HighFreq is
searched (Fig. 1).
2.3 Tremor Classification
Two experienced clinicians evaluated the
accelerometer signal per segments of 4 seconds.
They visually assessed the signal and used a PSD
estimation tool (based on FFT) to determine the
dominant frequency of a specific segment, when
needed. The clinicians classified the segment as
tremor when the signal was dominantly sinusoidal
and the frequency was consistent with a tremor. In
the automatic methods, the criterion for a tremor
segment was a dominant frequency between 2.5-10
Hz. To compare the methods the F1-score was used.
It is an evaluation metric that combines the positive
predictive value and the sensitivity in a single
number.
3 RESULTS
Compared to the postulated gold standard (1
st
clinician), the evaluation by the 2
nd
clinician resulted
in a better F1 score than the automatic methods. The
performance of the automatic methods is similar,
only HighFreq has very poor specificity due to its
tendency to localize high frequency peaks (Fig. 2).
The results vary depending on the patient suggesting
that some conditions are more difficult to assess
using solely the accelerometer signal.
Figure 2: F1-score for each method (applied to segments
of length 1, 2 and 4 s). Results are plotted with a grey
circle, the mean and 95% confidence intervals are shown
in red.
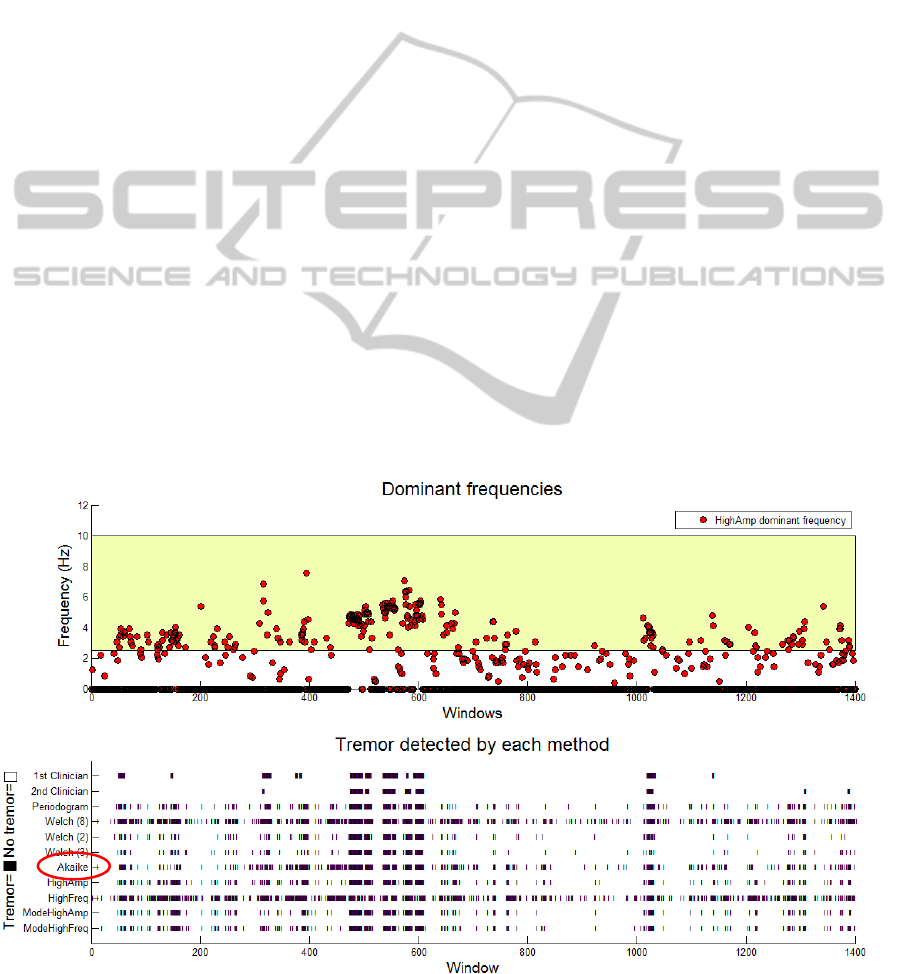
4 DISCUSSION
The intervals in which tremor is found are similar
for almost all automatic methods (Fig. 3) These
similarities may indicate that there are signal
segments that contain characteristics that made them
be classified as tremor by the automatic methods but
not by the clinician (e.g. the clinician may classify a
segment as tremor using a more constrained
frequency bandwidth than 2.5-10 Hz,
unconsciously). Constraining this bandwidth in the
automatic methods would probably improve the
results as Fig. 3 (top) suggests. This would result in
a higher probability that the segment classified as
tremor by the automatic methods actually
corresponds to a true episode of tremor. We propose
that in long term recordings having a trade-off
between a high positive predictive value at the
expense of an acceptable level of sensitivity is
beneficial, since the detection of false positive
tremor segments would be avoided and enough
tremor segments could still be used. Since peak
detection might not be the most accurate method to
identify tremor, other methods (e.g. ratio of tremor
area under the curve in frequency response) will be
studied in the future.
The method selected as gold standard may not be
optimal either, because it concerns a subjective
interpretation. Moreover, in our current approach,
neither the clinicians, nor the automatic methods
incorporated other information as used in daily
routine to diagnose tremor (EMG, video recordings).
REFERENCES
Akaike, H., 1974. A new look at the statistical model
identification. Automatic Control, IEEE Transactions
Jankovic, J., Vuong, K. D. & Thomas, M., 2006.
Psychogenic tremor: long-term outcome. CNS
spectrums, 11(7), pp.501–8.
Kenney, C. et al., 2007. Distinguishing psychogenic and
essential tremor. Journal of the neurological sciences,
263(1-2), pp.94–9.
Kranick, S., Gorrindo, T. & Hallett, M., 2011.
Psychogenic movement disorders and motor
conversion: a roadmap for collaboration between
neurology and psychiatry. Psychosomatics, 52(2)
O’Suilleabhain, P. E. & Matsumoto, J. Y., 1998. Time-
frequency analysis of tremors. Brain : a journal of
neurology, 121 ( Pt 1, pp.2127–34).
Salarian, A. & Russmann, H., 2007. Quantification of
tremor and bradykinesia in Parkinson’s disease using a
novel ambulatory monitoring system. Biomedical …,
54(2), pp.313–22.
Spyers-Ashby, J. M., Bain, P. G. & Roberts, S. J., 1998. A
comparison of fast Fourier transform (FFT) and
autoregressive (AR) spectral estimation techniques for
the analysis of tremor data. Journal of neuroscience
methods, 83(1), pp.35–43.
Pareés et al., 2012. Believing is perceiving: Mismatch
between self-report and actigraphy in psychogenic
Figure 3: Results for patient 1 (Psychogenic tremor). Top: Dominant frequencies for each 1 s segment (HighAmp method).
Yellow band: range for tremor detection. Bottom: Tremor detection by each method for each segment.

tremor. Brain 135;117-123
Takalo, R., Hytti, H. & Ihalainen, H., 2005. Tutorial on
univariate autoregressive spectral analysis. Journal of
clinical monitoring and computing, 19(6), pp.401–10.
Welch, P., 1967. The use of fast Fourier transform for the
estimation of power spectra: a method based on time
averaging over short, modified periodograms. Audio
and Electroacoustics, IEEE Transactions on.
