
Novel Techniques to Handle Rectangular Areas in Car-to-X
Communication Applications
Attila Jaeger and Sorin A. Huss
Integrated Circuits and Systems Lab, Technische Universit¨at Darmstadt, Hochschulstraße 10, 64289 Darmstadt, Germany
Keywords:
Car-to-Car communication, Rectangular Area.
Abstract:
Car-to-X communication is one of the main technologies to enable a various set of ITS use-cases. Thereby,
among others, messages about local dangers are exchanged. According to message specification, the relevance
area of such dangers may be encoded as a rectangle. In this work we present several techniques to handle such
rectangular areas. These techniques are already included and, hence, extensively tested in the Weather Hazard
Warning applications in current vehicle communication field operations tests in Germany and Europe.
1 INTRODUCTION
Car-to-X (C2X) communication, the combination of
Car-to-Car (C2C), Car-to-Infrastructure (C2I), and
Infrastructure-to-Car (I2C) communication, is con-
sidered as one of the most important technologies to
improve traffic efficiency and traffic safety in the near
future (C2C-CC, 2007). Such vehicle communica-
tion, i.e., based on 802.11p (IEEE, 2010), is the basic
technology for various ITS use-cases (ETSI, 2010b).
Although, current development of applications and
system components is quite far and multiple field op-
erational trials are finished, research is still needed un-
til upcoming market launch.
In C2X communication, the Decentralized En-
vironmental Notification Message (DENM) (ETSI,
2010a) is the major message to notify ITS participants
about the presence of a specific and potential danger-
ous situation nearby.
Since these situations are relevant in a bounded
geographical region, vehicle communication utilizes
geo-cast (C2C-CC, 2007), a location based address-
ing scheme, whereby messages are forwarded to a
specific geographical area and delivered to every ITS
station within that destination area. Thereby, the area
might be defined as a rectangle. Additionally to the
destination area, a relevance area, which might also
have rectangular shape, is defined in DENMs. In con-
trast to, e. g., circular relevance areas, rectangles may
cover more precisely the shape of a road.
While handling of circular areas is relatively com-
mon and related techniques are well-known in the ve-
hicle communication community, handling of rectan-
gular areas is rather unfamiliar. Hence, in this work
we collect known and present new techniques for the
major basic operations a C2X application has to solve
while handling rectangular areas. These operations
are
1. to define a rectangle around a given set of points,
e. g., a trace,
2. to determine if a given position is located inside
or outside a rectangle,
3. to calculate the size of the overlapped area of two
partial overlapping rectangles, and
4. to achieve the distance between a point, e. g., the
vehicles current position, and the nearest border
of a rectangle.
To demonstrate the usage of the introduced rect-
angular arithmetic by means of an application exam-
ple, we utilize the Weather Hazard Warning applica-
tion as presented in (St¨ubing and Jaeger, 2010) and
more detailed in (Jaeger and Huss, 2011), since this
C2X application uses rectangular areas to determine
the location of the weather situation in DENMs and
within function internals.
2 REPRESENTING
RECTANGLES AND
COORDINATES
While a circular area is commonly defined by a center
point and a radius according to (ETSI, 2010c), rect-
575
Jaeger A. and A. Huss S. (2013).
Novel Techniques to Handle Rectangular Areas in Car-to-X Communication Applications.
In Proceedings of the 10th International Conference on Informatics in Control, Automation and Robotics, pages 575-582
DOI: 10.5220/0004633205750582
Copyright
c
SciTePress
angles in DENMs, i. e., the destination and relevance
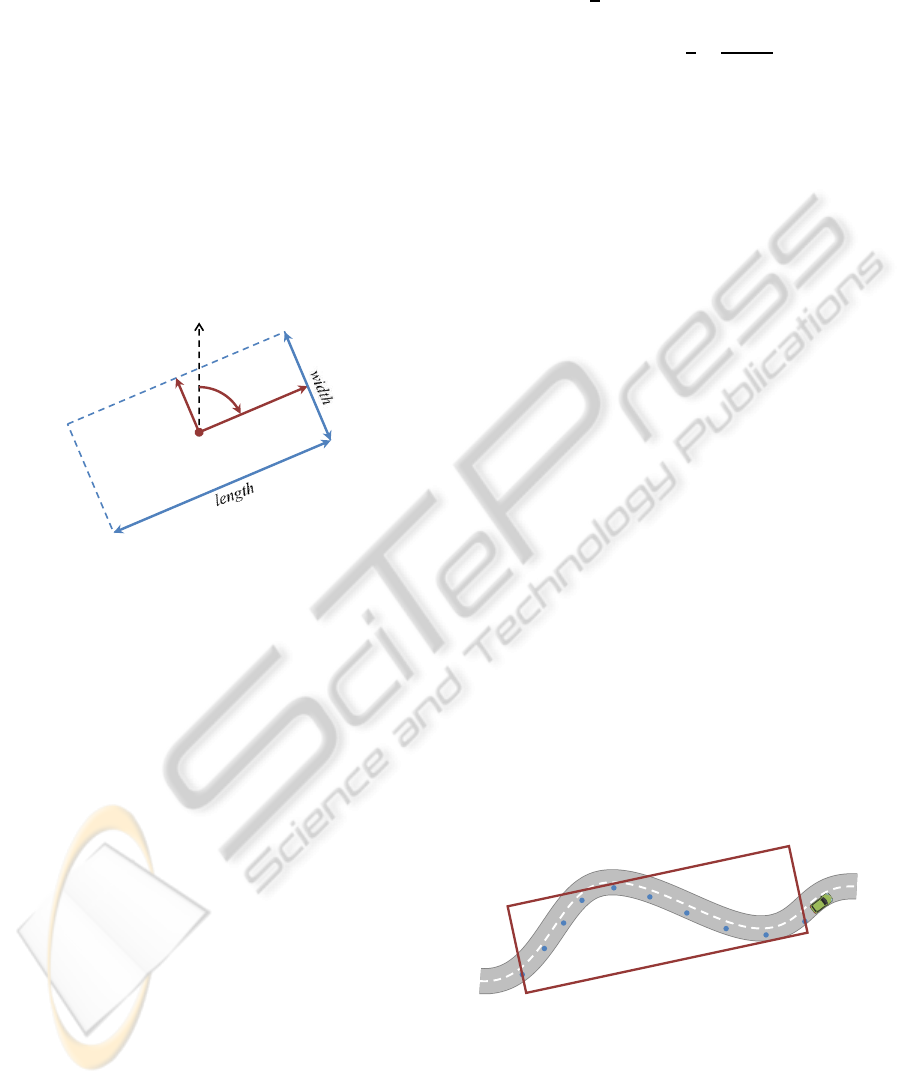
area, each are defined by the following parameters:
M the center of the rectangle
a the half of the length
(distance from the center to the shorter side)
b the half of the width
(distance from the center to the longer side)
θ
the clockwise rotation against north
(azimuth angle).
Thereby, M is given as a WGS-84 coordinate, a
and b are given in meters, and
θ
is an angle in de-
grees. With these parameters, not only axis-oriented,
but also arbitrarily oriented rectangles can be defined.
Such a rectangle and its parameters is depicted in Fig-
ure 1.
north
θ
a
b
M
Figure 1: Parameters of a rectangle as given in a DENM.
As mentioned, points in DENMs are given in
WGS-84 coordinates. However, for most mathemat-
ical operations, it is advantageous to deal with coor-
dinates in a 2-dimensional Cartesian coordinate sys-
tem. Additionally, units within the coordinate sys-
tem should be interpreted as meters, which simplifies
transferring sizes, like distances, lengths, and areas,
into the real world. Finally, such a coordinate system
can be interpreted as a two dimensional vector space
R
2
by using the coordinates of each point as compo-
nents of the position vector for that point.
For example, the UTM coordinate system, where-
as easting and northing can be interpreted as x- and
y-coordinates, respectively, is a possible choice.
However, handling of UTM coordinates is rather
challenging near the borders of UTM zones. Hence,
a possible solution is to use the distance from Green-
wich and the Equator as x- and y-coordinates, respec-
tively. Thus, assuming a radius r of the earth of, e. g.
6371007.2 meters, a WGS-84 coordinate with longi-
tude
λ
and latitude
ϕ
in radians is converted into a
point with coordinates (x, y) by applying
x = r· arccos(sin
ϕ
2
+ cos
ϕ
2
· cos
λ
) (1)
y = r ·
ϕ
(2)
whereas the sign of longitude has to be applied to x.
Consequently, such a point is converted back into a
WGS-84 coordinate by applying
ϕ
=
y
r
(3)
λ
= arccos
cos
x
r
−
sin
ϕ
2
cos
ϕ
2
(4)
and, respectively, applying the sign of x to longitude.
This coordinate system, of course, cannot be used in
a global manner, but in local scale, as needed for C2X
applications. It provides, in addition to fast position
transformation, high accuracy.
Hence, for the following, we assume that points
are given in or converted into UTM coordinates, or
any other coordinate system, that meets the men-
tioned requirements.
3 FINDING A RECTANGLE
SURROUNDING A GIVEN SET
OF POINTS
Many dangerous situations, e. g., a critical weather
situation such as heavy rains, are spread over a large
geographical area. Whenever a C2X application de-
tects such a situation the affected area has to be deter-
mined.
An intuitive way to do so is to record the driven
way by means of waypoints while passing through
the situation. After the whole situation is passed or
even after a certain time, a rectangle has to be cal-
culated that includes all of these waypoints. In Fig-
ure 2 such a use-case is depicted. This rectangle can
be used as relevance area in a corresponding DENM
for notifying other ITS stations about the detected sit-
uation. However, an appropriate destination area is,
e.g., given by just adding a suitable distribution off-
set to a and b, respectively.
Figure 2: A rectangle surrounding a recorded trace.
To calculate a rectangle around a given set of
points, the following steps have to be performed:
1. Since the sets of points may follow the course of
a street, it is most likely that they are ordered in a
line. Hence, the orientation of that chain of points
has to be determined.
ICINCO2013-10thInternationalConferenceonInformaticsinControl,AutomationandRobotics
576
2. Since the line will not be perfectly strait, the width
of the surrounding rectangle has to be calculated.
3. Afterwards, the length of the rectangle has to be
determined.
4. Finally, out of these data, the parameters M, a, b,
and
θ
as used in a DENM are to be achieved.
These steps are detailed in the following.
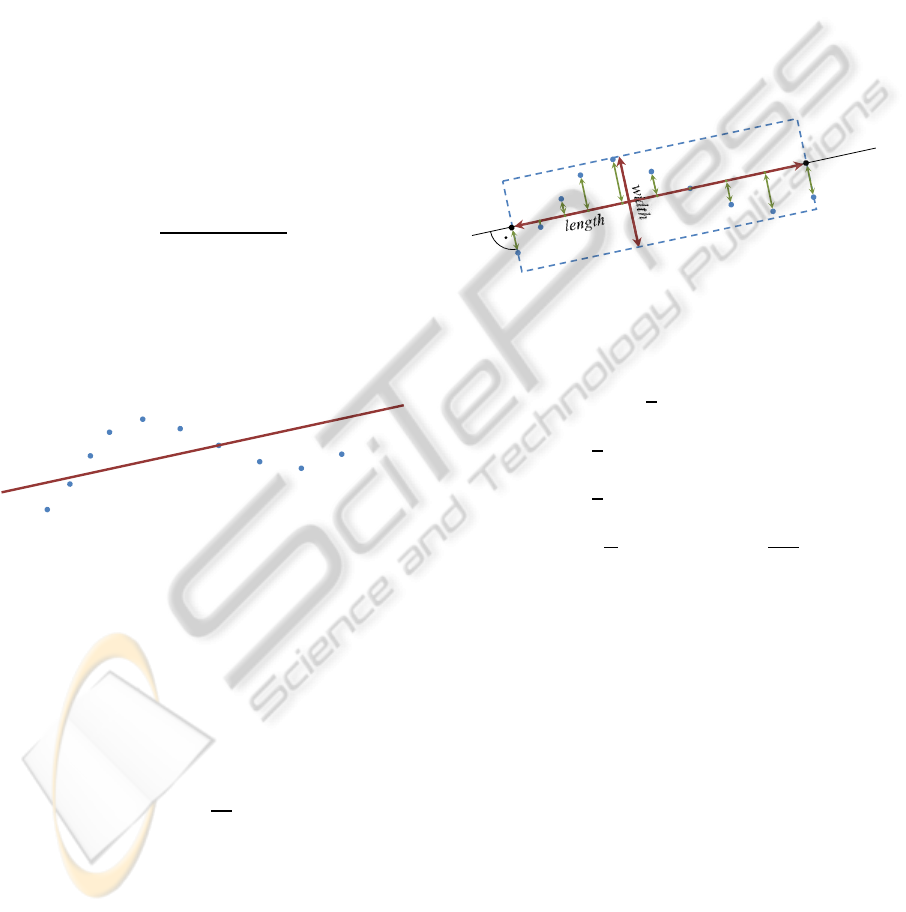
To obtain the main orientation of the arbitrary set
of points, a regression line through all points can be
calculated by using the method of least squares.
Thereby, for n points P
i
= (x
i
,y
i
) a regression line
g is defined by
g : y = m · x+
γ
(5)
If ¯x and ¯y are the means of the x- and y-coordinates
of all given points, respectively, m can be obtained by
applying
m =
∑
n
i
(x
i
y
i
) − n· ¯x¯y
∑
n
i
(x
2
i
) − n· ¯x
2
(6)
and
γ
by
γ
= ¯y− m¯x (7)
The main orientation of the points is now in the direc-
tion of this line, with the regression line in the middle
of the set, as depicted in Figure 3.
g
Figure 3: Regression line g in the middle of a given set of
points, e. g., a recorded trace.
To determine the width and the length of the rect-
angle we transfer the task into the vector space R
2
.
Therefore, while using the numerator and denomina-
tor of m, the vector~v is given by
~v =
−(
∑
n
i
(x
2
i
) − n· ¯x
2
)
∑
n
i
(x
i
y
i
) − n· ¯x¯y
(8)
and thus the vector~n by
~n =
~v
|~v|
(9)
Hence, with constant c given by
c =
0
γ
·~n (10)
the distance d from an arbitrary point P, with position
vector
~
P, to line g can be achieved by
d =
~
P·~n− c
(11)
Thus, the width of the rectangle is the double of the
largest distance d
i
of any point P
i
of the given set of
points to the regression line g.
To achieve the length of the rectangle, we calcu-
late for every point P
i
the corresponding point F
i
given
by
~
F
i
=
~
P
i
− d ·~n (12)
Hence, the length of the rectangle is equal to the
length of the vector~u given by
~u =
~
F
max
−
~
F
min
(13)
whereas, F
max
and F
min
are the two points with max-
imal and minimal x-component values, respectively,
as depicted in Figure 4.
g
F
min
F
max
Figure 4: Calculation of a surrounding rectangle.
Since the rectangle is known now, the parameters
as used in a DENM can be calculated by
M = F
min
+
1
2
·~u (14)
a =
1
2
· length (15)
b =
1
2
· width (16)
θ
=
π
2
− atan2(u
2
,u
1
)
·
180
π
(17)
whereas it has to be ensured that 0 ≤
θ
< 360 holds,
by adding 360 to
θ
if
θ
is negative. Additionally, if
needed, the corners E
1
to E
4
of the rectangle can be
calculated by each adding and subtracting d
i
·~n to F
min
and F
max
, respectively.
Although the presented algorithm is motivated by
the need to calculate a rectangle around a recorded
trace, the steps are applicable for any arbitrary set of
points.
4 VERIFYING THE POSITION OF
A POINT
In many cases a C2X application needs to calculate,
if some arbitrary point, e. g., the vehicles position, is
located inside or outside a given area.
If the area is, e. g., a circle, it has to be veri-
fied whether the distance to the center of the circle
NovelTechniquestoHandleRectangularAreasinCar-to-XCommunicationApplications
577

is smaller or larger than the radius of the circle. How-
ever, C2X use-cases like, e. g., the Weather Hazard
Warning application, uses arbitrarily oriented rectan-
gles, whereas the mentioned calculation is not given
by just a simple comparison. Consequently, in this
section a method is presented to verify whether a
given point P is located inside or outside a given rect-
angle.
According to Section 2, the point P is element of
the two dimensional vector space R
2
. Hence, its com-
ponentsare givenaccordingto a standard orthonormal
basis E with origin O and its two basis vectors
~e
1
=
1
0
, ~e
2
=
0
1
(18)
The basic idea behind the presented method is to
transform the components of P into another coordi-
nate system B, whereas the verification can be done
by a simple comparison.
One possible solution for such a basis B is given
by the rectangle and its parameters, i. e., M, a, b, and
θ
, to which the point has to be compared to. Thereby,
the origin of B is set to the center M of the rectangle,
whereas the two basis vectors
~
β
1
=
b
11
b
21
,
~
β
2
=
b
12
b
22
(19)
are oriented in parallel to the borders of the rectangle
with a length of a and b, respectively. Figure 5 depicts
such a basis B in comparison to E.
e
⃗
1
e
⃗
2
β
1
β
2
M
O
E:
B:
Figure 5: Standard orthonormal basis E in comparison to a
basis B defined by a rectangle.
Now, the origin of basis B is given directly by the
center point M, but the basis vectors
~
β
1
and
~
β
2
have
to be determined accordingly.
Therefore, let
ϕ
be the radian of
θ
such that
ϕ
=
θ
·
π
180
(20)
Accordingly, the vector~v is given by
~v =
cos
ϕ
sin
ϕ
(21)
Thus, the vectors~n and~u can be achieved by
~n =
~v
|~v|
(22)
and
~u =
−2· a·
−v
2
v
1
−v
2
v
1
(23)
respectively.
However, if the rectangle is generated as depicted
in Section 3 according to the used nomenclature and
definitions, vectors~n and~u are known already and do
not have to be calculated again.
Despite the way ~n and ~u are achieved, the basis
vectors of B are determined by applying
~
β
1
=
1
2
·~u (24)
~
β
2
= b·~n (25)
Consequently, to transform the position vector of an
arbitrary point P given according to E into its equiva-
lent in B, a transformation matrix T
E
B
T
E
B
=
t
11
t
12
t
21
t
22
(26)
is needed. Since that matrix is identical to the inverse
of the concatenation of the two basis vectors of B
T
E
B
=
t
11
t
12
t
21
t
22
= (
β
1
β
2
)
−1
=
b
11
b
12
b
21
b
22
−1
(27)
the system of equations
~e
1
= t
11
·
~
β
1
+ t
12
·
~
β
2
(28)
~e
2
= t
21
·
~
β
1
+ t
22
·
~
β
2
(29)
has to be solved to achieve the four components of the
2× 2 transformation matrix T
E
B
.
However, with q defined as
q = b
11
· b
22
− b
12
· b
21
(30)
the solution is given by just applying
T
E
B
=
1
q
·
b
22
− b
21
−b
12
b
11
(31)
Hence, each point P, given according to E, can be
transformed into B by multiplying the position vector
with T
E
B
.
Due to the definition of B, the point P is located
inside the rectangle, if the absolute value of each of
its components is lower or equal to 1
|p
1
| ≤ 1 and |p
2
| ≤ 1 (32)
with respect to B. Thus, it is located on the border of
the rectangle if at least one of the absolute values of
its components is equal to 1
|p
1
| = 1 or |p
2
| = 1 (33)
Otherwise, P is located outside of the rectangle.
ICINCO2013-10thInternationalConferenceonInformaticsinControl,AutomationandRobotics
578
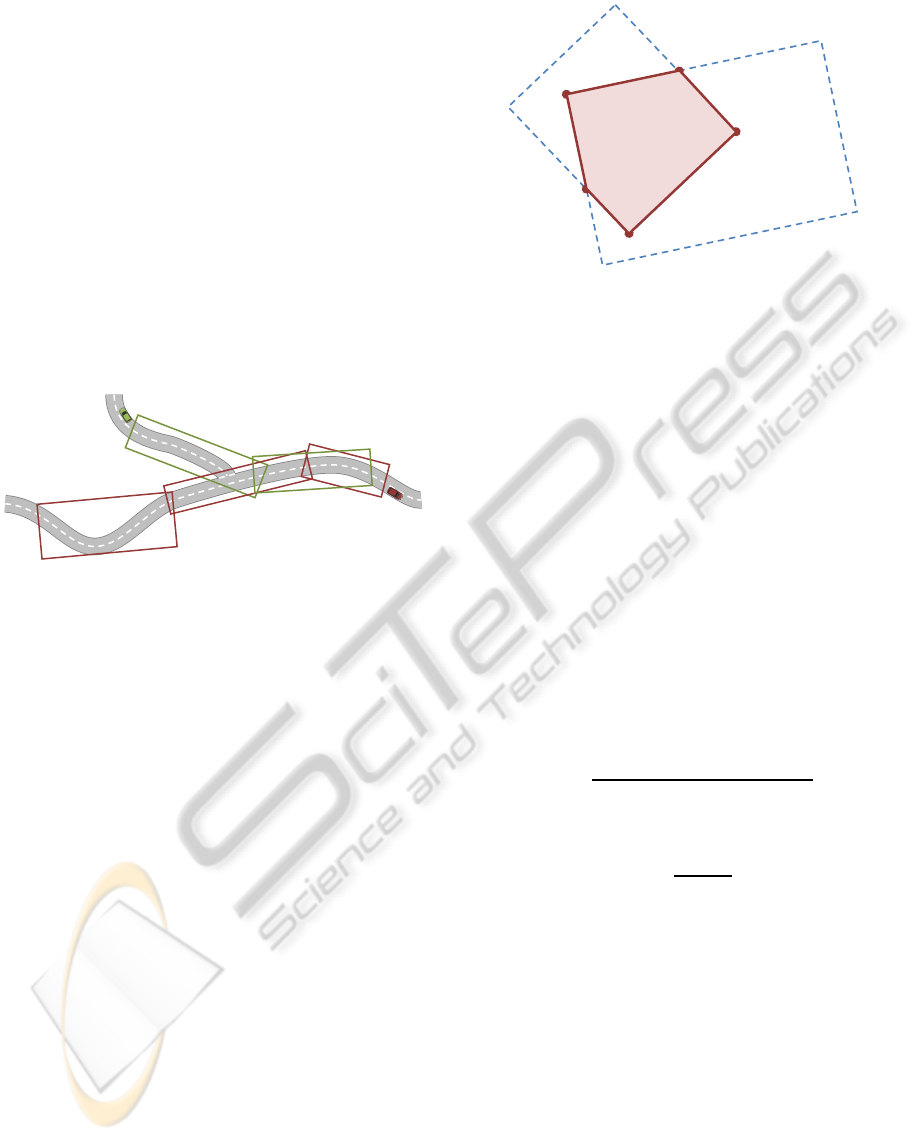
5 OVERLAPPING AREA OF TWO
RECTANGLES
Since many C2X applications, like the Weather Haz-
ard Warning application, may detect and report sit-
uations successively, a receiving ITS station has to
find such a relation in order to set up the whole event
out of multiple DENMs, each concerning just a small
part of the whole area. Additionally, since multi-
ple ITS stations may detect the same situation inde-
pendently from each other, neighboured ITS stations
receive multiple messages regarding either the same
event or the same part of the event. Such a situation is
illustrated in Figure 6, whereas two vehicles succes-
sively report partially overlapping areas of the same
event.
Figure 6: Multiple successively detected relevance areas of
one large event reported by two ITS stations.
Thereby, according to the two mentioned cases,
the areas may only overlap slightly, if they belong
to a successive reporting or may heavily overlap in
the case of the reporting from multiple ITS stations.
Within C2X applications, this distinction has to be
considered in order to decide whether the area of an
event has to be expanded or if a situation is confirmed
by another ITS station.
However,the algorithm used to define the overlap-
ping area between two rectangles is the same in both
cases mentioned above. Thereby, the following steps
have to be performed.
1. Find all intersection points S
j
of each of the four
borders of one rectangle with each of the four bor-
ders of the other rectangle.
2. Find all corners E
j
of each rectangle, that are lo-
cated inside the other rectangle, respectively.
3. The set of all found corners and intersection
points build the vertices of a non-self-intersecting
polygon of the overlapping area if they are or-
dered the right way.
4. Finally, the area of the polygon can be calculated
using the Gaussian trapezoid formula.
Such a polygon is illustrated in Figure 7, whereas the
enumerated steps are detailed in the following.
E
2
E
1
E
3
S
1
S
2
Figure 7: The overlapping area of two rectangles.
Finding the intersection points S
j
of the borders
of two rectangles is based on finding the intersection
points of lines in basic geometry. Thereby, since ev-
ery two points P and Q define a vector~u with
~u =
~
Q−
~
P (34)
and, thus, a line h with
h :~x =
~
P+
λ
~u (35)
for each border of a rectangle, a corresponding line is
defined by the adjacent corners.
Hence, for each two lines h and h
′
each defined by
the adjacent corners of two borders of two different
rectangles, an intersection point S is given by
~
S =
p
1
p
2
+
λ
u
1
u
2
(36)
if there is a solution for
λ
=
p
1
u
′
2
− p
2
u
′
1
− p
′
1
u
′
2
+ p
′
2
u
′
1
u
′
1
u
1
− u
′
2
u
2
(37)
Hence, with
λ
′
given by
λ
′
=
s
1
− p
′
1
u
′
1
(38)
S is an intersection point of the two borders, if
0 <
λ
< 1 and 0 <
λ
′
< 1 (39)
holds.
Thus, all needed intersection points S
j
can be cal-
culated by crosschecking all borders of two rectangles
for intersection points. This may into an empty set if
the rectangles do not overlap, or into at least two and
up to eight points if they do. However, the case the
rectangles do not overlap is not further regarded.
In Section 4 a method to determine whether a
point is located internal to a rectangle is presented.
This method is to be applied to all corners of the two
rectangles to achieve the corners E
j
that are located
inside the other rectangle and therefore form vertices
NovelTechniquestoHandleRectangularAreasinCar-to-XCommunicationApplications
579
of the polygon. This procedure may result in no or in
up to four points.
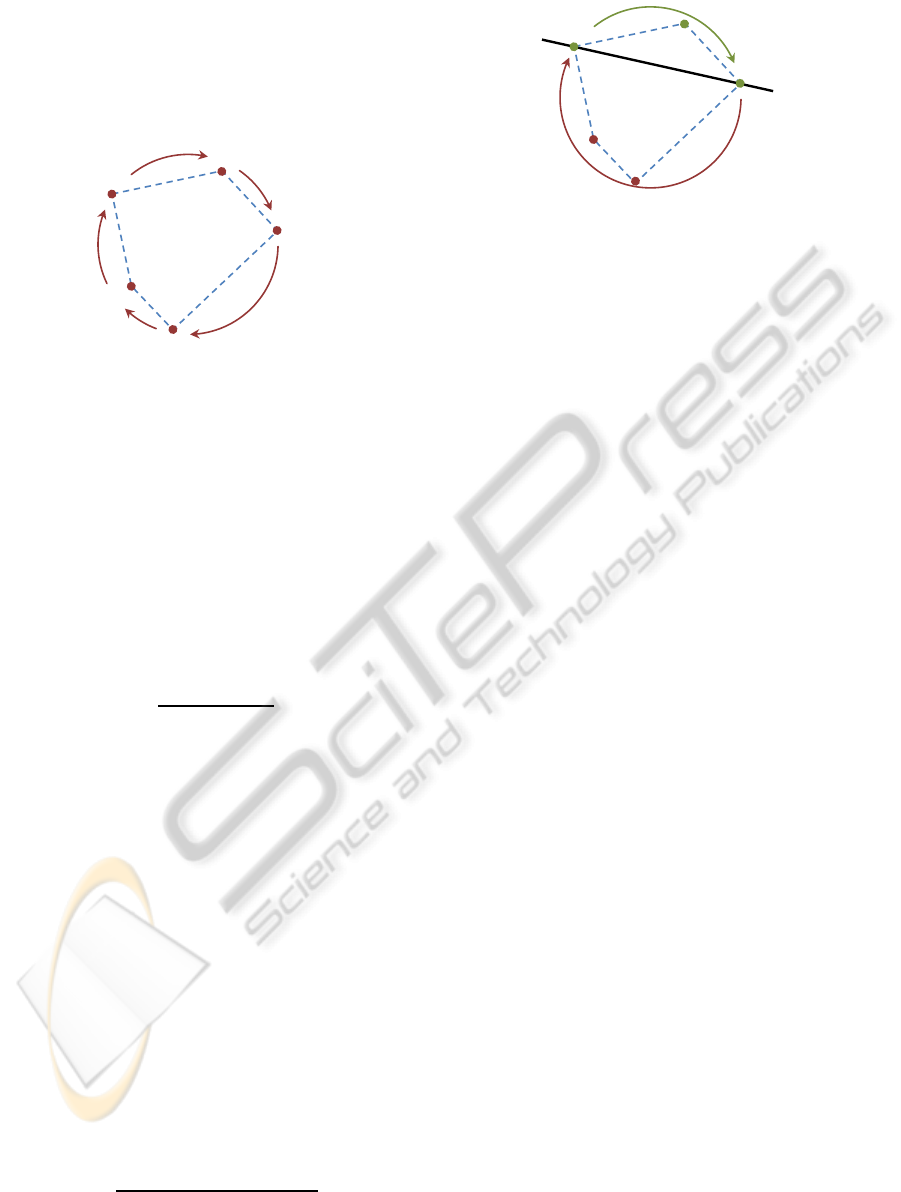
Thus, a total number of three up to eight points
can be found. These k points are the vertices V
1
to
V
k
of the overlapping polygon, if they are ordered ac-
cordingly as depicted in Figure 8.
V
3
V
1
V
4
V
2
V
5
Figure 8: A polygon with vertices ordered in turn.
Since the points S
j
and E
j
are arbitrarily ordered if
they are collected as described, the right ordering can
be achieved by ordering all points according to their
x-coordinate in the first place.
Afterwards, the points with the smallest and the
largest x-coordinateV
min
and V
max
, respectively, again
define a line. That line separates the set of remain-
ing points into two groups, G
1
and G
2
. Thereby, by
applying for every point V
i
δ
i
=
~
V
i
·~n− c (40)
with
~n =
v
min,2
−v
max,2
v
max,1
−v
min,1
v
min,2
−v
max,2
v
max,1
−v
min,1
(41)
and
c = v
max,1
· n
1
+ v
max,2
· n
2
(42)
each vertex featuring
δ
i
≥ 0 is located on the one side
of the line and, hence, it belongs to G
1
. In contrast,
each vertex with
δ
i
< 0 is located on the other side of
the line and, therefore, it belongs to G
2
.
Finally, by sorting the elements of both groups
again according to their x-coordinate, but reversing
the order of the elements of G
2
, the order of the ver-
tices V
1
to V
k
of the overlapping polygon is given by
appending the reversed list G
2
to the end of the or-
dered G
1
. This ordering is depicted in Figure 9.
Thus, the overlapping polygon and the order of its
vertices is known now. Consequently, all k vertices
V
j
= (x
j
,y
j
) with
V
k+1
= V
1
(43)
have to be applied to the Gaussian trapezoid formula
A =
∑
k
j
(x
j
+ x
j+1
) · (y
j+1
− y
j
)
2
(44)
to achieve the size A of the overlapping area.
V
3
= V
max
V
1
= V
min
V
4
V
2
V
5
G
2
G
1
Figure 9: Finally ordered vertices.
6 DISTANCE BETWEEN A POINT
AND THE BORDER OF A
RECTANGLE
After detecting a situation and its relevance area de-
noted by a rectangle, a corresponding DENM is sent
out and then received by neighboured ITS stations.
Hence, the receiving station may display a warning
to the driver while approaching the situation. Conse-
quently, the distance from the vehicle’s current posi-
tion to the border of the rectangle has to be calculated.
Thereby, of course, the distance has to be set to 0
if the vehicle is already located inside the rectangle,
which may be verified as detailed in Section 4. How-
ever, in other cases the distance can be calculated as
follows.
Since warnings are presented for upcoming events
only, the direction of driving, which is defined the
same way as
θ
, the clockwise angle to north, has to
be considered. Let
ω
be the radian of that direction of
driving. Additionally, a maximum warning distance
d
max
is assumed to be given by the use case or, e. g.,
according to the current vehicle speed. By applying
~w = d
max
·
sin
ω
cos
ω
(45)
a vector ~w is achieved, pointing into the direction de-
fined by the direction of driving and with a length of
d
max
.
Thus, the current vehicle position P and ~w define
a strait line g by
g : x(
λ
) =
~
P+
λ
·~w (46)
According to Section 5, each border of a rectangle
shares a line h. Following the detailed steps in Sec-
tion 5, the intersection points S
j
of all four borders of
the rectangle with the line g can be determined.
For each border sharing no intersection point with
g under the given constrains for
λ
, the distance can
be assumed to be infinite. However, for all detected
ICINCO2013-10thInternationalConferenceonInformaticsinControl,AutomationandRobotics
580
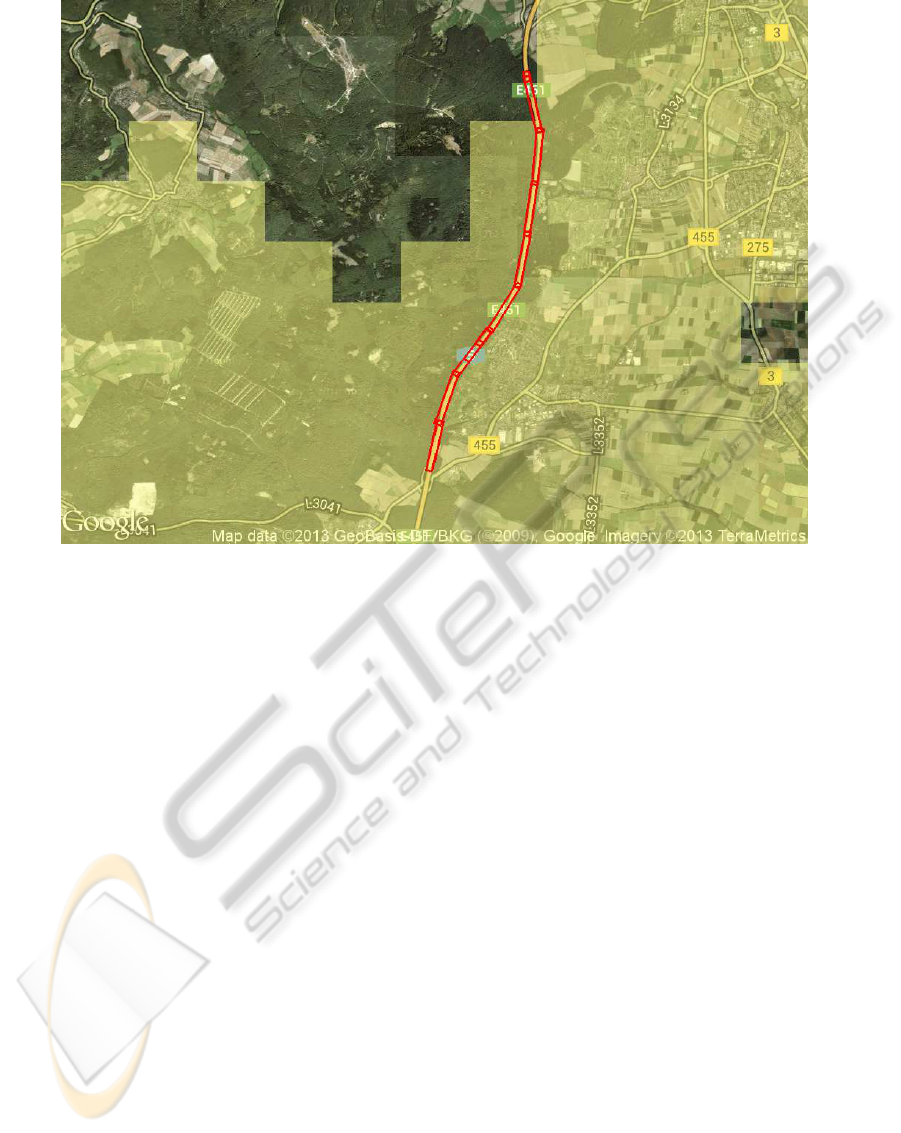
Figure 10: Result of a field operational trial test run exercising the proposed techniques.
intersection points S
j
, the distance d
j
to the vehicle’s
position is given by
d
j
=
~
P−
~
S
j
(47)
Hence, the distance from the vehicle to the nearest
border of the rectangle is the minimum of all calcu-
lated distances d
j
.
7 APPLICATION RESULTS
To prove functional correctness and accuracy of the
techniques, as presented in this work, under realistic
conditions, they are implemented and tested within
the Weather Hazard Warning applications in current
German, i.e., sim
TD
(sim
TD
, 2013), and European,
i. e., DriveC2X (DRIVE, 2013), large scale C2X com-
munication field operations tests. In Figure 10 some
results of a test drive near Frankfurt am Main, Ger-
many, carried out during the field operational test of
sim
TD
are visualized. While the colored part is a
heavy rain situation as reported by a rain radar ser-
vice, the rectangles of a successive reported rain event
are depicted along the highway.
During the test drive, a group of vehicles had
driven from north to south on the highway and are,
consequently, passing the rain weather condition in
that area. Thereby, the first vehicle serves as the de-
tecting vehicle, which initially detects the weather sit-
uation for the ITS system. The rectangular relevance
areas reported in DENMs by that vehicle are deter-
mined according to Section 3. In all following ve-
hicles the successive reported rectangular relevance
areas are joined to one single event by calculating
the overlapping area as described in Section 5 and,
hence, in each following vehicle a warning was dis-
played by checking the distance to the area according
to Section 6. The warning is finally canceled, when
the vehicle is entering the nearest situation where a
verification shows that the current vehicle position is
inside the rectangle according to Section 4.
8 CONCLUSIONS
In this work, we firstly discussed some methods to
represent geographical positions with respect to effi-
cient calculations. We then presented techniques to
determine a rectangle around a given set of arbitrary
points, to verify whether a point is inside or outside an
arbitrary oriented rectangle, to calculate the overlap-
ping area of two rectangles, and finally to determine
the distance between an arbitrary point and the nearest
border of a rectangle. All these tasks have to be solved
by a C2X application while handling rectangular rel-
NovelTechniquestoHandleRectangularAreasinCar-to-XCommunicationApplications
581

evance areas. Hence, the algorithms described in this
work can be used by function developers, researchers,
especially with scope on C2X communication, and,
maybe, other interested parties. Additionally, the pro-
vided ideas, methods, and implementations will serve
as a basis for standardization and the upcoming mar-
ket launch of C2X systems in near future.
REFERENCES
C2C-CC (2007). C2C-CC Manifesto. CAR 2 CAR Com-
munication Consortium.
DRIVE (2013). Project Website. DRIVE C2X consortium.
http://www.drive-c2x.eu/.
ETSI (2010a). Intelligent Transport Systems (ITS); Vehicu-
lar Communications; Basic Set of Application; Part 3:
Specification of Decentralized Environmental Notifi-
cation Basic Service. ETSI TS 102 637-3. European
Telecommunications Standards Institute.
ETSI (2010b). Intelligent Transport Systems (ITS); Vehic-
ular Communications; Basic Set of Applications; Part
1: Functional Requirements. ETSI TS 102 637-1. Eu-
ropean Telecommunications Standards Institute.
ETSI (2010c). Intelligent Transport Systems (ITS); Ve-
hicular Communications; Geographical Area Defini-
tion ETSI EN 302 931. European Telecommunications
Standards Institute.
IEEE (2010). Wireless LAN Medium Access Control
(MAC) and Physical Layer (PHY) Specifications,
Amendment 6: Wireless Access in Vehicular Environ-
ments. IEEE Std. 802.11p. Institute of Electrical and
Electronics Engineers, Inc.
Jaeger, A. and Huss, S. A. (2011). The weather hazard
warning in simtd: A design for road weather related
warnings in a large scale car-to-x field operational test.
11th IEEE International Conference on Telecommuni-
cations for Intelligent Transport Systems (ITST-2011).
St. Petersburg, Russia.
sim
TD
(2013). Project Website. Safe and In-
telligent Mobility – Test Field Germany.
http://simtd.de/index.dhtml///enEN/.
St¨ubing, H. and Jaeger, A. (2010). Secure beam-forming for
weather hazard warning application in car-to-x com-
munication. Design Methodolo-gies for Secure Em-
bedded Systems, Lecture Notes in Electrical Engineer-
ing 78:187–206.
ICINCO2013-10thInternationalConferenceonInformaticsinControl,AutomationandRobotics
582
