
Towards a “Holistic” Safety Monitoring in Intelligent Vehicle Control
Tim K
¨
ohler
1
and Martin Schr
¨
oer
2
1
DFKI GmbH, Robotics Innovation Center, Bremen, Germany
2
University of Bremen, Robotics Research Group, Robert-Hooke-Straße 5, 28359 Bremen, Germany
Keywords:
Intelligent Vehicle Control, Car Safety, Electric Vehicle, Model-Based Prediction, Fault Detection, Human-
Machine Interface.
Abstract:
Today, the state of the art in vehicle safety follows an explicit design flow. Specific sensors measure a particular
dimension (e.g. distance to other vehicles) and “safety” is defined as a specific range of allowed values (e.g.
minimal distance). The disadvantage of such an approach is that safety issues which were unconsidered
at design time are not detectable. Furthermore, a detection of issues that are only indirectly measurable is
difficult to realize. In this paper, a holistic safety monitoring approach is presented that makes use of all
available sensor data and tries to find an implicit definition of “safety”. By such an inverse approach vehicle
safety issues which are hard to be directly measurable might be detectable, too. For instance, an identification
of driver-initiated critical situations (e.g. caused by distraction) could be possible if taking multiple sensor
modalities into account and having an implicitly defined “safe” state.
Furthermore, the article describes the selection of potential test platforms and shows already collected test data
of a mobile robot platform. Presented in this work-in-progress paper is the concept of definition, implementa-
tion, and detection of implicit vehicle safety.
1 INTRODUCTION
Intelligent vehicle safety mechanisms are currently
following an explicit design: safety is designed ex-
plicitly in specific modalities. For example, distance
sensors measure explicitly the distance to other vehi-
cles or obstacles in the vicinity and “safety” is defined
as a certain minimum distance related to the current
speed. For lane-keeping assistants and airbags it is the
same, having “safety” defined as certain thresholds of
distances/angles or accelerations, respectively.
While these methods ensure a safe state in the
respective modality, the question arises if a general,
multi-modal definition of safety is possible (and de-
tectable), too. The point is that on the one hand side a
combination of several slightly increased safety mea-
sures may – altogether – indicate a critical safety issue
while on the other hand a single threshold exceeding
might be tolerable. Besides, such a “holistic safety
monitoring” could perhaps even cover cases which
are not known at design time. As the driver’s be-
haviour influences the system and its sensor readings,
it could be possible (up to a certain extent) to detect
driver-initiated safety issues, too.
Furthermore, in single-modality setups a drop out
of a single sensor is a potential cause for a “false-
positive” triggering of a safety mechanism or for a
“false-negative” rejection of executing safety means.
Addressing such drop-outs, the field of fault detec-
tion, isolation, and recovery arose. Here, implicit or
explicit models are used to generate predictions (ex-
pectations) of monitored sensor states. By the differ-
ence between expectation and measured value, mis-
behaviour can be detected. Using a (learnable) model
for multi-modal predictions and a multi-modal evalu-
ation is a candidate for a holistic safety monitoring.
In the following two sections, related work and a
proposition for a holistic safety monitoring system is
described. In section 4 sample data of a mobile robot
is shown. The section 5 presents potential vehicles to
test the proposed system. In the last section a conclu-
sion and an outlook are given.
2 RELATED WORK
One typical class of vehicle safety systems focuses on
the detection of particular safety-harming conditions.
In case of detection, either the driver is warned or the
system triggers a fixed pre-defined countermeasure.
583
Köhler T. and Schröer M. (2013).
Towards a “Holistic” Safety Monitoring in Intelligent Vehicle Control.
In Proceedings of the 10th International Conference on Informatics in Control, Automation and Robotics, pages 583-588
DOI: 10.5220/0004633905830588
Copyright
c
SciTePress
control
commands traction
ext. forcesacceleration
visual feedback sensory feedback
Driver Environment
Monitoring
Model Based Prediction
Vehicle
Figure 1: Overview of the proposed safety monitoring.
A recent example for this class is the pedestrian de-
tection method presented by Van Beeck et al. in 2012
(Van Beeck et al., 2012).
A learned generation of expectations of sensor
consequences was published by Pastor et al. (Pastor
et al., 2011). Based on sensor training data, expec-
tations (mean and variance) are learned. The appli-
cation presented in that publication is a manipulating
two-arm robot.
In the field of fault detection and identifica-
tion several model-based approaches have been pre-
sented. The specific case of combining multiple sen-
sor modalities and learning the model was studied, too
(K
¨
ohler et al., 2013). But the objective in approaches
like that one is different: There, a fault, e.g. drop out,
of a part of the system is to be detected while in vehi-
cle safety monitoring a certain state or range of states
in correct sensor readings is to be found. However, the
proposed methods for fault detection are good can-
didates to be adapted for the application of vehicle
safety monitoring.
3 LEARNING AND EVALUATION
OF VEHICLE STATE
The main components needed for the proposed safety
monitoring are a) a learnable and multi-modal model,
b) predictions (“expectations”) based on the model,
and c) a monitoring and triggering mechanism to de-
tect “unsafe” or “unusual” conditions. In figure 1 the
single components are depicted.
Different methods of model and expectation gen-
eration have been studied in previous work (to be pub-
lished). These methods have been tested on a four-
wheeled mobile robot. Their application to a human-
driven vehicle needs to be tested. However, the sensor
modalities used there are a subset of the modalities
to be used in a vehicle safety system (see sections 4
and 5). Examples of such explicit vehicle safety
systems are anti-lock braking system (ABS), elec-
tronic stability control (ESC), traction control sys-
tem (TCS) / anti-slip regulation (ASR), airbag, intel-
ligent speed adaptation (ISA) / distance warning / dis-
tance control, lane departure warning system (LDWS)
/ lane keeping assist, and driver attention monitor.
These systems use single sensor modalities and are
designed aiming for a particular unsafety condition
(and triggering a particular safety measure). The sen-
sor modalities needed in the mentioned examples are
wheel speeds, accelerations and gyroscopes, distance
sensors, and cameras. These are typical candidates
for the “sensory feedback” data in figure 1.
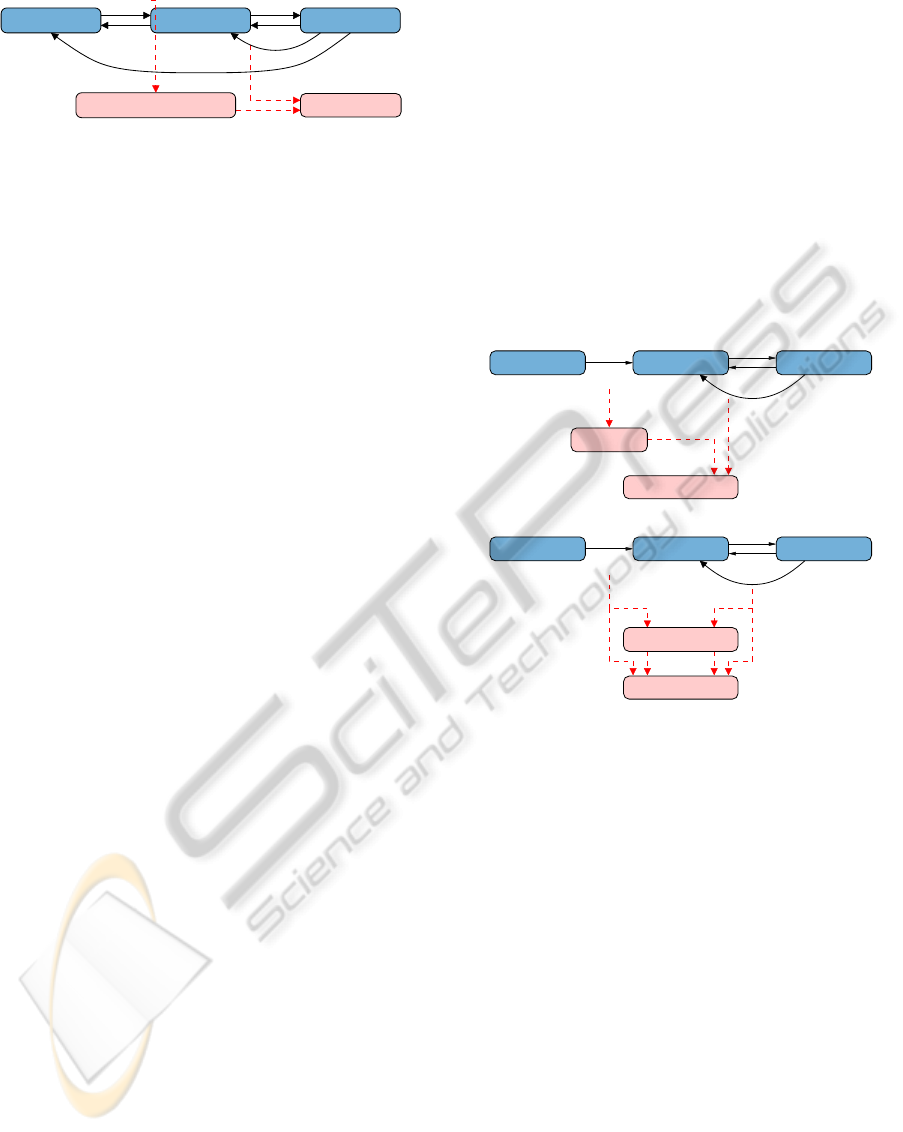
Figure 2 shows two different modes of using mod-
els for the prediction and monitoring. In mode 1, the
model covers the loop from the control commands to
the sensor feedback. Commands given by the driver
are used to generate expectations of the sensor feed-
back. The monitor compares these predictions with
the actual measurements of the sensors.
traction
ext. forces
traction
ext. forces
control
comands
sensory feedback
control
comands
sensory feedback
Driver EnvironmentVehicle
Mode 2:
Driver EnvironmentVehicle
Mode 1:
Monitoring
Model
predicted feedback
prediction
Monitoring
Model
Figure 2: The proposed safety monitoring could be run in
two different modes.
In mode 2, the commands and the sensor feed-
back are used to generate an estimation derived from
the learned model. Furthermore, the model generates
expectations for the sensor readings and the motion
commands. The expectation of motion commands
can be used to identify unusal driver behaviours.
In both modes, the monitoring can be realized by
either a distance computation (e.g. euclidean dis-
tance of normalized vectors) and comparison with a
fixed threshold or a standard deviation based adapt-
able threshold.
Model-based prediction and monitoring can be
used targeting different objectives. One possibility
is, to have a particular detection (and potentially re-
action) in mind. As an example, a model trained to
a specific driver’s steering, accelerating, or breaking
behaviour can be used to detect conditions where ad-
ditional steering forces or a virtual “kick-down” is
applied for comfortability purposes, or an emergency
breaking is triggered earlier then standard if a driver
usually tends to be more conservative when deceler-
ICINCO2013-10thInternationalConferenceonInformaticsinControl,AutomationandRobotics
584
ating.
A second possibility is to target a specific device
or function but to not define the unusual/unsafe case
(and neither the appropriate reaction). An example
is to monitor a specific device like the battery of an
electric vehicle (EV). However, the model is trained
with the usual normal operating behaviour (in case of
the battery in terms of voltage, current, temperature).
This example is selected as a use-case described in
section 4.2.
Finally, the third possibility is to take multiple or
all available (sensor and acutator) modalities to train
the model with usual, i.e. normal, expected behaviour.
After learning the model, deviations from expecta-
tions could be detected – independend of the reason
for the deviation and without any knowledge needed
at design time.
4 EXAMPLARY EXPERIMENTAL
DATA
First experimental results have been collected with
a mobile robot platform. The robot is not compa-
rable to combustion-engined or electric vehicles in
terms of size, weight, typical and maximum veloci-
ties, and typical and maximum accelerations. How-
ever, it serves as a first testbench for the study and
selection of potential sensor modalities.
To test the methods and sensor modalities studied
on the mobile robot, different vehicle platforms are
proposed (see section 5). As a first demonstrational
use-case, a battery defect or battery handling error of
a standard electric vehicle (EV) is chosen.
4.1 Motion Test Data of a Mobile Robot
Three methods for model generation and prediction
have been tested in previous work (to be published).
The test setup used was a four-wheeled and skid-
steered mobile robot. As sensors wheel encoders, ac-
celerometers, and gyroscopes were used.
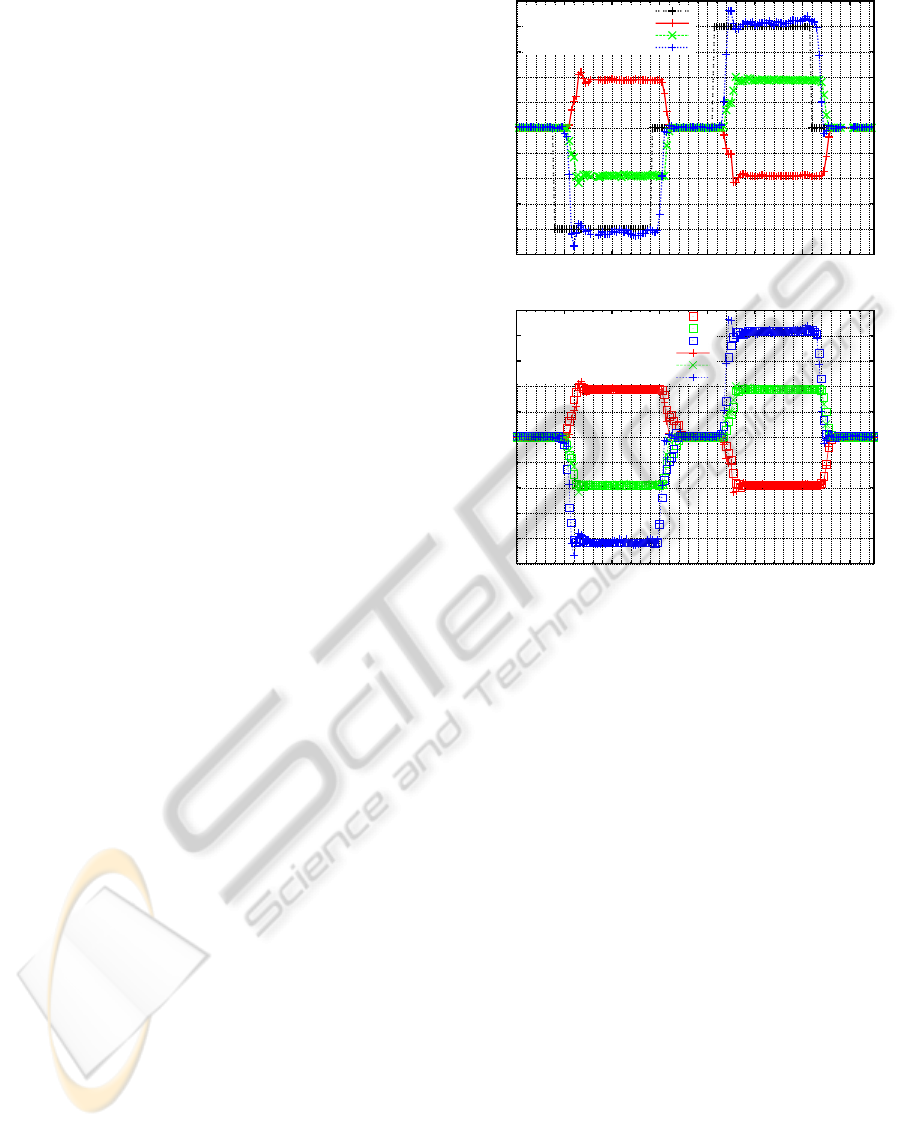
In figure 3 example data of a turning of the plat-
form is shown. As can be seen, a change of the
motion command (e.g. starting to turn) is followed
by changes in the different sensor modalities with
potentially varing latencies. The sensor response
behaviours may depend on vehicle-related parame-
ters (weight, load, engine power, technical malfunc-
tions) or external conditions (environment, street con-
ditions, obstacles).
For the second plot in figure 3, the sensor data
of multiple turning trials have been used to train a
model of the actuator–sensor relationship. Based on
-1
-0.8
-0.6
-0.4
-0.2
0
0.2
0.4
0.6
0.8
1
0 2 4 6 8 10 12 14
Sensor Response [digit]
Time [s]
Motion Cmd (Rot.)
Left wheel vel
Right wheel vel
Gyro Z axis
-1
-0.8
-0.6
-0.4
-0.2
0
0.2
0.4
0.6
0.8
1
0 20 40 60 80 100 120 140
Sensor Response [digit] / Prediction [digit]
Sample [Index]
Left wheel vel (prediction)
Right wheel vel (prediction)
Gyro Z axis (prediction)
Left wheel vel
Right wheel vel
Gyro Z axis
Figure 3: Example plot of measured and predicted sensor
data of a turning mobile robot.
the learned model predictions, i.e. expectations, of
the sensor responses are generated and are plotted
alongside the real measured data in the plot on the
right. Depending on the method used to generate the
model and depending on its parameters, expectations
and measured sensor values match better or worse.
The results of different methods and test conditions
have been compared in previous work.
4.2 Test Case Scenario: EV Battery
For electric vehicles the battery is one of the parts be-
ing most crucial for the vehicle’s function. Due to the
fact electric drives are more robust and simpler than
combustion engines they do not need an as extensive
monitoring as combustion engines demand. On the
other hand, the batteries used in electric vehicles are
more complex than their siblings used in combustion
engine vehicles.
The values to be monitored for a proper opera-
tion of the vehicle differ a lot (in selection and be-
haviour) between common combustion engines and
electrically driven ones. Whereas in combustion en-
gines the values to be monitored, e.g. fuel level, oil
Towardsa"Holistic"SafetyMonitoringinIntelligentVehicleControl
585
242
245
248
idle state
Temperature (°C)
-0.2
0
0.6
Current (A)
371
371.4
371.8
372.2
Voltage (V)
80
85
90
0h
1h
2h
3h
4h
5h
6h
SoC (%)
242
245
248
charging
-5
-4
-3
-2
-1
0
1
370
375
380
80
85
90
0h
1h
2h
3h
4h
5h
6h
242
245
248
driving
-20
0
20
60
120
240
300
360
80
85
90
0m
5m
10m
15m
20m
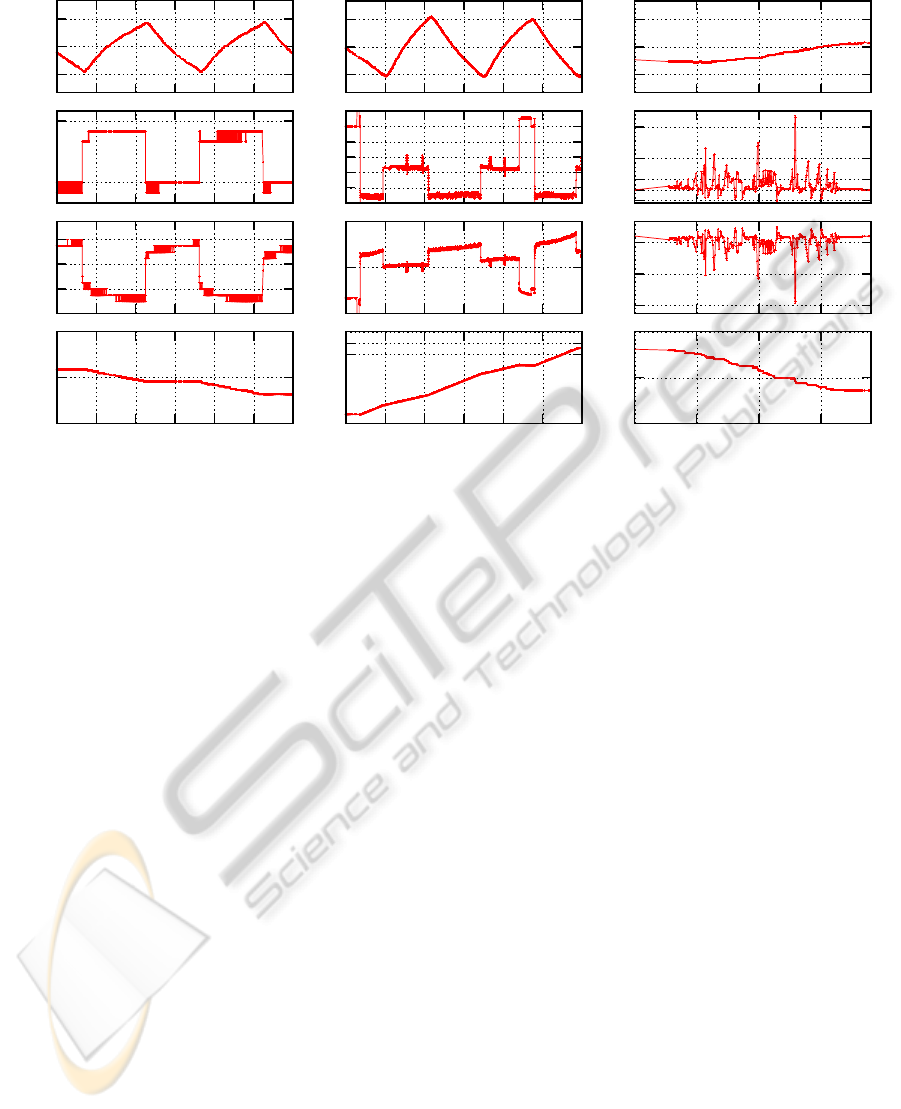
Figure 4: Values measured for an electric vehicle’s traction battery (Na-NiCl) in various operation states.
pressure, and motor temperature do only vary slightly
in a proper operation, therefore mostly have to be
monitored for being within certain boundaries, the
corresponding values of a traction battery in an elec-
tric vehicle, e.g. battery state of charge, voltage, cur-
rent, and temperature tend to show a lot more variance
– even in idle states (see figure 4).
This is due to the fact that (depending on the type
of battery) certain values have to be kept inside cer-
tain ranges for a proper operation at all times. E.g.,
the Na-NiCl battery whose data is depicted in figure 4
has to maintain a certain operation temperature (ap-
prox. 245
◦
C), so even in idle states there has to be
a certain flow of current (for the corresponding bat-
tery heating element). This load also has an influence
on the voltage measured. Thus, the different sensor
signals may vary a lot during normal operation, but
certain variations may be allowed only in a specific
state.
Obviously, those rather specific conditions for a
proper operation are hardly to supervise just monitor-
ing some thresholds as typically encountered in com-
mon combustion engine driven cars. Instead, learning
a model of the battery parameters and state-related
parameters like driver commands or motor current
could lead to a relatively simple solution. Com-
paring model-based predictions and sensor measure-
ments could allow a detection of many possible faults
or handling errors, like for instance a battery heating
defect, different kinds of battery defects, a (poten-
tially unwanted) initialization of the battery storage
mode, or a defect in the battery charging control. Us-
ing the proposed approach, the specific defect or its
influence to the measured parameters not necessarily
needs to be known. Of course only such problems
can be detected that lead to deviations in one or mul-
tiple of the monitored parameters of the ”‘normal”’
state previously learned. However, a defect that does
not lead to measurable deviations in those parameters
might be considered as negligible.
5 VEHICLE SETUPS FOR DATA
COLLECTION AND TESTS
Two setup categories have been selected as suitable
test and data collection platforms. The first one are
standard electric vehicles (EV). The use of electric
vehicles compared to combustion-engined vehicles is
advantageous because of accessible interfaces on the
actuation and the sensing side of the engine. Using
standard EV in serial production supports a transfer-
ability of the results to later applications.
On the other hand, a more complex vehicle setup
with additional sensor modalities might yield a more
reliable safety detection. Therefore, in the second
setup category a more complex vehicle with 23 DOFs
was chosen.
ICINCO2013-10thInternationalConferenceonInformaticsinControl,AutomationandRobotics
586
5.1 Electrically Driven Common
Vehicles
Even though todays modern cars already feature a
large number of electrical sensors the data collected
by those sensors is generally rather sparsely used. Es-
pecially many warning and error notifications are im-
plemented in a very basic and mostly linear way.
For instance, if the oil level of a common com-
bustion engine car reaches a certain – pre-defined –
critical value, some warning light flashes up, signal-
ing a certain urge to act to the user, e.g. to add some
oil. This way of using the sensor data works fine to
indicate a problem that had become present; but it
remains unclear why and when it actually did arise.
This poses the potential issue that the specific prob-
lem can be solved, but without knowing why it did
arise it may as well occur again soon.
Additionally, there are certain states to be con-
sidered critical which do arise from a certain com-
bination or succession of rather minor effects – none
of which would have to exceed their individual fixed
critical value and therefore wouldn’t be detectable.
Also, other effects like excessive wearing of certain
components is detected only when its wear level even-
tually hits a critical value, ignoring the actual source
of the excessive wearing itself.
The concept presented in this article supplies an
approach to solve those difficulties. Using a defini-
tion of normal operation over the specification of cer-
tain fixed critical values enables to detect “unusual”
or “deviating” states of operation as outlined in the
examples stated before. Beyond those rather vehicle-
focused applications the concept also allows to moni-
tor the driver’s behaviour, resp. driving performance,
e.g. by contrasting the current state of operation by
the driver against a certain “normal” state for detec-
tion of emergency or high stress states (e.g. extraor-
dinarily strong braking, accelerating or steering be-
haviour) to which then appropriate reactions can be
applied.
Duchrow et al. (Duchrow et al., 2012) presented
a system for large-scale recording and analysis of EV
fleet data. The data (like vehicle GPS position and
battery state) is stored in a central data base. Such
a large data base allows for additional fruitful uses
like a definition of the normal/safe states needed for
the concept based on the multiple data sources (e.g.
vehicles normally operated, in terms of interindivid-
ual comparison), wear level monitoring (in terms of
intra-vehicle runtime data comparison) or driver per-
formance monitoring (in terms of intra-personal com-
parison) to just name some of the possible applica-
tions. The example data shown in section 4.2 is taken
from this large-scale data base, too.
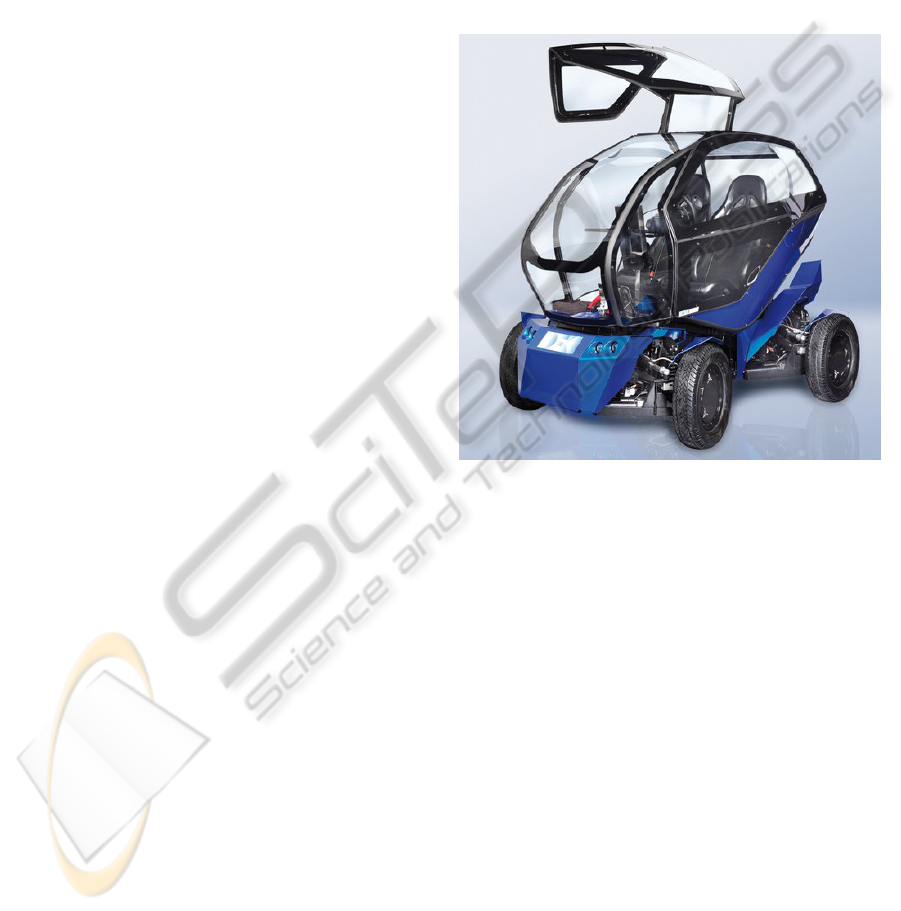
5.2 Multi-DOF Electric Vehicle
A more complex vehicle like the multi-DOF vehicle
EO smart connecting car (EO scc, (Jahn et al., 2012))
not only allows for the implementation of additional
sensors and the monitoring of extra data sources; its
complexity also requires a more complex interface for
its operation.
Figure 5: The electric vehicle EO scc (Jahn et al., 2012)
which serves as a scentific test platform (
c
DFKI GmbH,
Foto: PR Fotodesign).
It can be compared to the large amount of instru-
ments and gauges in an aircraft which have to be mon-
itored by the pilot. Whereas only some of those ele-
ments have to be permanently monitored, all of them
can become important in certain situations and are
therefore present in the pilots viewing area. It can be-
come somewhat difficult to decide which element is
of importance and has to be observed, which explains
the rather extensive training that is needed to learn the
correct operation of such a vehicle.
The approach presented in this article can help in
such situations, as it can be used to monitor even the
slightest deviations from the state of normal opera-
tion, which can then be used to emphasize the corre-
sponding operation element.
For instance, instead of having a large variety of
instruments and gauges to monitor and use at the same
time (or, to be more specific: to decide from what to
observe and use), the pilot or driver would only have
to observe those elements that have been detected to
be of special importance or showing a deviation from
Towardsa"Holistic"SafetyMonitoringinIntelligentVehicleControl
587

the normal state of operation, posing a great value of
assistance in the operation of such rather complex ve-
hicles.
Technically, the EO scc would be a suitable plat-
form because of its way of implementation. Be-
ing more similar to a mobile robot than to an EV
the control is implemented in software on embedded
PC hardware. It uses the robot software framework
“Rock” which is used for the tests described in sec-
tion 4.1, too. Though such a system may yet not be-
ing suitable for usr in standard vehicles made in serial
production; being a scientific test platform it allows
even larger system changes in software or hardware
with minimum additional effort.
6 CONCLUSION AND OUTLOOK
Presented was the concept of a holistic, model-based
safety monitoring system for the application of intelli-
gent vehicle control. Two main properties are a waiv-
ing of an explicit definition of unsafety and an inte-
gration of potentially multiple modalities (up to all
available sensor and actuator modalities). Instead of
defining an unsafe condition it is tried to learn the safe
state (measured by one or muliple sensors). By this,
in the application of the learned system any deviation
from the “safe” (learned) state of a sufficent degree
can be detected. This includes conditions which are
not known at design or learning time.
The integration of multiple different modalities
is supposed to a) allow to detect unsafe conditions
which are hardly detectable on a single modality but
which are pronounced on the whole set of measure-
ments or to b) reject safe conditions which cause
strong deviations on single modalities but none on
other sensor readings.
As main components a learnable model, a predic-
tion generation based on the model, and a monitor-
ing of predictions (expectations) and measured sensor
values are proposed. Besides the concept, a use-case
aiming at potential electric vehicle defects or misop-
erations is presented.
After finishing tests of the proposed methods on a
mobile robot platform, the same methods have to be
tested with data collected on electric vehicles men-
tioned in this paper.
ACKNOWLEDGEMENTS
Supported by the Federal Ministry of Economics and
Technology on the basis of a decision by the German
Bundestag, grant no. 50RA1113 and 50RA1114.
REFERENCES
Duchrow, T., Schr
¨
oer, M., Griesbach, B., Kasperski, S.,
Bermpohl, F., Kramer, S., and Kirchner, F. (2012).
Towards electric mobility data mining. In Electric
Vehicle Conference (IEVC), 2012 IEEE International,
pages 1–6. IEEE.
Jahn, M., Schr
¨
oer, M., Yoo, Y.-H., Y
¨
uksel, M., and Kirch-
ner, F. (2012). Concept of actuation and control for
the eo smart connecting car (eo scc). In Su, C.-Y.,
Rakheja, S., and Liu, H., editors, Intelligent Robotics
and Applications, volume 7506 of Lecture Notes in
Computer Science, pages 87–98. Springer Berlin Hei-
delberg.
K
¨
ohler, T., Bergh
¨
ofer, E., Rauch, C., and Kirchner, F.
(2013). Sensor fault detection and compensation in
lunar/planetary robot missions using time-series pre-
diction based on machine learning. In Proc. IJCAI-
13 Workshop on Artificial Intelligence in Space. (ac-
cepted).
Pastor, P., Kalakrishnan, M., Chitta, S., Theodorou, E., and
Schaal, S. (2011). Skill learning and task outcome
prediction for manipulation. In Robotics and Automa-
tion (ICRA), 2011 IEEE International Conference on,
pages 3828–3834.
Van Beeck, K., Goedem
´
e, T., and Tuytelaars, T. (2012). A
warping window approach to real-time vision-based
pedestrian detection in a trucks blind spot zone. In
Proceedings of the ninth International Conference on
Informatics in Control, Automation and Robotics, vol-
ume 2, pages 561–568.
ICINCO2013-10thInternationalConferenceonInformaticsinControl,AutomationandRobotics
588
