
Method for Artefact Detection and Removal in Heart Rate Signals
Measured during Physical Exercise
Pieter Joosen
1, 2
, Vasileios Exadaktylos
1
, Joachim Taelman
2
, Jean-Marie Aerts
1
and Daniël Berckmans
1
1
Division Measure, Model & Manage Bioresponses, KU Leuven, Kasteelpark Arenberg 30, Leuven, Belgium
2
BioRICS NV, Technologielaan 3, Heverlee, Belgium
Keywords: Heart Rate, Artefact Detection, Artefact Removal, Pre-processing.
Abstract: Monitoring the training of athletes is essential for success in sports. Information that is derived from
measured data during the training is only reliable if the quality of the data is high. Therefore artefact
detection and removal are essential. In this paper typical artefacts in heart rate measurements during football
field-trainings are described. An algorithm to automatically detect artefacts and an algorithm to pre-process
them are also presented. The results show that with the proposed pre-processing method the percentage of
artefacts can be significantly (p < 0.01) reduced from 9.0 to 4.4 %. This corresponds to a total period of 10
hours of unreliable data on a total of 126 hours that have been taken out. As a result, more high quality data
is available for monitoring training. The developed methods are generic and can be used in many
applications where accurate heart rate monitoring is crucial.
1 INTRODUCTION
Monitoring the training of athletes is essential for
their success. Training programs can only be
optimized when accurate information about the
training and its effect on the athlete is available.
Today more attempts are being made to gather
quantitative information about trainings and their
effect by using modern technology.
Training is affected by the type, duration,
frequency and intensity of exercises (Impellizzeri et
al., 2005). The concept of the training impulse
(TRIMP, Banister, 1991) integrates these
components in a single term, based on heart rate
measurements during training. Other research has
shown that quantification of the dynamic
relationship between physical activity and heart rate
contains information about the physical condition of
athletes (Lefever et al., 2012).
An important limitation of methods based on
measuring field data and in particular heart rate is
the quality of the measured signal. During intense
training, technical failure of the measuring
equipment is often causing loss of data and/or
artefacts. As a consequence information that is
derived from heart rate may also be incorrect.
Therefore monitoring training with heart rate is only
reliable when artefacts can be detected and removed.
In general it has no meaning to use the limited
energy available in wearable technology to send low
quality data higher up for analysis.
Heart rate is often derived from R-R interval
time series from electrocardiographic (ECG)
recordings. These R-R interval time series can
contain artefacts of either physiological or technical
origin (Peltola, 2013). Many algorithms for
correcting artefacts in R-R intervals have been
developed, such as the 20% filter (Kleiger et al.,
1987), deletion of the false R-R intervals, etc.
However, if only heart rate is available instead of the
R-R intervals, other approaches are needed.
Therefore typical artefacts in heart rate data,
measured during football field-trainings, are
described in this paper. Next an algorithm to
automatically detect these artefacts is presented. If
artefacts are present in the data, these can be
processed with the presented pre-processing
algorithm. Finally the influence of the pre-
processing method on the artefacts is investigated.
57
Joosen P., Exadaktylos V., Taelman J., Aerts J. and Berckmans D..
Method for Artefact Detection and Removal in Heart Rate Signals Measured during Physical Exercise.
DOI: 10.5220/0004636800570061
In Proceedings of the International Congress on Cardiovascular Technologies (CARDIOTECHNIX-2013), pages 57-61
ISBN: 978-989-8565-78-5
Copyright
c
2013 SCITEPRESS (Science and Technology Publications, Lda.)
2 METHODS
2.1 Data Acquisition
The data for this study are part of a larger project
that studies the dynamic interactions between
velocity and heart rate of football players during
field-trainings. For this analysis high quality heart
rate measurement is essential.
Fourteen players (age: 17.6±0.7 year) are
monitored for a total of 127 field-trainings with the
Inmotio LPM system (Inmotio Object Tracking BV,
the Netherlands) and Hosand Heart Rate module
(Hosand Technology, Italy) with Polar heart rate belt
(Polar Electro, OY, Finland). Velocity and heart rate
are sampled at 5Hz. Field-trainings consist of
different types of exercises (match, shooting, sprints,
running, etc.) and have a duration of 1h±30min. In
total 126 hours of measurements are available.
2.2 Artefacts
In the measured heart rate data, three typical
artefacts can be distinguished. These are defined in
the first sub-section. An algorithm to automatically
detect each artefact type is presented in the
following sub-section.
2.2.1 Definition of Artefact Types
Reliable heart rate measurements during football
trainings normally show values lower than 230 bpm
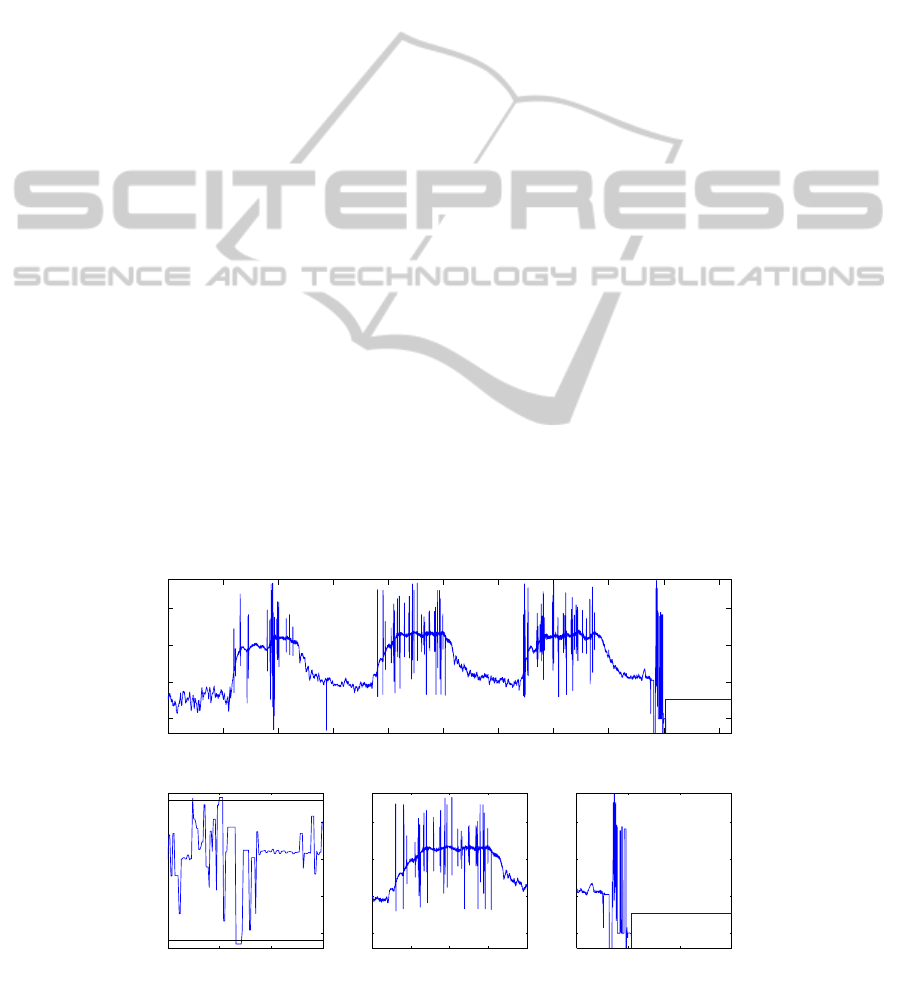
and higher than 40 bpm (Atwal, 2002). Periods
when heart rate measures are outside these bounds,
are defined as type I artefacts (Figure 1, bottom left).
During exercise the heart responds to the
physical activity, changing the heart rate to fulfil
physiological requirements. Measured values of
heart rates changing faster than physiologically
possible, may occur due to technical failures. These
high-frequency errors are defined as type II artefacts
(Figure 1, bottom centre).
The heart is influenced by many factors (Ryan,
1994). Therefore measured values of heart rate that
are constant or changes at a constant pace for a
longer duration are not plausible. These are defined
as type III artefacts (
Figure 1, bottom right).
2.2.2 Detection Algorithm
Each type of artefact can be automatically detected
using specific criteria.
Detection of type I artefacts is most
straightforward. Whenever heart rate exceeds 230
bpm or drops below 40 bpm during a certain time,
the algorithm detects this period as an artefact of
type I (Figure 2, second plot).
To detect type II artefacts, the heart rate change
per sample is computed. This is subsequently
filtered with a moving window average filter
(window 0.8 s) to take out high-frequent changes.
This signal is used to threshold for artefacts: if the
filtered heart rate change per second exceeds 15
bpm/s, a type II artefact is detected (
Figure 2, third
plot).
Figure 1: Example of heart rate containing the three types of artefacts.
0 200 400 600 800 1000 1200 1400 1600 1800 2000
50
100
150
200
Heart Rate
Time (s)
BPM
370 380 390 400
50
100
150
200
Type I
Time (s)
BPM
700 800 900 1000 1100
50
100
150
200
Type II
Time (s)
BPM
1700 1800 1900 200
0
50
100
150
200
Type III
Time (s)
BPM
CARDIOTECHNIX2013-InternationalCongressonCardiovascularTechnologies
58
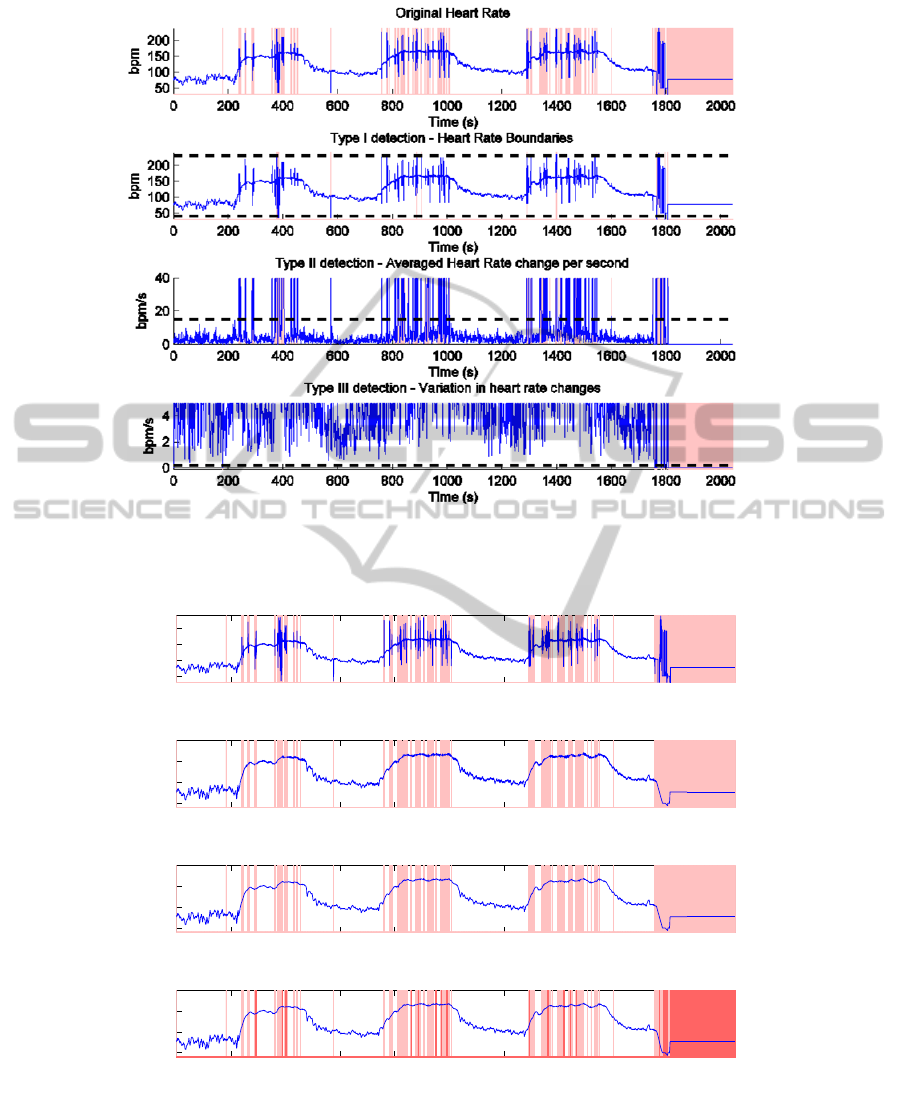
Figure 2: Artefact detection algorithm steps. The shaded areas represent detected artefacts. The dashed horizontal lines
represent the thresholds used in the algorithm.
Figure 3: Heart rate pre-processing algorithm steps. The light shaded areas represent the detected artefacts before pre-
processing, the dark shaded areas after pre-processing.
Type III artefacts are characterized by a constant
heart rate and constant heart rate changes. Thus the
variation in heart rate changes is low at these
instances. Therefore the moving standard deviation
of the filtered heart rate change is computed
(window 2 s). If the variation is smaller than 0.01
0 200 400 600 800 1000 1200 1400 1600 1800 200
0
50
100
150
200
Heart Rate
Time (s)
BPM
0 200 400 600 800 1000 1200 1400 1600 1800 200
0
50
100
150
200
Linear interpolation at artifacts
Time (s)
BPM
0 200 400 600 800 1000 1200 1400 1600 1800 200
0
50
100
150
200
Low−pass filtering − 1Hz cut−off frequency
Time (s)
BPM
0 200 400 600 800 1000 1200 1400 1600 1800 200
0
50
100
150
200
Cubic interpolation at artifacts
Time (s)
BPM
MethodforArtefactDetectionandRemovalinHeartRateSignalsMeasuredduringPhysicalExercise
59

bpm/s, the algorithm detects a type III artefact
(Figure 2, fourth plot).
The thresholds that are used for the detection of
type II and III artefacts are selected by trial and
error.
2.2.3 Performance Measures
The percentage of time that one training session
contains artefacts is computed for all trainings. This
is done for each type of artefact separately, as well
as for all types combined. These measures are
weighted with the duration of the training: the
largest weight is 1 and corresponds with a training
duration of 2 h.
2.3 Pre-processing Algorithm
In the project, for which this data is acquired, a high
quality and reliable heart rate signal of 1 Hz is
required. The first step in the pre-processing
algorithm therefore would be to low-pass filter the 5
Hz heart rate signal to remove high-frequent
information. However, this filtering introduces large
errors in periods where artefacts are present.
Therefore, artefacts are first removed from the heart
rate by linear interpolation (Figure 3, second plot).
During our measurements the median duration of
type I, II and III artefacts were 4.1, 1.7 and 14.8
seconds respectively. Therefore linear interpolation
produced adequate results.
Next a low-pass Butterworth filter with cut-off
frequency of 1 Hz is applied on this signal (Figure 3,
third plot).
Finally heart rate during artefacts is replaced
with cubic interpolation, to take into account the
non-linear characteristics of heart rate (
Figure 3,
fourth plot).
2.4 Statistical Analysis
The performance measures are calculated before and
after pre-processing. The effect of pre-processing on
the different types of artefacts can thus be
investigated.
Normality of each group is tested with a
Lilliefors test. The null-hypothesis (data is
distributed normally) was rejected for each group
(p<0.001). Since comparisons are made between two
paired, non-parametric groups, the Wilcoxon test is
used.
3 RESULTS AND DISCUSSION
Table 1 reveals that most of the artefacts in this
dataset are of type III; the median of type I and II
artefacts are only 0.1 % and 0.9 % respectively,
while this is 6.7 % for type III. The median of the
total percentage of artefacts is 9.0 %, which
corresponds with 11 minutes of unreliable data per
training. In total 37 hours of artefacts are present in
the data.
Another interesting result is that the total
percentage of artefacts is reduced significantly
(p<0.01) after pre-processing. The total period of
data containing artefacts is reduced with more than
10 hours. Even more, type I and II artefacts are
almost completely removed from the raw data. The
pre-processing algorithm presented in this paper is
thus able to reduce type I and II artefacts
significantly (p<0.01).
Type III artefacts on the other hand are still
present after pre-processing, although they are
decreased from 6.7 to 4.2 %. In this case more
advanced methods are required.
4 CONCLUSIONS
In this paper an artefact detection algorithm for heart
rate is presented, which is able to automatically
detect three types of artefacts; physiologically not
meaningful heart rates (type I), heart rate changes
that are too fast (type II) and changes that show too
little variation (type III).
The pre-processing algorithm could not reduce
type III artefacts. More advanced techniques are
needed here to recover this data. Nevertheless
periods in heart rate still containing errors can be
detected automatically. In further analysis this
information can be taken into account.
Table 1: Median and interquartile range,
a
shows statistical
significance (p < 0.01) between group before and group
after pre-processing.
Artefacts Before Pre-processing After Pre-processing
Total (%)
9.0
+9.8
-6.0
a
4.4
+8.1
-4.1
Type I (%)
0.1
+1.4
-0.1
a
0
+0.02
-0
Type II (%)
0.9
+1.0
-0.5
a
0.04
+0.13
-0.03
Type III (%)
6.7
+10.4
-6.4
4.2
+8.2
-4.0
It is also shown that with pre-processing the total
percentage of artefacts can be significantly reduced.
Typical artefacts (type I and II) in heart rate can
even be almost completely removed from raw data.
CARDIOTECHNIX2013-InternationalCongressonCardiovascularTechnologies
60

As a result, more high quality data is available
for analysis and for a total period of 10 hours bad
data have been taken out. The developed methods
are generic and can be used in many applications
where accurate heart rate monitoring is crucial.
REFERENCES
Atwal, S., Porter, J., MacDonald, P., 2002. Cardiovascular
effects of strenuous exercise in adult recreational
hockey: the hockey heart study. In Canadian Medical
Association Journal, Vol. 166, No. 3, pp. 303-307.
Banister, E., 1991. Modeling Elite Athletic Performance.
In MacDougal, J, Wenger, H, Green, H, Physiological
Testing of Elite Athletes, 2
nd
edition, pp. 403-424.
Impellizzeri, F., Rampinini, E., Marcora, S., 2005.
Physiological assessment of aerobic training in soccer.
in Journal of Sports Science, vol. 23, no. 6, pp. 583-
592
Kleiger, R., Miller, J., Bigger, Jr. I., Moss, A., 1987.
Decreased heart rate variability in association with
increased mortality after acute myocardial infarction.
In The American Journal of Cardiology, vol. 59, no. 4,
pp. 256-262
Lefever, J., Berckmans, D., Aerts, J-M., 2012. Time-
variant modelling of heart rate responses to exercise
intensity during road cycling. In European Journal of
Sport Sciences, vol. in press. Available from Taylor &
Francis.
Peltola, M., 2013. Role of editing of R-R intervals in the
analysis of heart rate variability. In FRONTIERS IN
PHYSIOLOGY, vol. 3, no. 148, pp. 1-10
Ryan, S., Goldberger, A., Pincus, S., Mietus, J., Lipsitz, L,
1994. Gender- and age-related difference in heart rate
dynamics. In Journal of the American College of
Cardiology, Vol.24, No. 7.
MethodforArtefactDetectionandRemovalinHeartRateSignalsMeasuredduringPhysicalExercise
61
