
Quantitative Assessment of a Functional Movement Screen in
Athletes using a Wireless Body Area Sensor Network
Suryadip Chakraborty
1
, Saibal K. Ghosh
1
, Anagha Jamthe
1
, Dharma P. Agrawal
1
, Robert Mangine
2
,
Angelo Colosimo
2
and Joe Rauch
2
1
Center of Distributed and Mobile Computing Laboratory, Department of Electrical Engineering and Computing Systems,
University of Cincinnati, Cincinnati, OH, 45220-0008, U.S.A.
2
Athletic Department, University of Cincinnati, Cincinnati, OH, 45220-0008, U.S.A.
Keywords: Sports Medicine, Functional Movement Screen, Wireless Body Area Sensor Network, Force Sensor.
Abstract: Technological solutions enabling the monitoring of human motion during sports and exercise by collecting
quantifiable measurements are gaining increased attention as tools for evaluating progress in rehabilitation.
Wireless technologies employing small sensors are particularly useful since they allow monitoring of
kinematic data without affecting individuals in executing their motions. Advances in miniaturized and
wireless technology will push capturing and clearly illustrate measurements in real time game situations.
This will eventually eliminate capturing forces from simulated situations in the training room and tell us
what actually happens on the playing field.
1 INTRODUCTION
Whenever any college athlete sustains an injury, one
of the main concerns is how soon can he or she
return to play. The answer to this question is not
always straightforward because each athlete suffers
from a unique injury. Returning to play too soon can
increase the risk of re-injury or lead to a chronic
problem, resulting in a longer recovery period.
However, waiting too long can lead to unnecessary
deconditioning and poor performance. Return-to-
play decisions are fundamental to the practice of
sports medicine. But the method used to make the
decision varies greatly between different sports
medicine programs. Although there are published
articles that clearly identify individual components
that go into these decisions, a quantitative
assessment of functional movements is not currently
used as an integral part of the medical decision-
making process. There is a need to have an objective
decision-based model developed for clinical use by
sports medicine practitioners that take into account
quantification of defined outcomes of players before
allowing them to return to play.
Our project took one functional movement
screen, the overhead squat, to look at how to access
an athlete’s ability to perform the squat
quantitatively. To begin this process, we looked at
the use of a Wireless Body Area Sensor Network
(WBASN) that measures forces on the soles of the
feet during an overhead squat exercise. The
WBASN is a wireless network of wearable
computing devices including medical body sensors
that capture and transmit force data wirelessly to a
monitoring base station like a laptop. This provides
real time information about an athlete performing a
functional movement in a non-invasive way The
primary objective of this feasibility study was to
build an inexpensive and highly reliable force
measuring system using a WBASN designed and
developed by memebers of the Center of Distributed
and Mobile Computing Laboratory in the College of
Engineering and Applied Sciences at the University
of Cincinnati, Cincinnati, OH, United States.
The purpose of our study is to demonstrate the
ability of collecting force data by using our WBASN
in athletes performing an overhead squat exercise.
2 BACKGROUND
The NCAA and the National Athletic Trainers'
Association have an injury surveillance system that
collects injury reports submitted by trainers for
roughly 380,000 male and female college athletes. It
has been in operation since 1988 and through 2004
95
Chakraborty S., K. Ghosh S., Jamthe A., Agrawal D., Mangine R., Colosimo A. and Rauch J..
Quantitative Assessment of a Functional Movement Screen in Athletes using a Wireless Body Area Sensor Network.
DOI: 10.5220/0004638200950102
In Proceedings of the International Congress on Sports Science Research and Technology Support (icSPORTS-2013), pages 95-102
ISBN: 978-989-8565-79-2
Copyright
c
2013 SCITEPRESS (Science and Technology Publications, Lda.)

there were 200,000 injury reports. An injury report
is filed when an athlete misses a day or more of
practice or competition and this equates to about
12,500 injuries per year, a number that has been
rrelatively consistent over the years. Functional
movement screens are evaluation tools used to
assess the fundamental movement patterns of an
individual. The screens can be used to determine
whether an athlete has the essential movement and
flexibility needed to participate in his/her sport.
The overhead squat is one of the key functional
movement screens that can be used to determine an
athlete's lower body flexibility, providing a visual
indicator for the trainer in predicting the
performance of an athlete during regular play or
returning to play after an injury. Several joints and
muscles are involved in performing an overhead
squat. Currently our athletic trainers employ the
squat test to note the degree of deficiency of postural
balance in an athlete. Pressure data from the feet
could help them to more accurately determine the
extent of postural balance deterioration. To date, we
have not found any report of a study measuring the
forces on different parts of the soles of the feet
during the overhead squat.
3 METHODS AND SYTEM
DESIGN
Our invention is designed to wirelessly monitor
athletes during an overhead squat test using wireless
transducers and force sensors beneath the feet of an
athlete. We conducted a pilot test of our system
using both male and female athletes from the
University of Cincinnati football and volleyball
teams and all athletes were free of injuries at the
time of the testing. Demographic data recorded for
the subjects included age, weight and number of
years of experience playing their primary sport.
Figure 1: Current system design.
Force sensors are transducers capable of
determining the amount of difference in forces
exerted on them. These sensors can be connected to
an integrated circuit capable of wirelessly
transmitting the sensed data to a monitoring station,
which can either be a personal computer, laptop or a
portable device such as tablet or smart phone. Figure
1 shows the prototype for monitoring performance
using force sensors beneath the feet.
The athlete repeated the prescribed squat for a
defined number of times and the system
continuously analyzed the performance throughout.
We can train the system to do intelligent analysis
based on the history of an athlete performing squat.
The received data will determine the relation of the
force between heel and toes and will be displayed
graphically in a format easily readable by the trainer.
During the first stage of our investigation, we aimed
to look at the relationships between the parameters
discussed above with the force values that athlete's
exert on their feet during an overhead squat. The
output is a graphical display of the force in the toes
versus the ones in the heels. This output was then
evaluated from the perspective of weight, gender,
age, and the number of years playing their sport.
3.1 Force and Pressure Sensors
Our system employs FlexiForce™ force sensors
(Phidgets, Inc., Calgary, Alberta, Canada) beneath
the soles of athletes for measuring the distribution of
force in the feet. In an individual, not suffering from
any injuries and having normal postural balance, the
force exerted by the body on the feet is roughly
equally distributed between the two legs.
Figure 2: Flexiforce sensors arranged in shoe sole.
A diagram depicting the arrangement of such
sensors is shown in Figure 2.
The flexiforce sensors used in our system are
thin, flexible piezoresistive sensors that change
resistance as the applied force changes. This
resistance change is converted to voltage by the
Phidgets™ adapter board that plugs into the
Phidgets™ interface kit.
icSPORTS2013-InternationalCongressonSportsScienceResearchandTechnologySupport
96
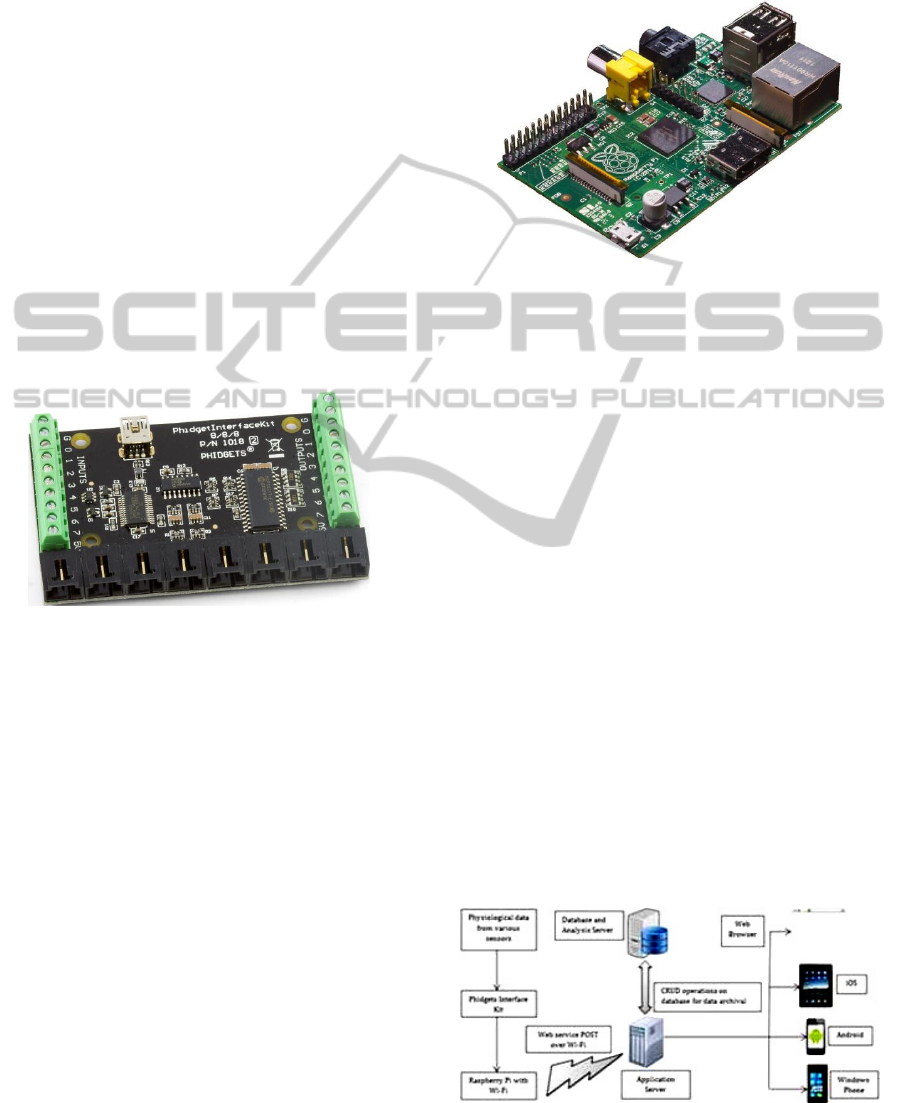
3.2 the Phidgets Interface Kit
The Phidgets interface kit provides a means to attach
the force sensors and interface them to a computer
for data acquisition and display. It consists of eight
analog inputs that can be used to measure
continuous quantities such as temperature, humidity,
pressure, position etc. The force sensors can be
attached to the analog inputs provided in the
interface kit. Phidgets provides a mechanism to tune
the sampling rates for the analog sense lines. The
sampling rates can be set at 1ms, 2ms, 4ms, 8ms, up
to 1000ms in steps of 8ms. The interface kit also
provides a series of digital inputs in order to sense
the states of certain devices such as push buttons,
relays and logic gates. The kit incorporates a digital
input hardware filter in order to eliminate false
triggering from the ambient electric noise. The
digital outputs provided from the kit can be used to
drive LEDs and transistors. A diagram of the
interface kit is shown in Figure 3.
Figure 3: The Phidgets Interface Kit (Phidgets, Inc.,
Calgary, Alberta, Canada).
3.3 The Raspberry Pi
The Raspberry Pi is a system on a chip computer
powered by a 700 MHz ARM chip. It has 512
megabytes of onboard RAM which is shared with a
GPU. The whole device is just the size of a credit
card and requires only 5 volts of power. This makes
an appropriate choice for our system as its modest
power requirements mean that the device can be
battery powered. The system also has two USB
ports. We use one port as the input from the Phidgets
interface kit that sends the data from the force
sensors in the shoe soles. The other USB port would
be used to connect a Wi-Fi dongle that would ensure
that the Pi is able to connect to a wireless network
and transmit data to the server. This port can also be
used to attach GSM/LTE dongles that would provide
connectivity to cellular networks thereby ensuring a
higher transmission rate and provides ability to be
used in places without any Wi-Fi coverage. The Pi
runs Raspbian which is a Linux distribution derived
from Debian stable and is optimized for soft-floating
point operations since the Pi does not support the
hard floating point operands yet.
Figure 4: The Raspberry Pi (Raspberry Pi Foundation,
UK).
3.4 System Architecture
The ultimate goal of our project is to build a
comprehensive, portable system for acquiring data
from individuals, transmit them securely to a server
and develop tools and interfaces for subsequent
analysis and visualization. The data acquisition
module of our system is totally battery powered and
Wi-Fi enabled, thereby making it portable to be
deployed anywhere. The analysis module of the
system would run on a dedicated server enabling
faster computation of the acquired data and support
of a rich GUI that would make use of the system
easier for users. Data pertaining to a particular
individual would be time stamped and stored in the
database. The system would enable various
statistical computations to be performed on the
gathered data. The system would also employ Fuzzy
Logic and distributed consensus protocols to analyse
patterns of injuries and recovery rates of various
individuals and aid doctors and medical personnel in
making appropriate decisions for patients
recuperating from the injuries. A schematic diagram
of our proposed system is shown in Figure 5.
Figure 5: The proposed system architecture.
QuantitativeAssessmentofaFunctionalMovementScreeninAthletesusingaWirelessBodyAreaSensorNetwork
97

Our system will employ multiple force sensors
on the shoe soles to be used by the athletes. This
data can be gathered by the interface kit on its
analog input lines.
However, the interface kit does not have any
processing power. Therefore, we are employing a
Raspberry Pi to provide the required processing
power to the system. The interface kit and the Pi
would be battery powered in order to make it
portable. The Raspberry Pi would be equipped with
a USB Wi-Fi dongle that would provide it with
wireless capabilities and allow it to be connected to
the campus network. Our system would also allow
the Pi to be equipped with GSM/LTE dongles that
would give it a larger range and increased data rates.
Here, we also propose that the Raspberry Pi would
run an HTTP server that would post the gather data
over a web service to a database server. The goal is
to enable the wireless transmission of the pressure
data to a central repository for storage.
3.5 Experimental Set up
Each athlete has to undergo an assessment of their
body posture during an overhead squat. Below are
the standardized instructions they followed for
performing the overhead squat (Butler et al., 2010).
1. Stand tall with feet approximately shoulder width
apart in a comfortable position and toes pointing
forward.
2. Grasp the rod in both hands.
3. Press the rod so that it is directly above the head.
4. While maintaining an upright torso, and keeping
heels in contact with the ground and the rod in
position, descend as deep as possible.
5. Hold the descended position for a count of two,
then return to the starting position.
Figure 6: Experimental WBASN set-up for the overhead
squat.
We drew an “X” on the floor to mark the center
of mass for each subject. Athletes were instructed to
put their feet in a comfortable position around the
“X”. We put our video cameras in the following set-
up: the front camera at 300cm from “X”, the side
camera – 350cm from “X”, camera height in front –
153cm, and the camera height on side – 103.5cm.
We instructed the athletes to perform 3
repetitions of overhead squats. The only specific
instruction was how to place the feet on the sensors.
Verbal instruction included “3 repetitions of
overhead squats slowly with a two second pause at
the bottom”.
The 3 male players are identified below as
subject1, subject2 and subject3 and the 3 female
volleyball players by subject4, subject5 and
subject6.
Table 1: Demographics.
SUBJECT AGE EXPERIENCE WEIGHT SPORTS
1 (Male) 21 14 yrs 177 lbs Football
2 (Male) 21 14 yrs 209 lbs Football
3 (Male) 21 8 yrs 250 lbs Football
4 (Female) 19 7 yrs 177 lbs
Volleyba
ll
5 (Female) 20 7 yrs 160 lbs
Volleyba
ll
6 (Female) 19 9 yrs 162 lbs
Volleyba
ll
We conducted experiments by placing force
sensors beneath the athlete’s feet in two distinct
areas of foot - the heel and toes. Then, we asked
each player to perform three iterations of squats and
we recorded the force values every second. We
captured the force data of both the toe and heel
during the front-overhead and back-overhead squats.
We also video recorded the overhead squat testing
session so that the subject’s performance could be
analyzed by the athlete’s trainers and their analysis
could be correlated with the force data that the
WBASN system captured wirelessly.
4 RESULTS AND DISCUSSION
We captured the force data in our experimental set-
up and retrieved it to generate the graphical display
for the athletic trainers. Based on the variations in
the force values, we identified three main different
postures which lead to significant changes in the
corresponding force values on their feet as shown
below.
icSPORTS2013-InternationalCongressonSportsScienceResearchandTechnologySupport
98
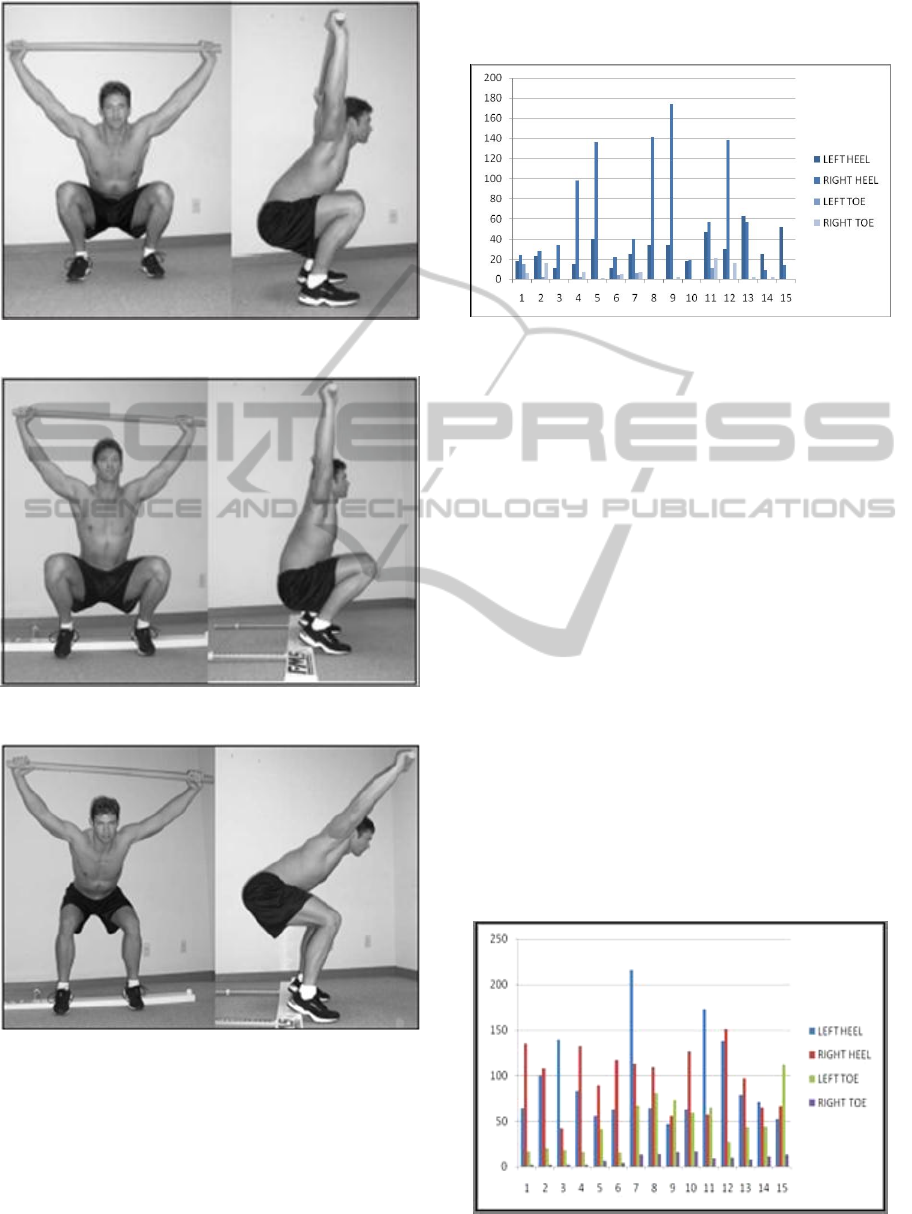
Figure 7a: Overhead squat position 1 (Kiesel et al., 2007).
Figure 7b: Overhead squat position 2 (Kiesel et al., 2007).
Figure 7c: Overhead squat position 3 (Kiesel et al., 2007)
We noticed that the force values collected using
our experimental set-up in a wireless environment
changes a lot during the three different postures of
the squat test. The graphical interface we developed
helped in comparing the performance among
different players and the two genders. We plotted the
time (seconds) on the X-axis and the force value
(pounds) on the Y-axis. A few of the performances
of the athletes are shown in Figure 8.
Figure 8: Squat force value of toe and heel of female
subject 4.
We collected data from the player’s heel and toe
as he/she performed the squat. This data is plotted in
Figure 8 for female subject4 and Figure 9 for the
male subject3. A good squat should have high values
of force for the heel since the heel takes the bulk of
his weight while the force values at the toe should be
less since as they do not need to support the weight.
From the graph we can see that the force values
show three large spikes that correspond to the athlete
performing the three squats. For male subject3, his
heel force data shows the three spikes. However, his
toe has also registered some large values which
show that he did not perform the squat properly.
Female subject4’s force values in the heel show
three well defined spikes while her toe values have
zero values corresponding to the actual squats. This
can be considered as an ideal squat force value. We
also discuss some of the other performance
characteristics which lead to some important
observations by the trainers as they correlated the
graphical values with on-field performances of the
athletes affected by prior injuries.
Figure 9: Force value of toe and heel of male subject 3.
QuantitativeAssessmentofaFunctionalMovementScreeninAthletesusingaWirelessBodyAreaSensorNetwork
99

We observed the following:
a) In order to distinguish a good squat from a bad
one, the player should exert more pressure in the
heel than the toes.
b) Figure 10 indicates that pressure exerted on left
heel is comparatively more that of right heel,
thus the balance is biased towards the left side.
c) Figure 10 also illustrates the comparison of force
between heel and toe of each leg of male
subject1. We observe that the force exerted on
left heel is more than left toe, which indicates a
good squat initially. The peak indicates a descent
during the squat where more pressure is exerted
on the heel during all the three iterations.
Comparing our results in Figure 9, we find
somewhat similar results, as well some
dissimilarity where the pressure exerted on the
heel at any instant is more than that of the toe,
which is an indication of a good squat, as also
confirmed by the trainers.
Another important aspect is to compare the
performance of two different athletes playing the
same game. According to the trainers, this
comparison really helps to understand the capability
of the players in playing continuously during the
sport season. Our WBASN experimental set-up gave
the trainers an opportunity to distinguish between
player squat performances, providing a robust means
of evaluating the athlete’s performance.
Figure 10: Squat force value of toe and heel of male
subject 1.
We compared the force squat values between male
subject1 and male subject3, both from the football
team and found the following observations as shown
in Figure11:
a) During the three repetitions of the overhead
squat performance, male subject3 seems to do
good squat with an appropriate postures as
compared to his team member male subject1.
The heel force values remain consistent over the
time progression for male subject3. For an ideal
squat, the heel takes the bulk of the body weight
during and the force values should remain at a
higher peak in a consistent fashion. For male
subject1, both the left and right heel values are
not consistent and change frequently indicating
poor form during the test. This correlates with
the athlete’s relatively poorer performance on the
field. The control on body weight during the
squat testing has always been an important
criterion to determine good, average and poor
athletes. Therefore our WBASN experimental
set-up is relevant and can help a trainer to
categorize the players based on quantifiable
performance metrics.
b) Unlike the right heel, the force value exerted by
the male subject3 on the right heel is continuous
which is more discrete. This leads to an inference
that the male subject1 could not maintain the
balance of his body while maintaining an upright
torso, and keeping his heels and the rod in
position, while descending as deep as possible,
as shown in Figure7a. We compared the force
values in the toe for both the athletes to
distinguish their athletic conditions based on
their performance.
Figure 11: Difference in squat force value of heel part
between male subject 1 and male subject 3.
Figure 12: Difference in squat force value of toe part
between male subject 1 and male subject 3.
icSPORTS2013-InternationalCongressonSportsScienceResearchandTechnologySupport
100

In an ideal squat, the athlete should distribute the
weight through with equal pressure on their entire
foot from the heels through the toes and maintain
this foot position throughout the overhead squat as
they complete the exercise with their shoulders back
and their back straight (Tolliver). The weight should
be kept distributed on their upper thighs and the
heels or balls of your feet, neither on the toes nor
their knees. It’s more to get the athlete to get off
his/her toes than to literally squat only on the heels.
This observation is clearly visible from Figure 12
where male subject3 put a majority of the force on
the right toe as compared to the same in the left toe,
indicating the trainer that the subject cannot balance
his body weight due to inflexibility. Force values on
both the heel and toes are very important when
determining the potential performance of the athletes
as they can be indicative of postural balance, body
flexibility and other cognitive factors which affect
the performance of athletes.
4.1 Decisions by the Athletic Trainers
Based on previous subjective analysis of the trainers,
and the past history of injuries, the additional force
value information can significantly help trainers and
healthcare professionals to prescribe exercises for an
increased flexibility.
Sports medicine personnel will be able to
determine progression of rehabilitation based on the
graphical force values and it will help them to
determine return-to-play estimates.
Figure 13: Classification of three different groups in squat.
A healthcare professional will be able to advise
the athletes to discontinue any exercise depending
on their medical history and the graphical output
analysis of the WBASN that we have developed.
The initial results in the form of graphical display
have been helpful in classifying 6 athletes in three
groups of overhead squat performance as being
shown in Figure 13.
The result of our study suggests that squat
performances judged mainly on the force values on
both the heels and the toes in the athletes totally
differs among athletes in group1, group2 and
group3. The overhead squat performance in the
group3 is thought to be better than the others, as
subjectively classified by the sports medicine
professionals.
4.2 Future Work
Another feature that will be incorporated into the
system is the measurement of sway in an athlete
while he/she is performing the overhead squat. An
athlete without injuries will perform the squat
following a certain gesticulation. However, athletes
with injuries will deviate from expected motions.
Our system will incorporate gyroscopes and three
axis accelerometers on the chest and two shoulders
to determine the degree of deviation from the
expected motion. As before, data can be stored and
analyzed to provide the coach with a complete
picture of an athlete’s fitness.
Additional work will be carried out to develop a
system to enhance the security of the
communications channel from the data acquisition
device to the application server. Public Key
Cryptography using Elliptic Curve Cryptography
maybe a viable option since it gives a reasonable
amount of security without a lot of computational
overhead. A caching server may also be
incorporated in the system so as to reduce the load
on the database/analysis server for data that is most
frequently requested and/or that needs not be
computed in real time. The applications running in
the devices may also be enhanced to enable the
running of various what-if scenarios that can give an
estimate of the time required for an individual to
recover completely.
Most of these systems in WBASN employ
wireless devices to provide an unobtrusive
experience for the users. Therefore, most of these
systems are also inherently susceptible to the delays
and failures that are common in wireless systems.
For a system to be effective in healthcare, it must be
robust and provide mechanisms to ensure the
reliable delivery of medical data in case of an
emergency. Therefore, we need to explore the
problem and importance of reliability in a WBASN
and develop a framework for ensuring the
guaranteed delivery of data packets.
QuantitativeAssessmentofaFunctionalMovementScreeninAthletesusingaWirelessBodyAreaSensorNetwork
101

Questions that will have to be investigated in the
future include:
a) Can the sensors be placed in the shoes and/or
attached to the athletes for both training and in-
game situations?
b) Will measured forces on soles indicate weakness
in the ankles?
c) If we determine deviation in the movement of an
athlete when standing up from the overhead
squat can the degree of deviation give us an idea
of the degree of injury?
5 CONCLUSIONS
We were successful in quantifying some of the
movement of an athlete performing an overhead
squat. Our long term goal is to develop a means of
quantifying the movement in even more detail so
numerical scores can be measured to quantitatively
access the degree of flexibility of an athlete based on
their performance of an overhead squat.
REFERENCES
Butler, R. J., Plisky, P. J., Scoma, C., Kiesel, K. B., 2010,
"Biomechanical analysis of the different classifications
of the Functional Movement Screen deep squat test,"
Sports Biomechanics 9(4), 270-280.
Kiesel, K., Plisky, P. J., Voight, M. L., 2007, “Can serious
injury in professional football be predicted by a
preseason functional movement screen?” N Am J
Sports Phys Ther 2(3):147–158.
Tolliver, K. D.: “Front squat foot position.
http://healthyliving.azcentral.com/front-squat-foot-pos
ition-3410.html
icSPORTS2013-InternationalCongressonSportsScienceResearchandTechnologySupport
102
