
On Providing Fair Performance in Adaptive Wireless Push Systems
P. Nicopolitidis
Department of Informatics, Aristotle University of Thessaloniki, Thessaloniki, Greece
Keywords: Data Broadcasting, Fairness, Learning Automata.
Abstract: This paper proposes a novel method for providing performance fairness in adaptive wireless data
broadcasting environments of push nature. In such environments, the performance of an application that
runs on client devices and receives items from the broadcast channel is affected by both the number of these
items and the pattern via which these are demanded by the application. The novelty of the proposed
approach lies in the fact that, irrespective of the above parameters, all applications run by the client will
receive a fair allocation of bandwidth and thus will enjoy the same performance. It requires additional
functionality only at the Broadcast Server and can thus constitute a simple and effective means for wireless
data broadcasting providers to support performance fairness.
1 INTRODUCTION
Adaptive data broadcasting (e.g. (Nicopolitidis et
al., 2012); (Nicopolitidis et al., 2009)) is an efficient
way for information dissemination in asymmetric
wireless environments, where client needs for data
items are usually overlapping and are unknown to
the Broadcast Server (BS). In such environments,
the broadcast of a single data item is likely to satisfy
a large number of clients. Thus broadcasting is an
efficient solution for the dissemination of data.
Communications asymmetry, which prevents
clients from submitting actual requests to the server,
is attributed to several reasons, such as equipment
asymmetry (e.g., lack of client transmission
capability and client power limitations) and
uplink/downlink bandwidth asymmetry.
Furthermore, applications that run on the clients can
be characterized by commonality of demands,
meaning that each application is interested in
receiving different data items from the set broadcast
by the BS.
In data broadcasting, the performance metric that
is usually of interest is is the mean time a client
application waits to receive a data item (known as
the mean access time), which is desirable to be as
low as possible. Nevertheless, another equally
important metric is fairness of the performance
offered to the various applications that run on the
client devices. To this end, (Kakali et al., 2009)
proposed an adaptive wireless push-based system
capable of offering performance fairness to different
applications that are executed on client groups of
unequal sizes. Nevertheless, performance fairness is
also affected by two additional parameters: a) the
actual number of data items that are demanded by
each application, b) the actual demand skewness for
each application, which signifies the amount of
commonality exhibited in the demand pattern of
clients that run the same application. When the
above-mentioned two parameters are not the same
for every application, the mean access time across
applications will be different, despite the use of the
method of (Kakali et al., 2009).
This paper proposes a simple approach to solve
the problem of performance unfairness across
multiple applications, when this unfairness is caused
by the two above-mentioned parameters. The
proposed approach requires additional functionality
only at the BS, thus it can constitute a simple and
effective means of supporting fairness by wireless
data broadcasting providers. Apart from (Kakali et
al., 2009), it is the only approach to our knowledge
dealing with fairness in push-based broadcasting, as
other recent approaches (e.g. (Hu, 2007)) concern
on-demand (pull) systems running at special
environments.
The remainder of this paper is organized as
follows. Section II presents the proposed fair
adaptive wireless push system. Simulation results,
which assess the performance of the proposed
approach, both in terms of fairness and mean access
255
Nicopolitidis P..
On Providing Fair Performance in Adaptive Wireless Push Systems.
DOI: 10.5220/0004639002550260
In Proceedings of the 10th International Conference on Signal Processing and Multimedia Applications and 10th International Conference on Wireless
Information Networks and Systems (WINSYS-2013), pages 255-260
ISBN: 978-989-8565-74-7
Copyright
c
2013 SCITEPRESS (Science and Technology Publications, Lda.)

time, are presented in Section III. Finally, Section
IV summarizes and concludes the paper
.
2 THE PROPOSED PUSH
SYSTEM
A. Learning Automata
Learning Automata (LA) (Narendra and Thathachar,
1989) are machine learning tools that can be applied
to learn the characteristics of a system’s
environment. A LA is an automaton that improves
its performance via interaction with the environment
in which it operates. The goal of a LA is to find
among a set of A actions the optimal one, meaning
that this action minimizes the average penalty
received by the environment. Thus there must exist
a feedback mechanism that notifies about the
environment’s response to a specific action. The
operation of a LA constitutes a sequence of time
cycles that eventually lead to minimization of
average received penalty. The LA uses a vector
)}(,),(),({)(
21
npnpnpnp
A
L= , which represents
the probability distribution for choosing one of the
actions
A
aaa ,,,
21
L at time cycle n . Obviously,
∑
=
=
A
i
i
np
1
1)( .
The actual values of p are set by the probability
updating algorithm of the LA, also known as the
reinforcement scheme. This uses the environmental
response )(n
β
received after performing the action
i
a selected at cycle n in order to update the
probability distribution vector
p
. After the update
has finished at cycle n, the LA selects the action to
perform at time cycle
1+n
, according to the
updated probability distribution vector
)1(
+
np . A
general reinforcement scheme has the form of the
following formula:
ii i i
i
ii j j
ji ji
i
p (n 1) p (n) (1 (n))g (p(n)) (n)h (p(n)),
if a(n) a
p
(n 1) p (n) (1 (n)) g (p(n)) (n) h (p(n)),
if a(n) a
≠≠
+= −−β +β
≠
+= +−β −β
=
∑∑
(1)
The cycle n is defined as the time period in which
the LA chooses one of the actions
A
aaa ,,,
21
L ,
executes it and receives the
)(n
β
, which is
normalized in [0,1]. The lower the value of
)(n
β
the more favorable the response. When
)(n
β
takes
continuous values after normalization in the interval
[0,1], the automaton is known as an S-model. In the
area of data networking Learning Automata have
been applied to several problems, including the
design of self-adaptive MAC protocols for wired
and wireless platforms (e.g. (Nicopolitidis et al.,
2003); (Papadimitriou et al., 2000)) and routing (e.g.
(Economides et al., 1988); (Economides, 1995)).
B. The Broadcasting Algorithm
To optimize performance, it has been shown that
broadcast schedules must be periodic (Ammar and
Wong, 1987), and the variance of spacing between
consecutive instances of the same item must be
reduced (Jain and Werth, 1995). Based on the
above, the broadcast scheduling of many push
systems (e.g. (Vaidya and Hameed, 1999)) are based
on the following:
1. Broadcast schedules with minimum overall mean
access time are produced when the intervals
between successive instances of the same item
are of equal size.
2. Under the assumption of equally spaced
instances of the same items the minimum overall
mean access time occurs when the server
broadcasts an item
i
with frequency being
proportional to the factor
)))(1/())(1)((/( liElEld
iii
−+
where
i
d is the
demand probability for item
i
,
i
l is the item’s
length, and
)(
i
lE is the probability that an item
of length
i
l is received with an unrecoverable
error.
(Vaidya and Hameed, 1999) shows that a broadcast
algorithm based on the above arguments minimizes
the mean response time of the system. The
broadcasting algorithm used in this paper also tries
to satisfy the above arguments and, based on
(Nicopolitidis et al., 2009), operates as follows: The
proposed system uses an S-model LA at the BS. The
probability distribution vector p of this LA contains
the server's estimate p
i
of the demand probability d
i
for each data item i demanded by the clients. The
clients run a number of different applications, each
demanding items from a different subset of the BS’s
database. Each client acknowledges reception of an
item it is waiting via Code Division Multiple Access
(CDMA).
For each item broadcast, the BS selects to
broadcast the item i that maximizes the cost function
of Equation (2) ((Vaidya and Hameed, 1999)):
WINSYS2013-InternationalConferenceonWirelessInformationNetworksandSystems
256
()
2
ii
i
wp
G(i) T R(i)
l
=−
(2)
where T is the current time, R(i) is the time when i
was last broadcast, l
i
is the length of item i and w
i
is
its weight. After the broadcast of item i, the BS
waits for an acknowledging feedback from clients
that were waiting for item i. If this was the k
th
broadcast, the item estimation vector p is updated
according to the re-enforcement scheme of the S-
model LA:
∑
≠
−−+=+
≠
∀−−−=+
ij
jii
jjj
akpkLkpkp
ijakpkLkpkp
))(())(1()()1(
),)())((1()()1(
β
β
(3)
where p
i
(k) takes values in (a..1). L sets the rate of
LA convergence, while using a non-zero value of α
prevents the probabilities of items from taking
values very close to zero and thus increases the
adaptivity of the LA. (1-β(k)), which takes values in
[0..1], is the normalized environmental response for
the server’s k
th
broadcast. It is essentially the
percentage of clients acknowledging the k
th
broadcast item.
0 0.2 0.4 0.6 0.8 1 1.2 1.4
0
500
1000
1500
2000
2500
3000
3500
Data skew
mean access time
Performance per application and overall performance: Push system
App 1
App 2
App 3
App 4
Overall
Figure 1: Scenario N
1
: Performance for applications 1-4
and overall performance in the system of (Nicopolitidis et
al., 2009).
Until now, the item weight parameter w
i
has not
been used to achieve fairness, as all items were
considered to have equal weights. In the proposed
fair system, the BS will regularly use its vector p to
estimate the performance S
z
of each application z
running on the clients via Equation (4):
z
2
M
z
zii
i1
1
Spl
2
=
=
⎛⎞
⎜⎟
⎝⎠
∑
(4)
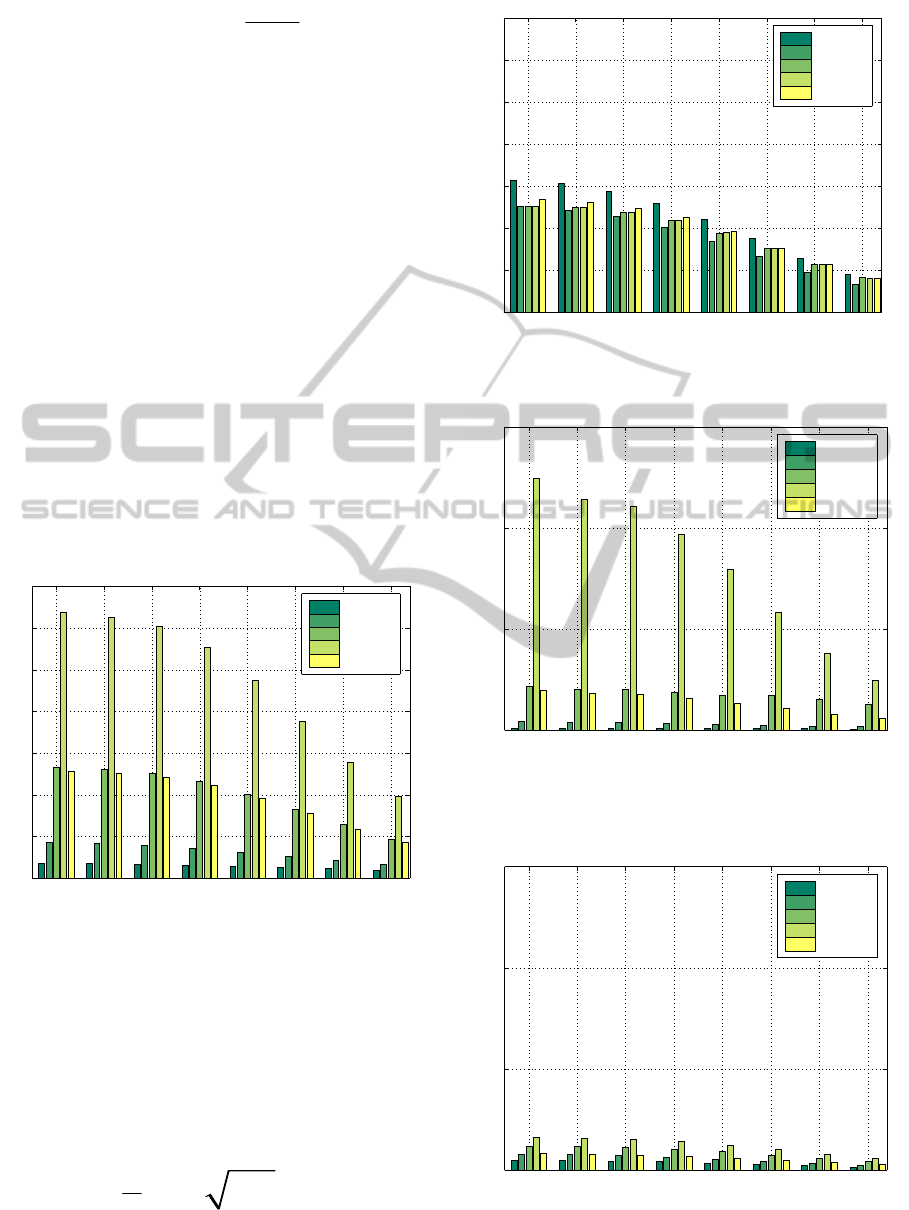
0 0.2 0.4 0.6 0.8 1 1.2 1.4
0
500
1000
1500
2000
2500
3000
3500
Data skew
mean access time
Performance per application and overall performance: Fair Push system
App 1
App 2
App 3
App 4
Overall
Figure 2: Scenario N
1
: Performance for applications 1-4
and overall performance in the proposed fair push system.
0 0.2 0.4 0.6 0.8 1 1.2 1.4
0
5000
10000
15000
Data skew
mean access time
Performance per application and overall performance: Push system
App 1
App 2
App 3
App 4
Overall
Figure 3: Scenario N
2
: Performance for applications 1-4
and overall performance in the system of (Nicopolitidis et
al., 2009).
0 0.2 0.4 0.6 0.8 1 1.2 1.4
0
5000
10000
15000
Data skew
mean access time
Performance per application and overall performance: Fair Push system
App 1
App 2
App 3
App 4
Overall
Figure 4: Scenario N
2
: Performance for applications 1-4
and overall performance in the proposed fair push system.
OnProvidingFairPerformanceinAdaptiveWirelessPushSystems
257
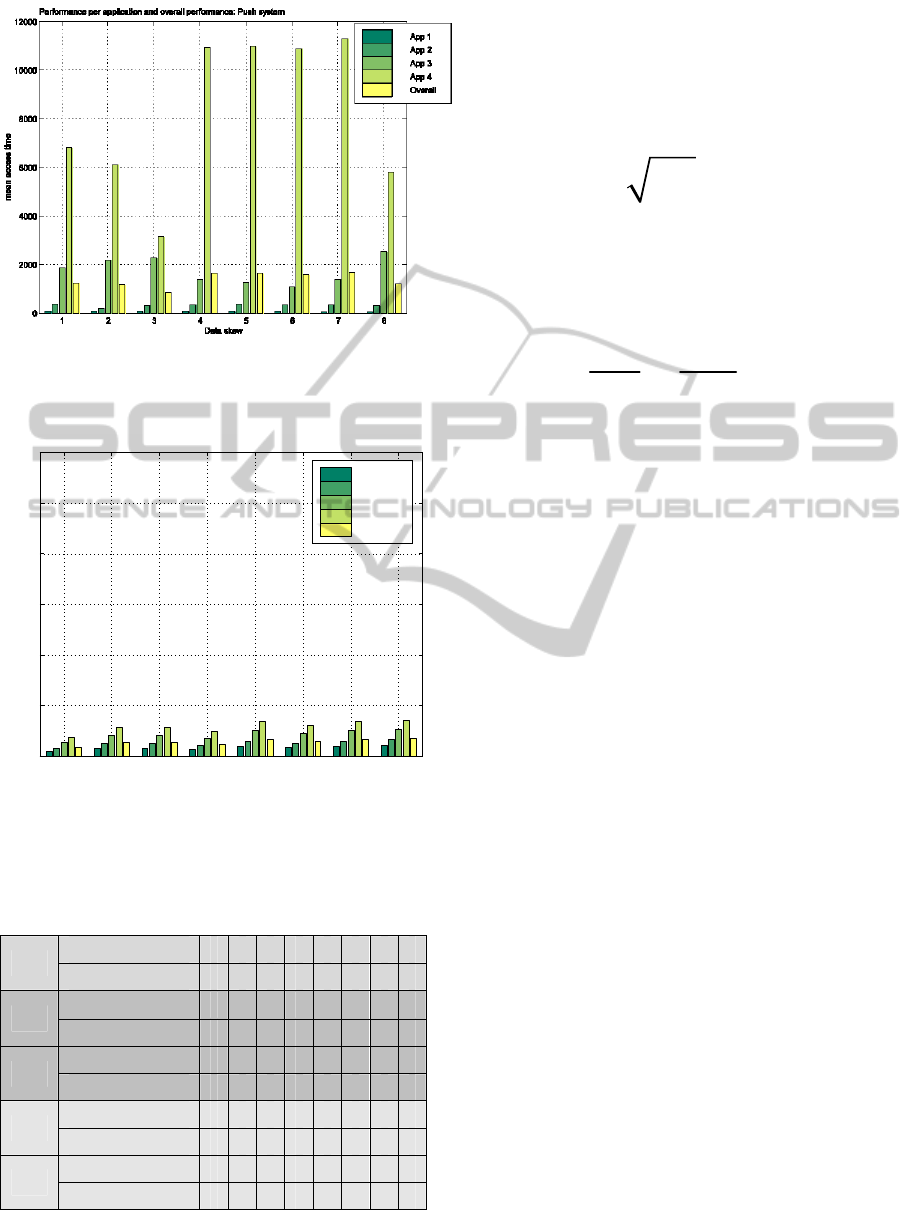
Figure 5: Scenario N
3
: Performance for applications 1-4
and overall performance in the system of (Nicopolitidis et
al., 2009).
1 2 3 4 5 6 7 8
0
2000
4000
6000
8000
10000
12000
Data skew
mean access time
Performance per application and overall performance: Fair Push system
App 1
App 2
App 3
App 4
Overall
Figure 6: Scenario N
2
: Performance for applications 1-4
and overall performance in the proposed fair push system.
Table 1: Fairness indices for the system of (Nicopolitidis
et al., 2009) and the proposed fair one, in scenarios N
1
-N
3
.
N
1
:
JFN
(Nicopolitidis et al., 2009) 0.54 0.54 0.53 0.53 0.54 0.56 0.58 0.6
Fair 0.99 0.99 0.99 0.99 0.99 0.99 0.99 0.99
N
2
:
JFN
(Nicopolitidis et al., 2009) 0.35 0.36 0.36 0.37 0.38 0.42 0.46 0.5
Fair 0.85 0.85 0.85 0.84 0.83 0.82 0.82 0.81
N
2
:
WJFN
(Nicopolitidis et al., 2009) 0.41 0.42 0.42 0.43 0.45 0.5 0.55 0.6
Fair 0.99 0.99 0.99 0.99 0.99 0.99 0.99 0.99
N
3
:
JFN
(Nicopolitidis et al., 2009) 0.42 0.44 0.55 0.33 0.33 0.32 0.33 0.47
Fair 0.81 0.82 0.83 0.83 0.83 0.83 0.83 0.84
N
3
:
WJFN
(Nicopolitidis et al., 2009) 0.5 0.51 0.64 0.38 0.38 0.36 0.37 0.55
Fair 0.99 0.99 0.99 0.99 0.99 0.99 0.99 0.99
According to (Vaidya and Hameed, 1999) this is
the optimal overall mean access time of an
application z that accesses a subset of M
z
items, with
a demand probability vector of p
z
. p
z
is computed
from the respective subset of the overall demand
probability vector p and then normalized so that the
following Equation holds:
z
M
z
ii
i1
pl 1
=
=
∑
(5)
Thus, for any two items in positions pos1, pos2 in
the database, with respective positions pos1’ and
pos2’ in the item subset accessed by application z,
after the weighting procedure, it will hold that:
z
p
os 1 pos 1 '
z
pos 2
p
os 2 '
pp
p
p
=
(6)
After calculating the mean access time estimates for
each application z, the BS will then compute the
weight w
z
for every item i in the item set demanded
by each application z and set is as w
z
=S
z
/ S
zmin
,
where S
zmin
is the highest application optimal overall
mean access time estimate and corresponds to the
application z
min
having the lowest performance. One
can easily see that this approach will assign weights
to the items demanded by an application in a manner
proportional to the overall mean access time
estimate for this application. Thus, items accessed
from a certain application will be now broadcasted
with an increased probability compared to items of
other applications that before the weighting
procedure exhibited lower mean access times. This
results to an increased bandwidth assignment and
consequently a performance increase for the
applications exhibiting a high mean access time. It
can also be seen that the complexity for computing
the weights of the data items in a subset accessed by
each application is linear to the number of the items
in the subset, thus the procedure does not increase
the complexity of (Nicopolitidis et al., 2009) which
is also linear to the number of data items.
3 PERFORMANCE
EVALUATION
Consider a BS that broadcasts data items from a set
of N items having initial probability estimates of
1/N. The size of each item is uniformly distributed
in [1..10]. We also consider four different
applications z
∈[1..4] running on a total of Cl clients,
WINSYS2013-InternationalConferenceonWirelessInformationNetworksandSystems
258

with each client running one application. Each
different application in the system accesses different
database subsets of size Num
z
items each. The
demand probability d
i
for an item in place i in a
subset is computed via the Zipf distribution:
()
θ
iqid /1)( =
,
(
)
]...1[,/1/1
z
k
Numkkq ∈=
∑
θ
.
The data skew coefficient θ is a parameter that when
increased, increases demand skewness. The number
of clients that run each application z equals the
parameter N
Clz
. The BS estimates the weights of data
items every Est item broadcasts.
The simulation results were obtained via a
simulator coded in C. The simulation runs until each
E data items are broadcast by the BS and uses the
following parameters: N=300, Cl =10000,
E=1000000, L=0.015, α=10
-6
, Num
1
=9, Num
2
=27,
Num
3
=81, Num
4
=183, Est=300.
We simulated three network scenarios, N
1
, N
2
and N
3
, with the following characteristics:
• N
1
: the demand skewness (parameter θ) of all
applications are all equal, ranging together from
0.0 to 1.4, and the number of clients N
Clz
running
each application z
∈[1..4] is 2500.
• N
2
: the demand skewness characteristics are as
in N
1
, and N
Cl1
=4800, N
Cl2
= 2400, N
Cl3
=1600,
N
Cl4
=1200.
• N
3
: the demand skewness for each application is
random in [1..1.4], and the number of clients
running z
∈[1..4] are as in N
2
.
Figures 1-6 and Table 1 show simulation results for
the three above-mentioned network scenarios,
regarding the performance offered to applications 1-
4 as well as overall performance in both the
proposed fair system and that of (Nicopolitidis et al.,
2009). The main conclusions drawn from the
Figures are summarized below:
• When every application is run by the same
number of clients (scenario N
1
), the proposed
fair system manages to alleviate the fairness
problem caused by applications accessing
unequally-sized data item sets, as it yields a
much more fair balance between the overall
mean access time offered to each application
(compare Figures 1, 2). To show this
numerically, we computed the Jain Fairness
Index (JFN) (Jain et al., ) for each result set in
N
1
. As seen in Table 1, the JFN for N
1
approaches the optimum of 1 for all result sets of
the proposed approach, whereas it is much less
for the system of (Nicopolitidis et al., 2009).
• The benefit described above also holds for the
case when the various applications are run on a
different number of clients each. This case is
depicted in scenario N
2
, for which performance
for the system of (Nicopolitidis et al., 2009) and
the proposed approach is plotted in Figures 3
and 4 respectively. Once more, the JFN is seen
from Table 1 to be superior for the proposed
approach in N
2
. However, as in N
2
the number of
clients running the same application is different,
it would be normal to expect mean access times
for each application inversely proportional to the
number of clients running the application. This is
desirable in data broadcasting systems, as more
popular data is supposed to be broadcast more
frequently. As this proportional fairness is not
directly apparent from Figure 4 visually, we also
computed the Weighed JFN (WJFN) for each
result set in N
2
. This was done by weighting the
mean access time of each application with the
percentage of the clients that run the application.
As seen from Table 1 for N
2
, it approaches the
optimum value of 1 for the proposed approach,
whereas it is much less for the system of
(Nicopolitidis et al., 2009).
• The proposed system also successfully addresses
the problem of applications accessing unequally-
sized data item sets with different demand
skewness per each application. This case is
depicted in scenario N
3
, for which performance
for (Nicopolitidis et al., 2009) and the proposed
approach is plotted in Figures 5 and 6
respectively. Table 1 again shows that
performance fairness across the four applications
is nearly optimal for the proposed approach, as
for each result set in N
3
the WJFN for the
proposed approach reaches the optimal value of
1, whereas it is much less for the system of
(Nicopolitidis et al., 2009).
• It can be seen from Figures 1-6, that the overall
system performance is not significantly affected
in a negative manner by the proposed system.
Moreover, it is actually improved in N
2
and N
3
,
as the fourth application is alleviated from the
starvation caused by the facts that it a) accesses
the largest set of data items and is b) run by the
smallest number of clients in the system.
4 CONCLUSIONS
This paper proposed an adaptive wireless data
broadcasting system of push nature, capable of
providing a fair allocation of bandwidth to multiple
client applications, each accessing different-sized
OnProvidingFairPerformanceinAdaptiveWirelessPushSystems
259

subsets of data items, with a possibly different data
demand pattern per application. The proposed
approach is simple to implement and requires
additional functionality only at the BS. Thus it can
constitute a simple and effective means of
supporting performance fairness by wireless data
broadcasting providers.
REFERENCES
P. Nicopolitidis, V. Kakali, G. I. Papadimitiou and
A.S.Pomportsis, "On Performance Improvement of
Wireless Push Systems via Smart Antennas", IEEE
Transactions on Communications, vol.60, no.2,
pp.312-316, February 2012.
P. Nicopolitidis, G. I. Papadimitiou and A. S. Pomportsis,
"Continuous Flow Wireless Data Broadcasting for
High-Speed Environments", IEEE Transactions on
Broadcasting, vol.55, no.2, June 2009, pp.260-269.
V. Kakali, G. I. Papadimitriou, P. Nicopolitidis, and A. S.
Pomportsis, "A New Class of Wireless Push Systems",
IEEE Transactions on Vehicular Technology, vol.58,
no.8, October 2009, pp.2529-4539.
C-L. Hu, “Fair Scheduling for On-demand Time-critical
Data Broadcast”, In Proceedings of IEEE ICC 2007,
Taipei, Taiwan, pp.5831-5836.
K. S. Narendra and M. A. L. Thathachar, Learning
Automata: An Introduction, Englewood Cliffs, NJ:
Prentice-Hall, 1989.
P. Nicopolitidis, G. I. Papadimitriou and A. S. Pomportsis,
"Learning-Automata-Based Polling Protocols for
Wireless LANs", IEEE Transactions on
Communications, vol.51, no.3, March 2003, pp.453-
463.
G. I. Papadimitriou and A. S Pomportsis, “Learning
Automata-Based TDMA protocols for Broadcast
Communication Systems with Bursty Traffic”, IEEE
Communication Letters, Vol.4, No.3, pp.107-109,
March 2000.
A. A. Economides, P. A. Ioannou, J. A. Silvester,
“Decentralized Adaptive Routing for Virtual Circuit
Networks Using Stochastic Learning Automata”, in
Proceedings of IEEE INFOCOM 1988, New Orleans,
USA, March 27-31 1988, pp. 613-622.
A. A. Economides, "Learning Automata Routeing in
Connection-oriented Networks", International Journal
of Communication Systems, vol.8, no.4, July-August
1995, pp.225-237.
M. H. Ammar and J. W. Wong, “On the Optimality of
Cyclic Transmission in Teletext Systems”, IEEE
Transactions on Commununications, vol. COM-35,
pp. 68-73, Jan. 1987.
R. Jain and J. Werth, “Airdisks and airRAID: Modeling
and Scheduling Periodic Wireless Data Broadcast
(extended abstract)”, Rutgers-The State University,
Piscataway, NJ, 1995.
N. H. Vaidya, and S. Hameed, “Scheduling Data
Broadcast in Asymmetric Communication
Environments”, Wireless Networks, vol.5, no.3, pp.
171–182, 1999.
R. Jain, D. M. Chiu and W. Hawe, “A Quantitative
Measure of Fairness and Discrimination for Resource
Allocation in Shared Computer Systems”, DEC
Research Report TR-301.
WINSYS2013-InternationalConferenceonWirelessInformationNetworksandSystems
260
