
Suboptimal Strategy in Performing Coincident Timing Task under
Risk
Keiji Ota
1
, Masahiro Shinya
1,2
and Kazutoshi Kudo
1
1
Laboratory of Sports Sciences, Department of Life Sciences, Graduate School of Arts and Sciences,
The University of Tokyo, 3-8-1 Komaba, Meguro-ku, Tokyo, Japan
2
Japan Society for the Promotion of Science, Tokyo, Japan
Keywords: Decision-making, Risk-sensitivity, Response Variance.
Abstract: The best performance often goes hand in hand with risk in many sports. Players are engaged in considering
how much risk they take. Some studies reported that movement strategy is modified by risk-sensitivity.
Here, we investigated how people responded under risk to which high gain got closer to zero gain. We
designed new coincident timing task in which participants were rewarded with the highest score if they
pressed a button just at a target time (2300 ms) but they did not get a score if they responded after the target
time. In this task, the participants should take the variability of their response into account and take a risk-
neutral strategy to get the highest total score that was theoretically calculated. However, we found out that
the participants took a risky response compared with an estimated optimal response. This risk-seeking
strategy degraded a task performance. These results suggest that not only small variability in response but
also taking an optimal strategy is important to get higher performance under risk.
1 INTRODUCTION
The best performance often goes hand in hand with
risk in many sports. For example, probability of
scoring a point would be highest if a tennis player
succeed to hit a ball on line, but he or she loses a
point if the ball is out of the line by 1 mm. In such
situations, beginners should not aim for edge of the
line because they cannot control the ball accurately
enough. To take an appropriate strategy, players
should take risk as well as variability in their motor
output into account. Thus, players are engaged in
making a decision about where in a court they
should aim under risk.
Classical economic lotteries task have been used
to study about decision-making under risk. An
example would be a choice between (0.5, $100; 0.5,
$0) and (1, $50); a 50%:50% chance at $100 or
nothing versus a certain (100%) gain of $50. If
people are asked to choose either of two lotteries,
most people would averse the 0 outcome and choose
the second sure lottery. The expected utility theory
(von Neumann and Morgenstern, 1944) claimed that
people make a decision to maximize expected utility,
predicting that most people prefer the second lottery
even though on average the two lotteries have the
same mean payoff.
However, in the field of behavioural economics,
deviation from the expected utility theory has been
repeatedly demonstrated, which indicated that
human decision-making under risk is not always
rational (Kahneman and Tversky, 1979). Referring
this concept in behavioural economics, recent
research has been focusing on human selection
behaviour in motor task under risk.
For example, Wu et al., (2009) showed that
participants tended to be risk-averse in deciding
between classical economic lotteries, but they tended
to be risk-seeking in deciding between same lotteries
presented in stochastically equivalent motor form.
O’Brien and Ahmed (2013) showed that risk-
sensitive behaviour transferred across different
movements. They found that participants showed
same direction of risk-sensitivity between two
movements, that is, they tended to be risk-seeking in
performing both arm reaching movement and whole-
body movement. It has been suggested that
participants underestimated their own motor
variability, and then tended to be risk-seeking. (Wu
et al., 2009); (O’Brien and Ahmed, 2013);
(Nagengast et al., 2011). In contrast, Nagengast et al.,
13
Ota K., Shinya M. and Kudo K..
Suboptimal Strategy in Performing Coincident Timing Task under Risk.
DOI: 10.5220/0004640600130018
In Proceedings of the International Congress on Sports Science Research and Technology Support (icSPORTS-2013), pages 13-18
ISBN: 978-989-8565-79-2
Copyright
c
2013 SCITEPRESS (Science and Technology Publications, Lda.)
(2010) indicated that participants are more risk-
averse in the face of increased uncertainty induced
by experimentally added large Brownian noise, but
they are risk-neutral when an added Brownian noise
is small. This result indicated that the direction of
risk-sensitivity could be changed according to
situation. These studies suggested that movement
decision-making is not always optimal under risk,
which is inconsistent with previous works claiming
models of optimal movement planning
(Trommesäusher et al., 2003a; 2003b; 2005).
In this study, we developed new coincident
timing task in which high gain and risk goes hand in
hand. The first purpose of this study is to investigate
relationship between risk-sensitivity and a task
performance. The second purpose is to investigate
inter-individual differences based on trial-by-trial
analysis. First, we compared a observed response in
the task with a theoretically calculated risk-neutral
response. We demonstrated that the participant’s
behaviour was not optimal under risk and then
discussed the relationship between risk-sensitivity as
well as response variability and a task performance.
Second, we demonstrated that there is an inter-
individual difference in responses following to miss
trials.
2 METHODS
2.1 Experimental Task
Twelve right-handed, healthy adults (6 male, 6
female; mean age 28.8 ± 8.7 yr) participated in the
experiment. All participants were unaware of the
purpose of the experiment. This study was approved
by the Ethics Committee of the Graduate School of
Arts and Sciences, the University of Tokyo.
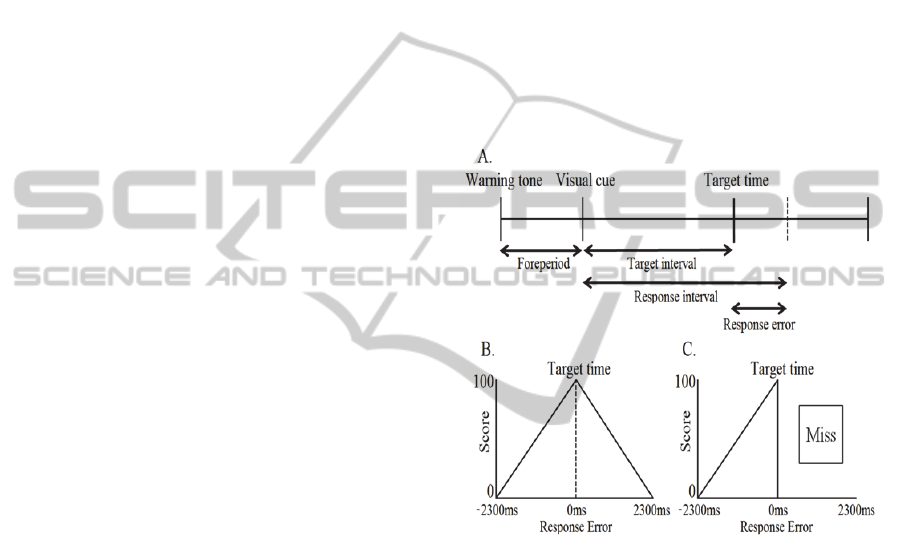
We showed a time sequence of the experiment in
Figure 1A. After presenting the warning tone, an
imperative stimulus (visual cue) was presented on
the screen. Foreperiod interval between the warning
tone and imperative stimulus was randomly varied
from 800 ms to 1200 ms in steps of 100 ms. The
participants were required to press the bottom at
2300 ms after visual cue. This target interval was
fixed. A score of a trial was described as a function
of response error (time difference between an actual
response interval and the target interval). We termed
it “score function”.
There were two conditions tested with different
score functions. One was No Risk condition that had
a symmetric score function (Figure 1B). When the
participants responded within the target interval,
they receive a score for a trial as a positive linear
function of response interval. In addition, when the
participants responded after the target time, they
received a score as a negative linear function of
response interval. The maximum possible score of
100 point was associated with responding to the
target time perfectly.
The other was Risk condition that had an
asymmetric score function (Figure 1C). In Risk
condition, the highest gain (100 point) got closer to
zero. Within the target interval, the same score
function as that in No Risk condition was applied.
However, no score was given if the participants
responded after the target time. We termed it “miss
trial” in which they were cautioned by an unpleasant
alarm and flashed red lamp on the screen.
Figure 1: Experimental task. (A) Illustration of time
sequence. First waning tone was ringed. After randomized
foreperiod duration, visual cue was presented. The
participants were required to press the bottom at the target
time (2300ms) after the visual cue. A response error (time
difference between a response interval and the target
interval) was given to the participants in every trial. (B)
Symmetric score function in No Risk condition. A score
for a trial was given when the participants responded over
the target time. (C) Asymmetric score function in Risk
condition. A score for a trial was not given (i.e., 0 point),
if they responded after the target time. This “miss trial”
was cautioned.
We provided the participants with response error,
score for a trial and accumulated total score in each
trial. We also gave verbal instructions describing the
score function before each condition. The
participants performed 10 trials training, 100 trials in
No Risk condition and lastly 100 trials in Risk
condition. The participants were instructed to
maximize total score in each condition.
icSPORTS2013-InternationalCongressonSportsScienceResearchandTechnologySupport
14
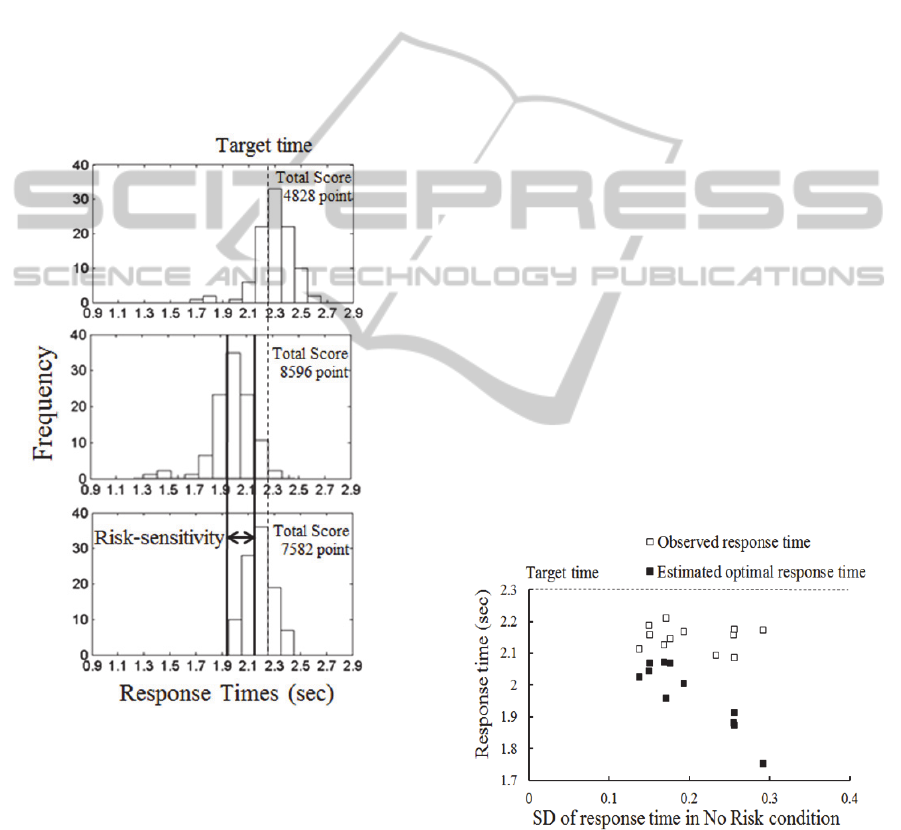
2.2 Definition of Risk-sensitivity
We applied the score function of Risk condition to
the obtained distribution of response time in No Risk
condition (Figure 2Upper panel). We then calculated
the optimal mean response time by simply shifting
the distribution until the highest total score was
obtained (Figure 2Middle panel). The estimated
optimal mean response time was always smaller than
the target time given each participant’s own variance
in response time. This can be regarded as a
theoretical risk-neutral optimal response. Finally, we
defined risk-sensitivity as the difference between the
observed mean response time and the optimal mean
response time (Figure 2Lower panel).
Figure 2: Procedure of estimating risk-sensitivity. (Upper
panel) We applied the score function of Risk condition to
the obtained distribution of response time in No Risk
condition. (Middle panel) We shifted the distribution until
the highest total score was obtained. Left solid line means
the estimated optimal mean response time. (Lower panel)
We showed the distribution of response time in Risk
condition. Right solid line means the observed mean
response time. Risk-sensitivity was defined as the
difference between the observed and the optimal responses.
Positive risk-sensitivity value indicates that the
participants pressed the button later than the optimal
timing (risk-seeking response), and negative risk-
sensitivity value indicates that the participants
pressed the button sooner than the optimal timing
(risk-averse response).
2.3 Inter-individual Differences
In addition to the risk-sensitivity based on all the
trials, it would be interesting to see inter-individual
differences based on trial-by-trial analysis. We
focused on presages of miss trials and recovery from
miss trials in Risk condition. Trial-by-trial analysis
would explain inter-individual difference in
performing the task. We compared histograms of
response time in trials which are previous to miss
trials and that in trials which are preceded by success
trials. We also compared histograms of response
time from the trials following to miss and success. In
this paper, examples of two participants are
discussed.
3 RESULTS
All the participants took an inappropriate risk for
their own variance in response time. Observed
response time and estimated optimal response time
are plotted against standard deviation (SD) of
response time in No Risk condition for all twelve
participants (Figure 3). The observed response time
was higher than the estimated optimal response time
for all the participants, and thus positive risk-
sensitivity was observed.
Figure 3: Risk seeking strategy taken by the participants.
Theoretically, optimal response time (filled squares) must
be smaller than the target time as a function of one’s
variability in response time (x axis shows SD of response
time in No Risk condition as an index of the variability).
However, observed response time (open squares) was
higher than the estimated response time for all the
participants, which indicates that they took higher risk for
their own variability.
SuboptimalStrategyinPerformingCoincidentTimingTaskunderRisk
15
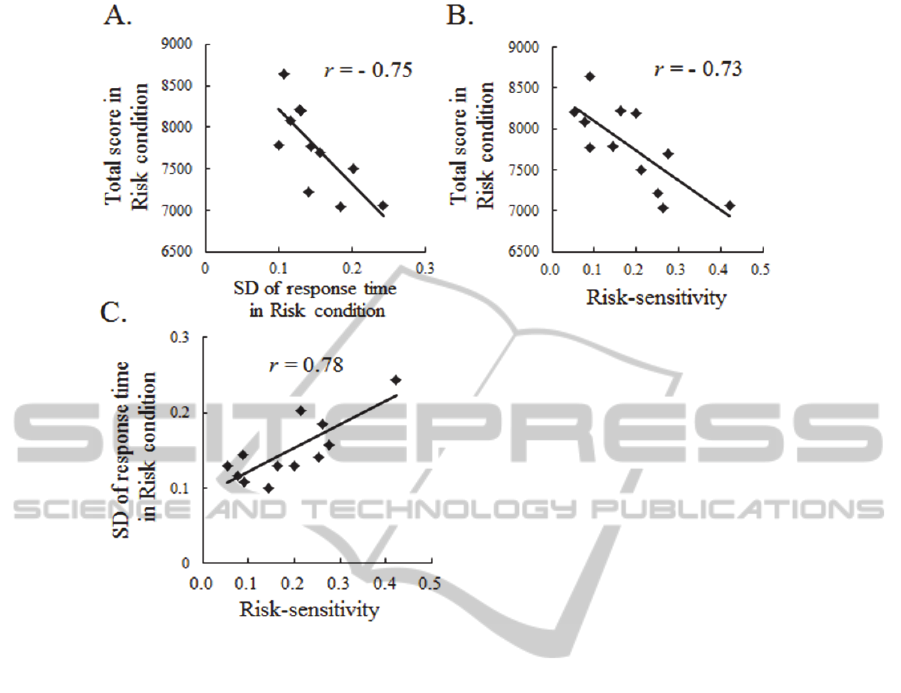
Figure 4: The results of correlation analysis. Negative correlation between SD of response time in Risk condition and total
score in Risk condition (A), negative correlation between risk-sensitivity and total score in Risk condition (B), positive
correlation between risk-sensitivity and SD of response time in Risk condition (C).
We then analyzed the effect of the variance in
response time and the risk-sensitivity on the total
score by calculating Pearson’s correlation coefficient
between them. The total score was affected not only
by response variance but also by suboptimal risky
strategy. The risk-sensitivity, as well as SD of
response time, had a strong negative correlation
between the total score (Figures 4 A&B; r = -0.75, p
< .01; r = -0.73, p < .01, respectively). Moreover,
there was strong positive correlation between SD of
response time and risk-sensitivity (Fig. 4C; r = 0.78,
p < .01). The result suggests that the larger response
variance is (i.e., less accurate in response time), the
higher value of positive risk-sensitivity the
participants had. The participants responded closer
to the target time even though they had large
response variance, thus, the value of risk-sensitivity
was high.
We also investigated inter-individual differences
based on trial-by-trial analysis. Examples of two
participants were shown in Figure 5. The histogram
of response time on the whole trials in Risk
condition are shown in Figures 5A and 5B. The
response times are normally distributed in both
histograms. The histograms from the trials before
miss (filled bars) and success (open bars) are shown
in Figures 5C and 5D. The shape of the histograms
from the trials before miss was similar to that from
the trials before success. It was not also different
between participants. This would suggest that miss
responses randomly occurred: miss responses were
independent on the response in the previous trials.
However, the histogram of response time from the
trials following to miss (filled bars) had obviously
different shape with that from the trials following to
success (open bars) in participant 2 (Figure 5F).
Earlier responses to the target time were shown after
miss trials more than after success trials. This would
indicate that participant 2 made a large
compensation after miss trials. He might strongly
avoid consecutive miss. On the contrary, such
tendency was not shown in participant 1 (Figure 5E).
In Figure 5E, some responses after miss trials were
plotted over the target time in contrast to Figure 5F,
which indicated that consecutive misses were shown
in participant 1.
icSPORTS2013-InternationalCongressonSportsScienceResearchandTechnologySupport
16
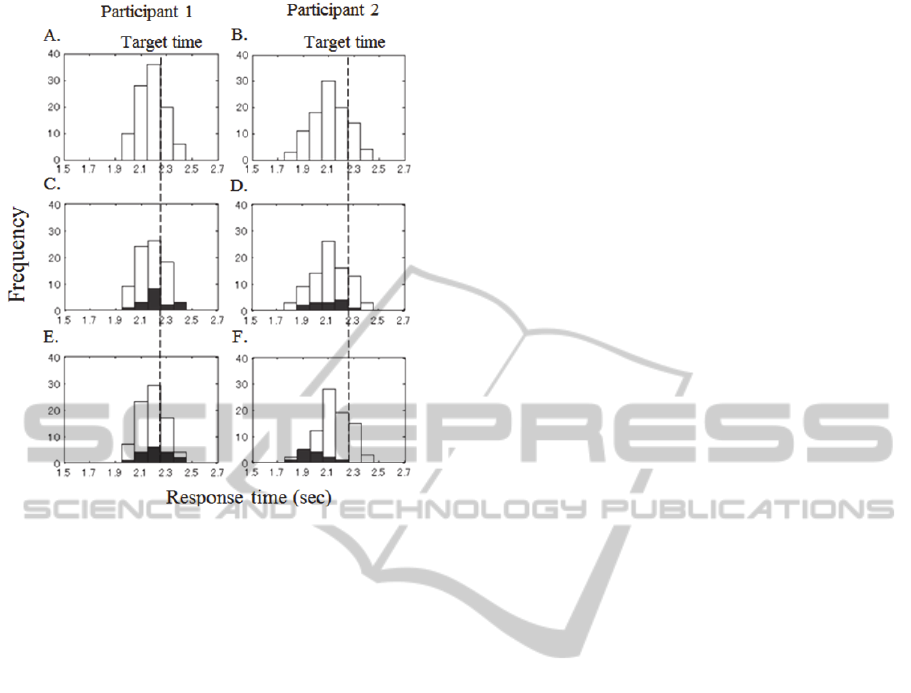
Figure 5: Inter-individual differences in trial by trial
compensation. Examples of two participants are shown.
(A, B) Histograms of response time on the whole trials in
Risk condition. Both histograms are normally distributed.
(C, D) Histograms of response time from the trials before
miss (filled bars) and success (open bars). Histograms
have a similar shape between them and between the
participants. (E, F) Histogram of response time from the
trials following to miss (filled bars) and success (open
bars). In participants 2, earlier responses to the target time
are shown after miss trials more than after success trials.
In participants 1, consecutive misses were shown.
4 DISCUSSION
This is the first study to assess the relationship
between risk-sensitivity and task performance. We
showed that the participants tended to be risk-
seeking under a risk situation where high gain and
zero gain are joining to each other. This risk-seeking
strategy, as well as response variability, had a
significant effect on degrading the task performance.
In Risk condition, the observed response time
was closer to the target time than the theoretically
calculated optimal response time, that is, all the
participants tended to be risk-seeking. Cumulative
prospect theory (Tversky and Kahneman, 1992)
would explain that this tendency might be due to
underestimation of their own response variance (Wu
et al., 2009); (O’Brien and Ahmed, 2013);
(Nagengast, et al 2011). The participants might
believe themselves to have smaller response
variability than they actually have, which would
likely influence them to respond closer to the target
time.
The asymmetric score function was applied in
Risk condition. Wu et al., (2006) found that
participants performed suboptimally when pointing
in the asymmetric expected gain landscape. On the
other hand, Trommershäuser et al., (2003a; 2003b)
showed risk-neutral and optimal movement planning
in the symmetric expected gain landscape. Our
participants might not be able to perform a
theoretically optimal strategy under the asymmetric
score function. This was confirmed by calculating
the difference between the observed total score and
the theoretically calculated total score. From the
typical example in Figure 2, this participant could
improve 924 points that was calculated by
subtracting the observed total score (i.e., 7582
points) from the optimal total score (i.e., 8596
points).
Risk-seeking behaviours are sometimes observed
in real sports fields. For example, professional NBA
basketball players attempt consecutive three point
shots after they successfully scored three points even
though the probability of taking points is decreased
(Neiman and Lowenstein, 2011). They may believe
they will succeed again. Therefore, suboptimal
decision-making would have the effect on degrading
a performance of beginners as well as experts in a
variety of sports.
We also investigated inter-individual differences
in responses following miss trials. In participants 2
in Figure 5F, earlier responses to the target time
were shown after miss trials more often than after
success trials. This indicated that he made a large
compensation with a different strategy. This
tendency was not shown in participants 1 (Figure
5E). The histogram of the response time from the
trials following to miss had similar shape to that
from the trials following to success. In contrast to
Figure 5F, some responses were plotted over the
target time, which indicated that consecutive misses
were shown. For this participant, the total score will
surely increase by responding within the target time
with surely strategy to avoid consecutive miss. The
behaviour following to miss would be an important
factor to explain the individual response pattern.
Thus, we need to investigate how these differences
are produced in future studies.
As implication for real sports field, our results
suggest that it is important to evaluate and improve
optimal strategy depending on each player’s skill
level. Coaches and trainers often instruct how to
move a body focusing on a form itself. In addition to
SuboptimalStrategyinPerformingCoincidentTimingTaskunderRisk
17

such instruction, instruction based on the
improvement of risk-handling strategy leads to
organize better training.
5 CONCLUSIONS
Under risk situation where high gain and zero gain
are joining to each other, optimal strategy can be
calculated depending on the player’s variability.
However, the participants tended to take higher risk,
possibly because of their underestimation of
variability. This suboptimal decision-making
resulted in reducing the total score. Therefore,
improving the risk-handling strategy can contribute
to improve task performance both for beginners and
experts in a variety of sports.
REFFERENCES
Kahneman, D., & Tversky, A. (1979). Prospect theory:
An analysis of decision under risk. Econometrica, 47,
263-291.
Nagengast, A. J., Braun, D. A., & Wolpert, D. M. (2010).
Risk-sensitive optimal feedback control accounts for
sensorimotor behavior under uncertainty. PLoS Comput
Biol, 6, e1000419.
Nagengast, A. J., Braun, D. A., & Wolpert, D. M. (2011).
Risk-sensitivity and the mean-variance trade-off:
decision making in sensorimotor control. Proc. R. Soc,
278, 2325–2332.
Neiman, T., & Loewenstein, Y. (2011). Reinforcement
learning in professional basketball players. Nat
Commun, 2; Article 569.
O’Brien, M. K., & Amed, A. A. (2013). Does risk
sensitivity transfer across movements?. J Neurophysiol,
109, 1866-1875.
Trommeshäuser, J., Maloney, L. T., & Landy, M. S.
(2003a). Statistical decision theory and trade-offs in the
control of motor response. Spatial Vis, 16(3-4), 255-
275.
Trommeshäuser, J., Maloney, L. T., & Landy, M. S.
(2003b). Statistical decision theory and the selection of
rapid, goal-directed movements. J. Opt. Soc. Am. A,
20(7), 1419-1433.
Trommeshäuser, J., Gepshtein, S., Maloney, L. T., &
Banks, M. S. (2005). Optimal compensation for changes
in task-relevant movement variability. J Neurosci,
25(31), 7169-7178.
Tversky, A., & Kahneman, D. (1992). Advances in
prospect theory: cumulative representation of
uncertainly. J Risk Uncertain, 5, 297-323.
von Neumann, J., & Morgenstern, O. (1944). Theory of
Games and Economic bahavior. Princeton, Princeton
Univ Press.
Wu, S. W., Delgado, M. R., & Maloney, L. T. (2009).
Economic decision-making compared with an
equivalent motor task. Proc. Nat Acad. Sci. USA, 106,
6088-6093.
Wu, S. W., Trommeshäuser, J., Maloney, L. T., & Landy,
M. S. (2006). Limits to human movement planning in
tasks with asymmetric gain landscapes. J vis, 6, 53-63.
icSPORTS2013-InternationalCongressonSportsScienceResearchandTechnologySupport
18
