
Dynamics of a Stimulation-evoked ECoG Potential During Stroke
Rehabilitation
A Case Study
Armin Walter
1
, Georgios Naros
2,3
, Martin Sp¨uler
1
, Wolfgang Rosenstiel
1
, Alireza Gharabaghi
2,3
and Martin Bogdan
1,4
1
Department of Computer Engineering, Wilhelm Schickard Institute, University of T¨ubingen, T¨ubingen, Germany
2
Werner Reichardt Centre for Integrative Neuroscience, University of T¨ubingen, T¨ubingen, Germany
3
Department of Neurosurgery, University Hospital, University of T¨ubingen, T¨ubingen, Germany
4
Department of Computer Engineering, University of Leipzig, Leipzig, Germany
Keywords:
Cortical Stimulation, Stroke, Electrocorticography, Evoked Activity, CCEP, Latency.
Abstract:
Cortical stimulation is being investigated as a possible tool to support stroke rehabilitation. In particular the
analysis of stimulation-evoked neural activity during the rehabilitation process might be helpful to gain a better
understanding of the brain reorganization associated with functional recovery after stroke. In this paper, the
stimulation-evoked brain activity from a patient with implanted epidural electrodes undergoing an interven-
tion using of brain-computer interfaces combined with cortical stimulation for stroke rehabilitation has been
analyzed. We identified a component of the evoked cortical activity that exhibited several characteristics that
have not been described before: A significant latency decrease over the course of the rehabilitation training, a
significantly smaller latency if the patient attempted to move his paralyzed hand compared to rest and a sig-
nificant correlation of the latency with the spectral power of the ECoG signal. In addition to the latency, other
parameters such as the peak amplitude of the evoked activity were tested as well, but showed a smaller effect
size. We hypothesize that such “dynamic” components of the evoked activity that appear to be correlated with
the rehabilitation process and the ongoing brain signal could be a target for future closed-loop stimulation
systems.
1 INTRODUCTION
Brain stimulation is a powerful tool for clinical
practice and research for several reasons: First,
stimulation is thought to modulate the activity of
the stimulated brain area. This makes it useful for
example for the treatment of chronic pain (Tsub-
okawa et al., 1991) and it is also investigated for
stroke rehabilitation (Hummel and Cohen, 2006).
Secondly, if one measures the cortical responses
(cortico-cortical evoked potentials, CCEPs) to short
stimulation pulses, one can derive information about
the functional and effective neural connectivity
(Matsumoto et al., 2004) within the brain.
It is important to note that these evoked potentials
provide a stable measure: At least for transcranial
magnetic stimulation (TMS) and EEG, it has been
shown that the evoked cortical response is repro-
ducible from session to session (Lioumis et al., 2009;
Casarotto et al., 2010). Thus, observed changes
in the evoked activity between sessions give an
indication that general changes in neural connectivity
might have happened over time. However, there is
considerable variability in the shape of the response
within the same session, even if constant stimulation
parameters are used. Some of the variance of the
neural responses to a certain set of stimulation pa-
rameters can be explained by the concept of cortical
excitability: How easily a brain area is activated
by stimulation varies for example depending on the
task of the stimulated person (Nikulin et al., 2003;
Morishima et al., 2009) or the state of consciousness
(Massimini et al., 2005). Task-dependent differences
in the evoked activity within a session might therefore
help to illuminate the role the stimulated brain area
and the area where the answer is recorded play in the
processing of the task.
These points make the analysis of such
241
Walter A., Naros G., Spüler M., Rosenstiel W., Gharabaghi A. and Bogdan M..
Dynamics of a Stimulation-evoked ECoG Potential During Stroke Rehabilitation - A Case Study.
DOI: 10.5220/0004644302410248
In Proceedings of the International Congress on Neurotechnology, Electronics and Informatics (BrainRehab-2013), pages 241-248
ISBN: 978-989-8565-80-8
Copyright
c
2013 SCITEPRESS (Science and Technology Publications, Lda.)

stimulation-evoked potentials very interesting in
the context of motor recovery after stroke: Rehabil-
itation treatments can induce cortical reorganization
(Liepert et al., 2000) which should be accompanied
by observable changes in the evoked neural activity,
motivating the use of these potentials to monitor the
reorganization process. More information about the
processes behind such “dynamic” components of
the evoked activity can be gained, if the stimulation
is then applied while the patient performs different
tasks. The task-dependent behavior could then help
to identify, which processing steps within the brain
have been influenced by the treatment.
Such an improved understanding of the interac-
tion between stimulation and brain reorganization
might lead to novel treatment options for the patients.
For example, it has been suggested that closed-loop
stimulation for stroke rehabilitation might be more
effective than the current open-loop paradigms (Plow
et al., 2009). One could envision a closed-loop
paradigm where stimulation parameters are adapted
to the ongoing brain activity in order to closely
control evoked potentials connected to the treatment,
an approach which has been shown to be feasible in
an animal model (Brugger et al., 2011). A necessary
prerequisite in order to realize such a system for
human patients is that there has to be an influence
of the measurable prestimulus neural activity on
the stimulation-evoked potential. For motor-evoked
potentials (MEPs), conflicting results are reported
in the literature, with some studies concluding that
the prestimulus spectral power or coherence of the
EEG influences the MEP amplitude (e.g. (Schulz
et al., 2013)), while other studies fail to find such
a relationship (Mitchell et al., 2007; van Elswijk
et al., 2010). In the case of evoked cortical activity,
a relationship between the amplitude of slow oscil-
lations during sleep and the amplitude of the evoked
activity has been described (Bergmann et al., 2012),
but during wakefulness, where the cortical responses
to stimulation vastly differs from those during sleep
(Massimini et al., 2005), no similar influence has
been reported.
In our work with hemiparetic stroke patients who
underwent implantation of epidural electrodes for the
investigation of the combination of brain-computer
interfaces and cortical stimulation for stroke re-
habilitation (Walter et al., 2009), we analyzed the
CCEPs in several experiments over the course of the
intervention. In this paper we present results from
one patient with a paralyzed hand where we found
a component of the evoked cortical activity after
epidural electrical stimulation which exhibited an
interesting behavior: The latency of this component
decreased over the course of the treatment and
was significantly depending on whether the patient
attempted to move the paralyzed hand or not. We also
show that there was a significant correlation between
the latency of the component and the spectral power
of the ECoG signal before the stimulus. This study
provides novel insights into stimulation-evoked
potentials, because it is the first time that such an
analysis is conducted with (i) a stroke patient who (ii)
participated in the same experiment repeatedly over
several weeks while (iii) undergoing an intervention
attempting to induce neural reorganization using (iv)
implanted electrodes for recording and stimulation.
Almost all other studies on this topic are conducted
with healthy participants and thus restricted to the
use of noninvasive methods such as combined EEG
and TMS.
2 MATERIALS AND METHODS
2.1 Patient
Patient P1 (male, 56 years old) had suffered a stroke
in the right hemisphere 80 months prior to the
study, leading to paralysis of the left hand. He was
implanted with 16 epidural electrodes (Resume II,
Medtronic, Fridley, USA) on 4 strips, arranged in a
4x4 grid covering parts of the primary somatonsen-
sory (S1), primary motor (M1) and premotor cortex
(PMC). The grid was centered over the MEP hotspot
for the extensor digitorum communis muscle as deter-
mined by a TMS mapping (Wassermann et al., 2008)
before the surgery. More details on the patient and the
electrodes can be found in (Walter et al., 2012). The
electrode layout is shown in figure 1 (left).
The external connections to the electrodes were
present for four weeks and then internalized in a sec-
ond surgery. During these 4 weeks, the patient re-
ceived daily rehabilitation sessions and participated
also in the experiment reported in section 2.4.
2.2 Electrophysiological Recording
ECoG was recorded with a monopolar amplifier
(BrainAmp DC, BrainProducts, Munich, Germany)
with a sampling rate of 1000 Hz and a high-pass fil-
ter with a cutoff frequency of 0.16 Hz. ECoG was
recorded from all epidural electrodes, with the ex-
ception of the stimulation electrode and one electrode
over the somatosensory cortex which was used as the
reference. In the first session, channel 1 in the setup of
figure 1 was used; in all following sessions channel 4.
Apart from the ECoG, EMG was recorded as well on
NEUROTECHNIX2013-InternationalCongressonNeurotechnology,ElectronicsandInformatics
242
P1
200 400 600
−50
0
50
1
msec
µV
200 400 600
2
msec
200 400 600
3
msec
200 400 600
4
msec
−50
0
50
5
µV
6 8
−50
0
50
9
µV
10 11 12
−50
0
50
14
µV
15 16
100 200 300 400 500 600
−50
0
50
8
msec
µV
movement
rest
significant
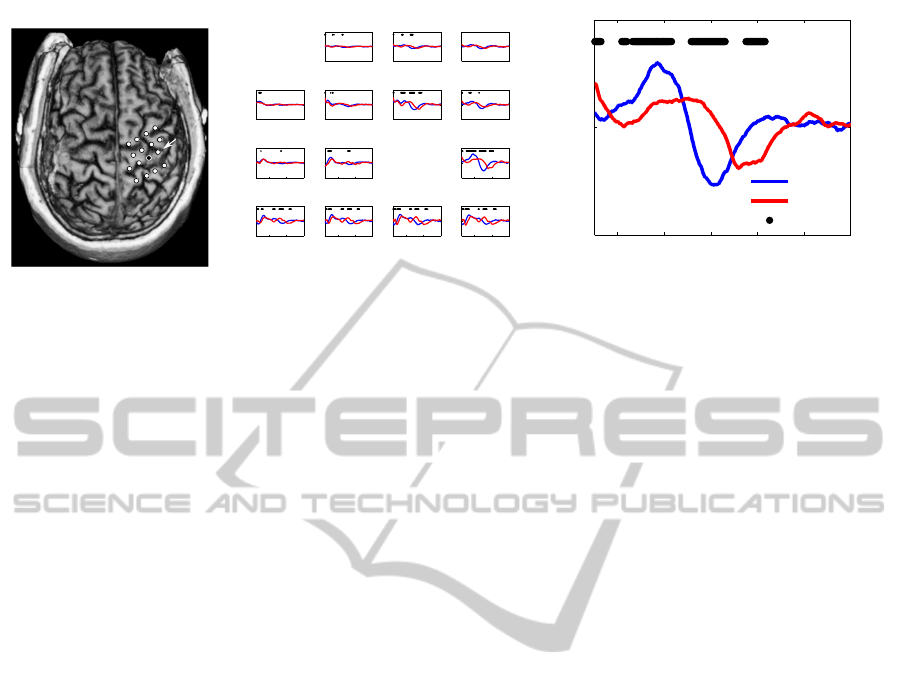
Figure 1: Left: Overlay of the epidural electrode positions with the MRI of P1. White circles: recording electrodes, black
circle: stimulation electrode. Channel 1 is in the lower left corner, channel 4 in the lower right corner, channel 16 in the upper
right corner and so on. White arrow: Position of channel 8. Center: Average CCEP for stimuli in the movement (blue) and
rest (red) phase for all channels, 50 - 600 msec after the pulse. Black dots mark samples with a significant difference in the
amplitude between conditions. Channel 13 on the upper left corner was the reference, therefore it is missing. Data stems for
the third session with P1. Right: Zoom on the averaged CCEPs per condition for channel 8.
the left hand and arm, but it did not play a role for this
analysis. A 50x90 mm adhesive electrode placed un-
der the left clavicle of the patient served as the ground
electrode for the recording. Prior to further analysis,
the ECoG data was re-referenced to channel 13 on the
frontomedial corner of the electrode grid.
2.3 Cortical Stimulation
For epidural electrical stimulation we used an STG
4008 stimulus generator (MultiChannel Systems,
Reutlingen, Germany), capable of a maximum output
current of 16 mA. Stimulation was applied with single
anodal biphasic rectangular symmetric pulses with a
length of 500 µsec and an intensity of 7 mA. The ad-
hesive electrode on the left clavicle of the patient also
served as the cathode for stimulation. The intensity of
7 mA was selected because a single pulse with this in-
tensity consistently evokedsmall MEPs on the left ex-
tensor digitorum communis (EDC) muscle of the pa-
tient. The stimulation pulses were given continuously
throughout the experiment with a fixed inter-stimulus
interval of 2 seconds and a small jitter of ± 40 msec.
2.4 Experiment
The data analyzed here stems from the open-loop
stimulation experiment described in (Walter et al.,
2012). In short, the patient was sitting in a chair with
his left arm and hand fixed to a commercially avail-
able rehabilitation device (Tyromotion Amadeo HTS,
Graz, Austria). This orthosis was capable of opening
and closing the paralyzed hand of the patient.
The task of the patient was to attempt to open his
paralyzed hand on cue. Each trial consisted of three
phases: preparation(2 sec), movement (6 sec) and rest
(8 sec). During preparation, the participant received
an auditory cue but was instructed to wait with the
execution until the ”Go!” command was given at the
start of the movement phase. During the movement
phase, starting with a closed position of the left hand,
the participant had to try to open the left hand until
the end of the movement phase. At that point, another
auditory cue (”Relax!”) was given. During the rest
period, the hand of the participant was returned to its
original closed position which took about 2-3 seconds
and the participant was instructed to relax. This task
design was adapted from (Ramos-Murguialday et al.,
2013) who used it in a noninvasive BCI-guided reha-
bilitation study with stroke patients, but without stim-
ulation.
During the movement phase, the spectral power of
the ECoG recorded on channels over S1 and M1 be-
tween 16 and 22 Hz was extracted and used as input
for an adaptive linear classifier to detect online when
the patient is trying to move the paralyzed hand. This
makes use of the well-known event-related desyn-
chronization (Pfurtscheller and Lopes da Silva, 1999)
of sensorimotor and β rhythms during movements. If
such an intention was found, the orthosis continued
to open the hand, otherwise it was stopped. For the
computation of the spectral power in the presence of
stimulation artifacts, the methods from Walter et al.
(2012) were used.
Over the course of 4 weeks, the experiment was
repeated with the patient weekly, 4 times in total. Per
session, between 42 and 48 trials were conducted.
Regarding stimulation, between 130 and 143 stimuli
were applied during the movement phases and be-
tween 174 and 200 stimuli within the rest phases.
There are more stimuli in the rest phase due to the
greater length of this phase compared to the move-
DynamicsofaStimulation-evokedECoGPotentialDuringStrokeRehabilitation-ACaseStudy
243

Table 1: CCEP parameter for measured signal s(t).
Parameter Computation
Latency τ Woody’s method
Positive peak max{s(τ+ t), −200 ≤ t ≤ 200}
Negative peak min{s(τ+t), −200 ≤ t ≤ 200}
Area
∑
τ+200
t=τ−200
s(t)
Absolute area
∑
τ+200
t=τ−200
|s(t)|
Table 2: Number of stimuli in the analysis.
Session Movement Rest
1 141 166
2 133 159
3 128 169
4 140 196
ment (8 sec vs. 6 sec).
For each of these stimuli, the spectral power of the
prestimulus data and several parameters for the CCEP
were extracted.
2.5 Parametrization of CCEPs
After visual inspection, the late CCEP was most pro-
nounced on channel 8, thus this channel was used
for further analysis (see figure 1). The latency of
the CCEP component was estimated with Woody’s
method (Woody, 1967): A template was constructed
by averaging the evoked potentials from stimuli in the
movement phase for the time window between 100
and 600 msec after the stimulation pulse. The cross-
correlation of this template with the evoked wave-
forms then yields the latency of the component for
each individual stimulus.
Other extracted parameters are the amplitude of
the strongest positive and strongest negative peak, the
sum of all amplitudes and the sum of the absolute am-
plitudes (table 1). Visual inspection revealed that the
CCEP was contained within an area of ± 200 msec
around the strongest negative peak. Thus, the peak
and area parameters were computed in this range. 11
stimuli of the rest phase of session 1 and 13 of the
rest phase of session 2 were removed from further
analysis, because no proper fit of the template could
be obtained for them, leading to non-meaningful lag
estimations. Furthermore, if no positive or negative
peak could be found, the stimulus was removed as
well from further analysis. Due to this condition, 23
more stimuli were removed. The number of stimuli
per condition and session that entered the analysis are
given in table 2.
2.6 Spectral Analysis
We used autoregressive (AR) models to estimate the
spectral power before each stimulus. To this end, one
second of the signal directly before the stimulus was
extracted and an AR model of order 50 was fitted to
the data and evaluated at frequencies between 5 and
100 Hz in steps of 1 Hz.
2.7 Statistical Analysis
The dependency of the CCEP parameters on the fac-
tors session and movement condition was assessed
with a two-way ANOVA because we found no strong
deviations from normality in the residuals. Post hoc
tests were conducted with unpaired t tests.
We performed permutation tests to investigate
whether there is a significant correlation between
the prestimulus spectral power and parameters of
the evoked component and which time points of the
poststimulus signal have significantly differing ampli-
tudes for movement and rest.
The Spearman correlation coefficient ρ was used
as a nonparametricmeasure of a monotonousrelation-
ship between the spectral power and the CCEP param-
eters. The significance of the correlation was assessed
with a permutation test, repeated 3000 times. In each
repetition k, ρ
f
i
,k
between the spectral power values
at each frequency f
i
∈ 5, . . . , 100 Hz and a random
permutation of the CCEP parameter values was com-
puted and m
k
= max(|ρ
f
i
,k
|) was extracted and aggre-
gated in the set M = {m
k
}
k=1,...,3000
. The significance
threshold for |ρ| at the α = 0.05 level was set as the
value of M corresponding to the one-tailed (1-α)100
th
percentile of M.
Significant differences in the evoked activity be-
tween the movement and the rest phase of the trial
(shown for an example in figure 1) were assessed in a
similar way: For each time point, Cohen’s d for un-
equal sample sizes was used as a measure for the dif-
ference between the stimuli in each condition. The
condition labels were permuted 3000 times and d
t
i
,k
was computed for each repetition k and poststimulus
time point t
i
. The maximum m
′
k
= max(d
t
i
,k
) of each
repetition was stored in a set M
′
= {m
′
k
}
k=1,...,3000
,
yielding the significance threshold for d. However,
in contrast to above, because this procedure was per-
formed for all recording channels, the threshold was
taken at the α =
0.05
C
level, where C is the number of
recording channels. In the case displayed in figure 1:
C=14.
NEUROTECHNIX2013-InternationalCongressonNeurotechnology,ElectronicsandInformatics
244
250 300 350 400 450 500 550
rest
move
rest
move
rest
move
rest
move
Week 4
Week 3
Week 2
Week 1
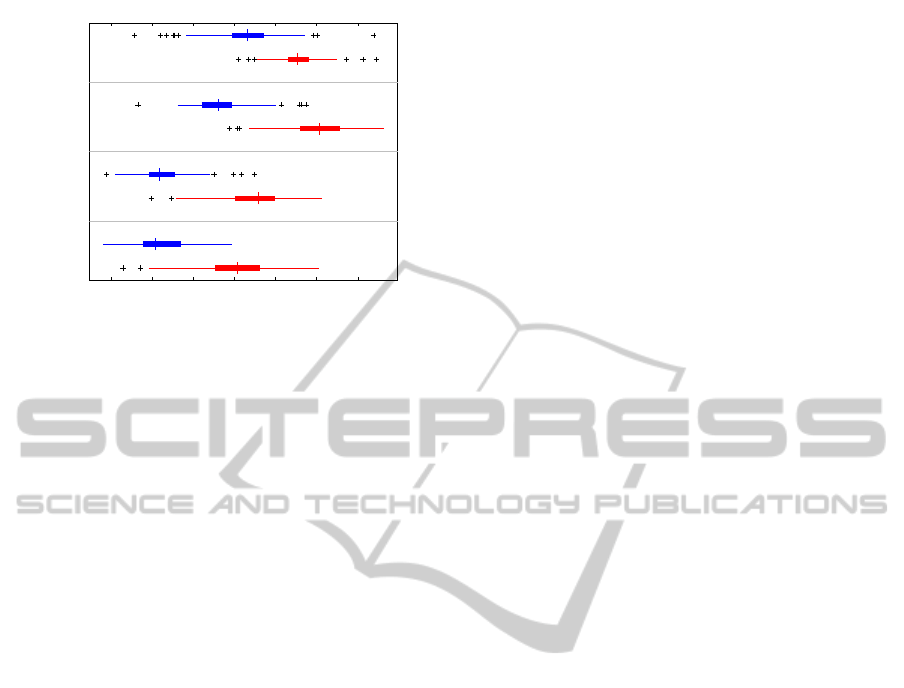
Latency [msec]
Latency
Figure 2: Single-trial latency of the evoked component,
grouped by condition and session.
3 RESULTS
3.1 Influence of Time and Movement
Condition
The patient participated in the experiment 4 times
with a time difference of 1 week between sessions.
We found a significant, consistent reduction in the
latency over time and a strong difference between
conditions (figure 2). This was confirmed by a
two-way ANOVA with factors condition and session,
where a significant effect was found for the condi-
tion (F(1,1218) = 2244.6, p < 0.001), the session
(F(3,1218) = 518.5, p < 0.001) and the interaction be-
tween the two (F(3,1218) = 41.5, p < 0.001). Within
each session, the latency during movements was con-
sistently smaller than during rest (one-sided t tests, all
p < 0.001). For the other parameters, the factor ses-
sion was always significant and the condition for the
area and the negative peak amplitude. The interac-
tion between both factors was significant for the area
and the absolute area, but not the peak measures. The
detailed ANOVA tables and graphs for these parame-
ters are found in appendix 4. The comparison of the
graphs in figure 4 with figure 2 make it clear that the
effect size for the latency is much greater than for the
other parameters.
3.2 Influence of Prestimulus Spectral
Power
The left part of figure 3 shows that there is a signif-
icant correlation between the spectral power before
the stimulus and the extracted CCEP parameters, es-
pecially in the range of 10-40 Hz, roughly encom-
passing parts of the α band and the β band. Across
sessions, this correlation is best preserved for the la-
tency and to alesser extent for the area. However, one
might argue that this correlation is simply an effect
of a switch in the ”brain state” between the move-
ment and the rest phase. It is well known that the
spectral power of the brain rhythms differs between
these tasks (Pfurtscheller and Lopes da Silva, 1999)
and also that the excitability of the motor cortex is
higher during movements than during rest (Fadiga
et al., 1999). Thus, when taking all stimuli into ac-
count, this correlation might simply be an epiphe-
nomenon of the changing brain state.
For this reason, we also looked at the CCEPs when
only stimuli within the movement phase are taken
into account (figure 3, right). We found that in this
case, there is still a significant reproducible correla-
tion present for the latency, again most pronounced
for the β band, but that it vanishes for the other param-
eters. Because no direct change of the brain state is
expected here, the correlation could indicate a direct
influence of the spectral power of the ongoing brain
activity on the component latency.
4 DISCUSSION
In patient P1, we identified a component of the
stimulation-evoked cortical activity which exhibited
an interesting behavior. First of all, in the first exper-
imental session, the peak of this component occurred
with a latency of 447.84 ± 43.66 msec (mean ± std).
Although the literature characterizing CCEPs from
epidural stimulation is scarce, TMS-evoked EEG re-
sponses in healthy persons last only for up to 300
msec after the pulse (Ferreri et al., 2011). If we ex-
pect a more or less similar behavior for epidural stim-
ulation, such a late component is certainly an odd-
ity. Secondly, we found that there was a clear dif-
ference in the shape and latency of this component
depending on whether the patient was attempting to
move the paralyzed hand (movement phase) or rest-
ing (rest phase). Thirdly, because the experiment was
repeated weekly over the course of 4 weeks, we were
able to observe the evolution of this potential while
the patient performed the rehabilitation training. We
found a coherent reduction of the latency across ses-
sions. Taken together, this means we have found an
evoked potential which had a possible relationship to
the motor system of the paralyzed limb (difference
between movement and rest), had very atypical char-
acteristics at first (high latency) which became less
atypical over the course of the rehabilitation train-
ing (reduction in latency across time). Thus, this po-
DynamicsofaStimulation-evokedECoGPotentialDuringStrokeRehabilitation-ACaseStudy
245

latency
Frequency [Hz]
1 2 3 4
10
20
30
40
50
60
70
80
90
100
pos peak
1 2 3 4
neg peak
Session number
1 2 3 4
area
1 2 3 4
abs area
ρ
1 2 3 4
−0.5
0
0.5
latency
Frequency [Hz]
1 2 3 4
10
20
30
40
50
60
70
80
90
100
pos peak
1 2 3 4
neg peak
Session number
1 2 3 4
area
1 2 3 4
abs area
ρ
1 2 3 4
−0.5
0
0.5
Figure 3: Significant correlations between parameters of the CCEP and the prestimulus spectral power. Left: all stimuli.
Right: Only stimuli during the movement phase.
tential might serve as a correlate for rehabilitation.
Furthermore, the analysis showed a significant rela-
tionship between the prestimulus spectral power and
the latency of the component. The positive correla-
tion between the latency and the spectral power was
most prominent in the β-band, meaning that higher
β-power is associated with a longer latency. This is
consistent with studies on the relationship between
EEG and TMS-evoked MEPs that implicated β-band
power as an inhibitory mechanism in the motor sys-
tem (Schulz et al., 2013) and also with the event-
related desynchronization of β oscillations during at-
tempted movements. On the level of CCEPs, how-
ever, such a relationship has not been reported, yet.
An earlier study with combined EEG and TMS had
identified movement-related changes in the evoked
brain activity for an N100 component (Nikulin et al.,
2003). They demonstrated a decrease in the ampli-
tude and an increase in latency for the N100 during
movement compared with rest and hypothesized that
the N100 is an inhibitory response that is suppressed
during movements. The evoked potential described
here exhibits the opposite behavior at least for the la-
tency, thus we can speculate that it might represent an
excitatory response.
From this, a closed-loop system could be feasible
which uses online spectral analysis to predict the la-
tency of the evoked activity, stimulating only if this
prediction is within a predefined range in order to re-
duce the variance of the stimulation effect. It would
be very interesting to see whether such an optimized
closed-loop stimulation protocol had an impact on the
recovery of motor function.
Unfortunately, the external connection with the
implanted electrodes of the patient had been removed
in a second surgery before further experiments on this
issue with the patient could take place. Although the
experiment was repeated in two more chronic stroke
patients, no comparable CCEP component could be
identified. It is unclear whether the occurrence of the
component analyzed here was just due to the specific
pathophysiology of patient P1 or if it might be repro-
ducible in more patients. For this reason, it would be
very interesting to perform this or a similar experi-
ment with other stroke patients undergoing rehabili-
tative training. It might not be necessary to use im-
planted electrodes for these experiments as combined
EEG and TMS might suffice. One great advantage
of the implanted electrdoes is, however, that these are
fixed in place, eliminating the possibility that the sen-
sitivity of evoked potentials to the stimulation posi-
tion (Casarotto et al., 2010) influences the analysis.
Similarly, instead of an online analysis of the brain
activity, it might be enough to have the patient per-
form cued attempts to move the paralyzed limb, as
long as one retains the concept of applying single
suprathreshold stimulation pulses over the hotspot of
MEP generation on the paralyzed limb in the lesioned
hemisphere. If the hypothesis is correct that such a
late potential is a correlate of the pathologicalchanges
after stroke, one should be able to observe a potential
with the following characteristics at least for some pa-
tients:
• Location over sensorimotor cortex on the stimu-
lated hemisphere
• High latency at the start of the rehabilitation train-
ing
• Latency reduces over the course of the training
• Latency and other parameters differbetween stim-
uli during the movement and stimuli during the
rest phase.
• Correlation between the prestimulus spectral
power and some parameters of the CCEP
If this is confirmed, it might be worthwhile to at-
tempt a closed-loop stimulation experiment as pro-
posed above to control the evoked component.
ACKNOWLEDGEMENTS
This work was supported by ERC grant 227632.
NEUROTECHNIX2013-InternationalCongressonNeurotechnology,ElectronicsandInformatics
246

REFERENCES
Bergmann, T. O., M¨olle, M., Schmidt, M. A., Lindner, C.,
Marshall, L., Born, J., and Siebner, H. R. (2012).
EEG-Guided Transcranial Magnetic Stimulation Re-
veals Rapid Shifts in Motor Cortical Excitability dur-
ing the Human Sleep Slow Oscillation. Journal of
Neuroscience, 32(1):243–253.
Brugger, D., Butovas, S., Bogdan, M., and Schwarz,
C. (2011). Real-time adaptive microstimulation in-
creases reliability of electrically evoked cortical po-
tentials. IEEE transactions on bio-medical engineer-
ing, 58(5):1483–91.
Casarotto, S., Romero Lauro, L. J., Bellina, V., Casali,
A. G., Rosanova, M., Pigorini, A., Defendi, S., Mari-
otti, M., and Massimini, M. (2010). EEG responses
to TMS are sensitive to changes in the perturba-
tion parameters and repeatable over time. PloS one,
5(4):e10281.
Fadiga, L., Buccino, G., Craighero, L., Fogassi, L., Gallese,
V., and Pavesi, G. (1999). Corticospinal excitability is
specifically modulated by motor imagery: a magnetic
stimulation study. Neuropsychologia, 37(2):147–58.
Ferreri, F., Pasqualetti, P., M¨a¨att¨a, S., Ponzo, D., Fer-
rarelli, F., Tononi, G., Mervaala, E., Miniussi, C., and
Rossini, P. (2011). Human brain connectivity during
single and paired pulse transcranial magnetic stimula-
tion. NeuroImage, 54(1):90–102.
Hummel, F. and Cohen, L. (2006). Non-invasive brain stim-
ulation: a new strategy to improve neurorehabilitation
after stroke? The Lancet Neurology, 5(8):708–712.
Liepert, J., Bauder, H., Miltner, W., Taub, E., and Weiller,
C. (2000). Treatment-induced cortical reorganization
after stroke in humans. Stroke, 31(6):1210–1216.
Lioumis, P., Kici´c, D., Savolainen, P., M¨akel¨a, J. P.,
and K¨ahk¨onen, S. (2009). Reproducibility of TMS-
Evoked EEG responses. Human brain mapping,
30(4):1387–96.
Massimini, M., Ferrarelli, F., Huber, R., Esser, S. K.,
Singh, H., and Tononi, G. (2005). Breakdown of
cortical effective connectivity during sleep. Science,
309(5744):2228–32.
Matsumoto, R., Nair, D. R., LaPresto, E., Najm, I., Binga-
man, W., Shibasaki, H., and L¨uders, H. O. (2004).
Functional connectivity in the human language sys-
tem: a cortico-cortical evoked potential study. Brain,
127(Pt 10):2316–30.
Mitchell, K., Baker, M. R., and Baker, S. N. (2007). Muscle
responses to transcranial stimulation in man depend
on background oscillatory activity. Journal of Physi-
ology, 583(Pt 2):567–579.
Morishima, Y., Akaishi, R., Yamada, Y., Okuda, J., Toma,
K., and Sakai, K. (2009). Task-specific signal trans-
mission from prefrontal cortex in visual selective at-
tention. Nature Neuroscience, 12(1):85–91.
Nikulin, V. V., Kici´c, D., K¨ahk¨onen, S., and Ilmoniemi,
R. J. (2003). Modulation of electroencephalographic
responses to transcranial magnetic stimulation: evi-
dence for changes in cortical excitability related to
movement. The European Journal of Neuroscience,
18(5):1206–12.
Pfurtscheller, G. and Lopes da Silva, F. H. (1999). Event-
related EEG/MEG synchronization and desynchro-
nization: basic principles. Clinical Neurophysiology,
110(11):1842–57.
Plow, E. B., Carey, J. R., Nudo, R. J., and Pascual-Leone,
A. (2009). Invasive cortical stimulation to promote
recovery of function after stroke: a critical appraisal.
Stroke, 40(5):1926–31.
Ramos-Murguialday, A., Broetz, D., Rea, M., L¨aer, L., Yil-
maz, O., Brasil, F. L., Liberati, G., Curado, M. R.,
Garcia-Cossio, E., Vyziotis, A., Cho, W., Agostini,
M., Soares, E., Soekadar, S., Caria, A., Cohen, L. G.,
and Birbaumer, N. (2013). Brain-machine-interface in
chronic stroke rehabilitation: A controlled study. An-
nals of neurology, (Accepted).
Schulz, H., Ubelacker, T., Keil, J., M¨uller, N., and Weisz,
N. (2013). Now I am Ready–Now I am not: The In-
fluence of Pre-TMS Oscillations and Corticomuscu-
lar Coherence on Motor-Evoked Potentials. Cerebral
cortex.
Tsubokawa, T., Katayama, Y., Yamamoto, T., Hirayama, T.,
and Koyama, S. (1991). Chronic motor cortex stim-
ulation for the treatment of central pain. Acta Neu-
rochirurgica Supplement, 52:137–139.
van Elswijk, G., Maij, F., Schoffelen, J.-M., Overeem, S.,
Stegeman, D. F., and Fries, P. (2010). Corticospinal
beta-band synchronization entails rhythmic gain mod-
ulation. Journal of Neuroscience, 30(12):4481–4488.
Walter, A., Bensch, M., Brugger, D., Rosenstiel, W., Bog-
dan, M., Birbaumer, N., and Gharabaghi, A. (2009).
BCCI - a bidirectional cortical communication inter-
face. In Proceedings of the International Joint Confer-
ence on Computational Intelligence, pages 440–445.
Walter, A., Murguialday, A. R., Sp¨uler, M., Naros, G., Le˜ao,
M. T., Gharabaghi, A., Rosenstiel, W., Birbaumer, N.,
and Bogdan, M. (2012). Coupling BCI and corti-
cal stimulation for brain-state-dependent stimulation:
methods for spectral estimation in the presence of
stimulation after-effects. Frontiers in Neural Circuits,
6:87.
Wassermann, E., Epstein, C., and Ziemann, U. (2008). Ox-
ford Handbook of Transcranial Stimulation (Oxford
Handbooks). Oxford University Press, USA.
Woody, C. D. (1967). Characterization of an adaptive filter
for the analysis of variable latency neuroelectric sig-
nals. Medical & Biological Engineering, 5(6):539–
554.
DynamicsofaStimulation-evokedECoGPotentialDuringStrokeRehabilitation-ACaseStudy
247
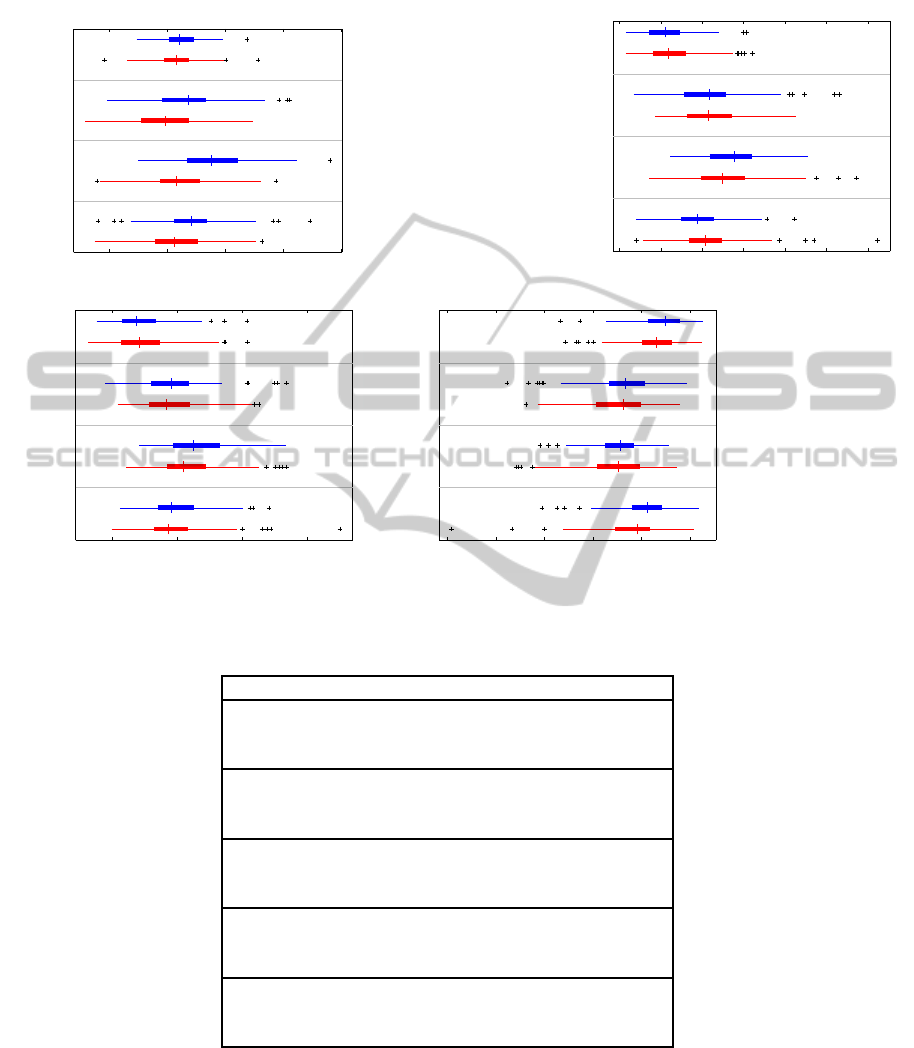
−1000 0 1000 2000 3000
rest
move
rest
move
rest
move
rest
move
Week 4
Week 3
Week 2
Week 1
Area [µV]
Area
2000 4000 6000 8000 10000 12000 14000
rest
move
rest
move
rest
move
rest
move
Week 4
Week 3
Week 2
Week 1
Area [µV]
Absolute area
20 40 60 80
rest
move
rest
move
rest
move
rest
move
Week 4
Week 3
Week 2
Week 1
Amplitude [µV]
Positive peak
−120 −100 −80 −60 −40 −20
rest
move
rest
move
rest
move
rest
move
Week 4
Week 3
Week 2
Week 1
Amplitude [µV]
Negative peak
Figure 4: Single-trial parameters of the evoked component, grouped by condition and session.
Table 3: Results of two-way ANOVAs for the CCEP parameters for factors session (S), condition (C) and the interaction
between these (S*C).
Parameter Factor df F(df,1218) p
Latency
S 3 518.5 < 0.001
C 1 2244.6 < 0.001
S*C 3 41.5 < 0.001
Positive peak
S 3 150.93 < 0.001
C 1 2.16 0.14
S*C 3 2.18 0.09
Negative peak
S 3 127.64 < 0.001
C 1 21.26 < 0.001
S*C 3 1.93 0.12
Area
S 3 21.7 < 0.001
C 1 119.7 < 0.001
S*C 3 11.38 < 0.001
Absolute area
S 3 210.29 < 0.001
C 1 1.40 0.24
S*C 3 3.15 0.024
APPENDIX
NEUROTECHNIX2013-InternationalCongressonNeurotechnology,ElectronicsandInformatics
248
