
Pilot Study for the Evaluation of Thermal Properties and Moisture
Management on Ski Boots
Matteo Moncalero
1,3
, Martino Colonna
1
, Alessandro Pezzoli
2,3
and Marco Nicotra
1
1
DICAM – Alma Mater Studiorum, Università di Bologna, Via Terracini 28, 40131, Bologna, Italy
2
DIATI, Politecnico di Torino, C.so Duca degli Abruzzi 24, 10128, Torino, Italy
3
MeteoSport, Sport Psychology Research Unit, Motor Science Research Centre, School of Motor and Sport Sciences,
University of Turin, P.zza Bernini 12, Torino, Italy
Keywords: Ski Boots, Thermal Comfort, Temperature Sensing, Humidity Sensing, Sport Equipment, Equipment
Design.
Abstract: Winter sports are often performed in severe environmental conditions and this could represent a limit in
terms of comfort and therefore performance. Since alpine skiing has the biggest number of practitioners
among the winter sports and because the feeling of cold in the feet is one of the most common problem, a
testing method has been developed to perform outdoor tests on ski boots in order to evaluate the thermal
comfort for different liner materials. The tests, performed on both male and female skiers wearing the same
shell with different liners simultaneously (one on the left foot and one on the right foot), showed that a
significant difference in terms of comfort using different liners in the same environmental conditions is
present. Specific tests have been made to ensure that such differences between the two feet were not due to
physiological difference between left to right feet; for this reason, data has been recorded using the same
shell and liner for both feet, obtaining negligible differences between the two. Moreover, the collected data
can be used to optimize the target of use of the ski boot and liner, choosing the best materials to achieve
specific behaviour in terms of heating, breathability and moisture management.
1 INTRODUCTION
Footwear thermal insulation is one of the most
important factors for protection against cold. Since
hands and feet have a large surface area compared to
their volume and a small muscle mass, they both
tend to be much more sensitive to cold exposure
compared to other parts of the human body
(Kuklane, 2009). If it is true that the entire body’s
thermal insulation affects the local thermal condition
and that the local insulation has an effect on the total
thermal comfort (Afanasieva, 1972), the feeling of
cold discomfort into the feet will dominate in spite
of proper clothing on the rest of the body (Kuklane,
2009). The feet are comfortable when the skin
temperature is about 33°C and the relative humidity
next to the skin is about 60% (Oakley, 1984);
(Kuklane, 2009). The cold feeling of feet starts at
toe’s temperatures around 25°C, while discomfort
from cold is noted at temperatures under 20-21°C
(Enander et al., 1979); (Goldman and Kampmann,
2007); (Kuklane, 2009). A further decrease of the
foot temperature below 20°C is associated with a
strong perception of cold (Luczak, 1991); (Goldman
and Kampmann, 2007); (Kuklane, 2009).
Moisture is the most important variable that
affects footwear thermal insulation and thus foot
comfort (Kuklane, 2009). Nevertheless, it is
important to note that no specific human receptor
exists for the sensation of humidity (Bertaux et al.,
2010). Footwear should be chosen to keep external
moisture from entering and to allow internal
moisture to leave the footwear (Kuklane, 2009).
The importance of developing new studies on
thermal comfort in sport equipment arises from the
need to investigate which are the interactions
between men, equipment and environment. All men
activities can be strongly influenced by the climate
and sport activities are not exceptions.
It is well known how the garments, in sport
activities with stressful weather conditions, can
affect sport performances (Pezzoli et al., 2010; 2011;
2012). The possibility to study directly on the person
the benefits of a particular garment represents a new
171
Moncalero M., Colonna M., Pezzoli A. and Nicotra M..
Pilot Study for the Evaluation of Thermal Properties and Moisture Management on Ski Boots.
DOI: 10.5220/0004644401710179
In Proceedings of the International Congress on Sports Science Research and Technology Support (EESP-2013), pages 171-179
ISBN: 978-989-8565-79-2
Copyright
c
2013 SCITEPRESS (Science and Technology Publications, Lda.)

frontier in applied research in sport, allowing to
determine whether and how it is possible to improve
the performance in different climatic conditions.
Winter sports are performed in the coldest and
harshest external conditions of all sports and the
effect of the external environment in terms of cold is
therefore more consistent with respect to summer
sports. Alpine skiing has the biggest number of
practitioners among the winter sports. Long
exposure times to cold temperature are often the
norm since the best conditions are present at
temperatures below 0°C.
The best thermal feature that a user can expect
from a ski boot is to keep him warm and dry, to
enjoy a sport day in the outdoors or to perform well
in a race. With the right amount of insulation it is
possible to keep the feet into the range of comfort
and to avoid frostbite; moreover, the heat generated
is better trapped in boots with higher insulation
(Kuklane, 2009). The insulation properties of shoes
and boots are directly proportional to the amount of
air trapped inside the fabric and between the foot
and the shoe, but when this space is filled by
moisture, the insulation loses its effectiveness. The
use of thicker socks could increase the overall
insulation but if the thickness it too high, it could
subtract space to the foot inside the boot, creating
problems to the blood circulation.
Another critical element among the
characteristics of a boot is its ability to expel
moisture from the inside to the outside; this feature
is usually called breathability. A different way to
expel moisture is called “pumping effect” and it
takes place during walking. In ordinary shoes the
pumping effect can remove about 40% of humidity
(Gran, 1957); (Kuklane, 2009). On the contrary, for
ski boots these considerations are not applicable. In
fact, it has been well demonstrated that in cold
conditions (sub-zero temperatures), the evaporation
due to the pumping effect and evaporation in general
are usually less than 5% (Kuklane and Holmér,
1998); (Kuklane et al., 1999; 2000); (Rintamäki and
Hassi, 1989). Moreover, ski boot shells are made of
impermeable plastics such as polyurethane,
polyolefin and polyamide. Impermeable materials do
not allow moisture from the outside to enter and wet
the insulation layers but, at the same time, almost all
the moisture generated during the sport activity
condenses inside the boot. Finally, the physical
activity, especially during sport performance can
affect the amount of moisture and this can strongly
influence foot temperatures. Some of the latest
studies have demonstrated that a foot can sweat
about 30 g/h and in some cases even up to 50 g/h
(Taylor et al., 2006); (Fogarty et al., 2007);
(Kuklane, 2009).
Therefore, the properties of the inner boot (in
terms of insulation and moisture management)
become dramatically important.
For all the reasons reported above it is clear the
need of a method for testing and evaluating the
thermal comfort on ski boots with different liners.
A pilot study was carried out on a reduced
number of testers with the intent to obtain
preliminary qualitative and quantitative data to use
for the construction a complete measurement
protocol. Since the method proposed in this paper
can collect data directly from outdoor conditions
during real skiing activity, it represents an
innovative approach in terms of materials
development, which has been instead previously
based on climatic chamber simulations (Havenith et
al., 2008); (Wang et al., 2012).
2 MATERIALS AND METHODS
Tests have been performed by placing small wireless
sensors (Maxim-Dallas, Hygrochron) to record
temperature and relative humidity inside the liner
and between the liner and the shell (inside the foot-
board placed between the liner and the external
plastic shell).
Figure 1: Sensor shape and size [mm].
The sensor dimensions (Figure 1) allow the
possibility to position them in the place where the
most cold is expected (front part of the boot),
without interfering with the skiing action or causing
pressures to skier’s feet. Proper slots have been
obtained by removing small amounts of material
from the sole and the foot-board. For both positions,
the most sensitive part of the sensor has been
directed towards the foot (sole) and toward the
liner’s sole (foot-board). The slots have been
externally insulated in order to avoid an increased
entrance of cold from the slots.
The relative humidity resolution of the sensor is
0,6% while the temperature resolution is 0,5 °C
icSPORTS2013-InternationalCongressonSportsScienceResearchandTechnologySupport
172
working with a sampling bit-rate of 8-Bit
(recommended for battery saving, especially in cold
environment). The data collection was carried out
through a software designed for the sensors by the
manufacturer, correction for humidity and
temperature is handled automatically using the
software (typical accuracy is ± 0,5 °C and ± 5 % for
relative humidity with software correction). Sensor
sampling rate was set to 30 seconds, since this low
frequency data acquisition has been considered
sufficient to describe the phenomena; the average
values are calculated among the data recorded
during the ski session (lift sessions included), values
are rounded to the first decimal place.
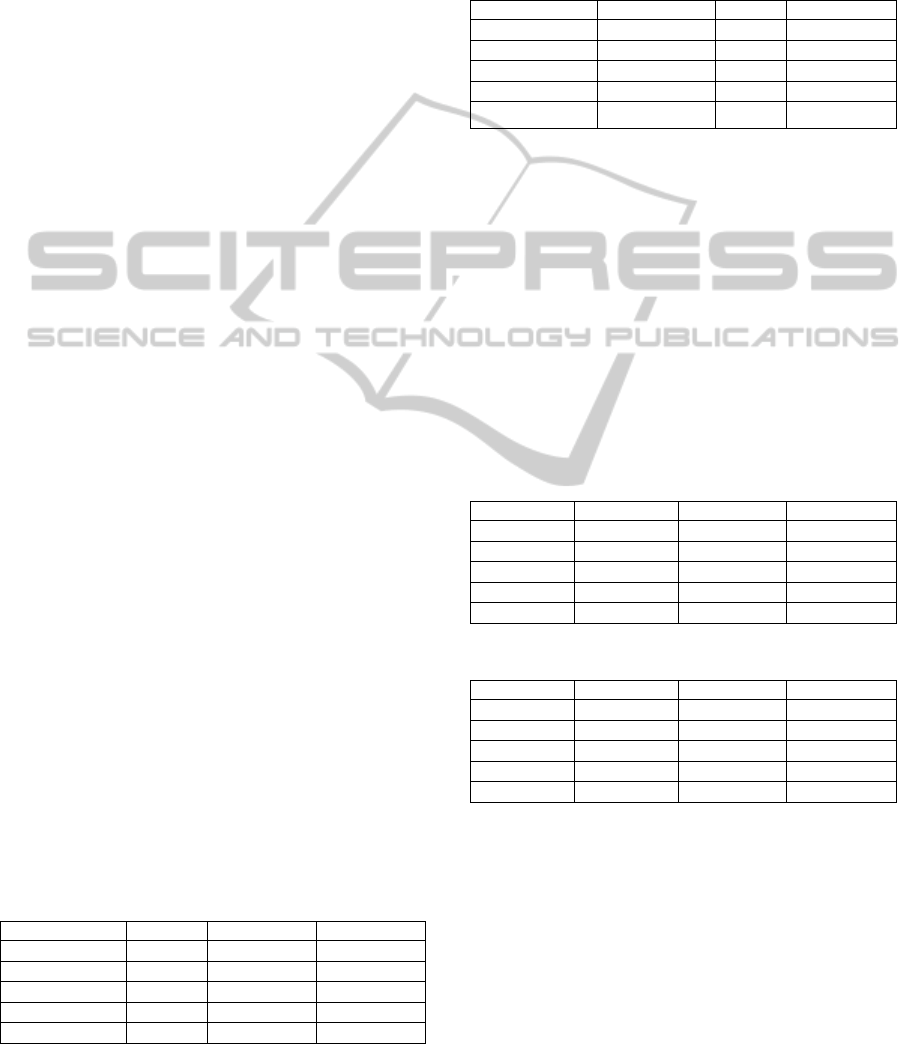
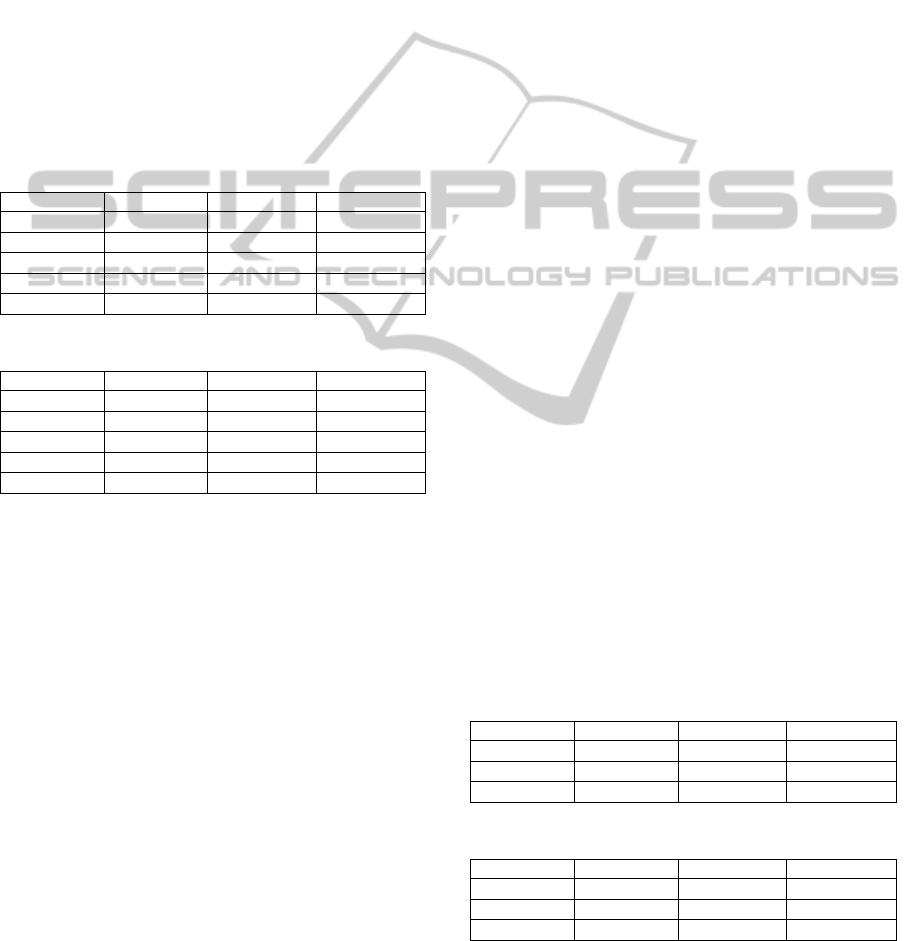
Each boot was equipped with two sensors: one
placed on the liner sole (Figure 2) and one on the
foot-board (Figure 3). All sensors have been placed
in the toe area, considering this as the most critical
part. Indeed, it is reported in the literature that the
temperature in the toes is lower than that in the
whole foot in cold conditions (Kuklane, 2009). On
the contrary, in comfort conditions (above 25°C), is
easy to have similar temperature levels in toes and
the rest of the feet (Kuklane, 2009). Wearing
appropriate footwear to protect from the cold, during
strong cold sensations, the toe’s skin temperature is
about 5°C lower than the mean foot skin temperature
(Kuklane, 2009).
Figure 2: Sensor placed on the liner sole (SOLE).
Figure 3: Sensor placed on the Foot-board (F-B).
A portable weather station (Skywatch, GEOS 11)
has been used in order to validate the results and
measure the environmental conditions during the
test. The weather station was used to measure the
wind speed, air temperature, air relative humidity,
altitude and pressure.
An additional on-board sensor (Maxim-Dallas)
was used to measure air temperature and relative
humidity outside the ski boots for all the duration of
the test. The sensor has been installed outside the
skier’s jacket and, comparing its output with the data
from the weather station, it has been verified that the
body heating did not affected its records.
Each test session has been performed by
comparing simultaneously two types of liners, built
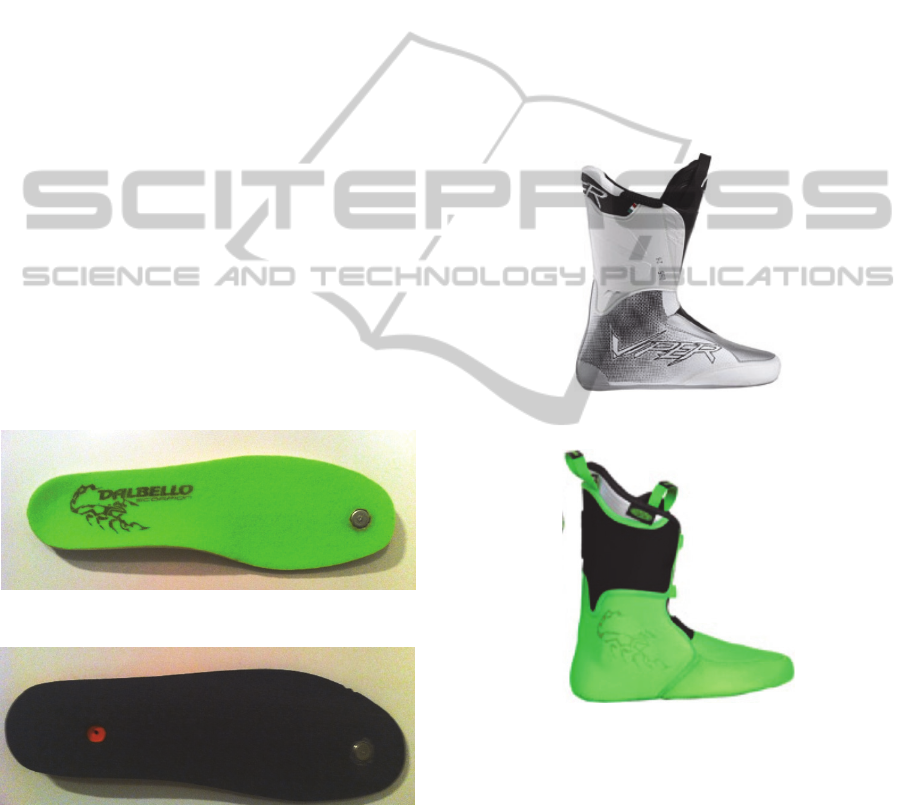
with different materials and technology. One liner
tested is a traditional liner (Figure 4), made of a mix
of preformed ethylene vinyl acetate (EVA) and
others foams with the upper layer made of
polyethylene (PE) or polyvinyl chloride (PVC) and
with the lower sole made of PVC; the other liner
tested is a liner fully made of a mix of different
density closed cell EVA foam (Figure 5).
Figure 4: Traditional liner.
Figure 5: Liner made of closed cell EVA foam.
For women tests four different liners have been
tested:
Traditional with PVC upper layer and PVC
bottom sole.
Traditional with PE upper layer and PVC bottom
sole.
Traditional with PE upper layer and PVC bottom
sole with extra insulation at the tip.
Full EVA closed cell liner.
Tests have been carried out on the slopes, using both
chairlifts (open) and gondolas (closed) simulating a
PilotStudyfortheEvaluationofThermalPropertiesandMoistureManagementonSkiBoots
173
standard ski sessions. Data has been recorded in
continuous from 2 to 4 hours for each session
depending on the weather conditions; mean values in
the following tables have been calculated on an
average time of 2 hours. All testers have been
interviewed on their perceptions and sensations
about the ergonomic and thermal comfort during the
tests and at the end of each session. All test have
been performed in the Italian Alps: male tests took
place in Limone Piemonte (Top: 2085 m; Bottom:
1043 m), female tests took place in Val Gardena
(Top: 2453; Bottom: 1200 m).
Four testers have been used:
TESTER 1 (T1), male, 29 years old, 70 kg,
expert skier, (Session S1 – S2)
TESTER 2 (T2), male, 32 years old, 80 kg,
expert skier (Session S3)
TESTER 3 (T3), male, 29 yeas old, 85 kg,
professional skier (Session S4 – S5)
TESTER 4 (T4), female, 26 years old, 55 kg,
professional skier (Session S6 – S7 – S8 – S9).
All testers have used socks that they routinely use
during their alpine skiing. All socks used are made
of synthetic fibres.
3 RESULTS AND DISCUSSION
3.1 Male Tests
All tests have been performed in winter conditions,
in five different sessions.
In the following tables are reported the results
obtained for temperature and humidity, measured
with the on-board sensor on the skier jacket
(AMBIENT), in the foot-board (F-B) and at the sole
level (SOLE).
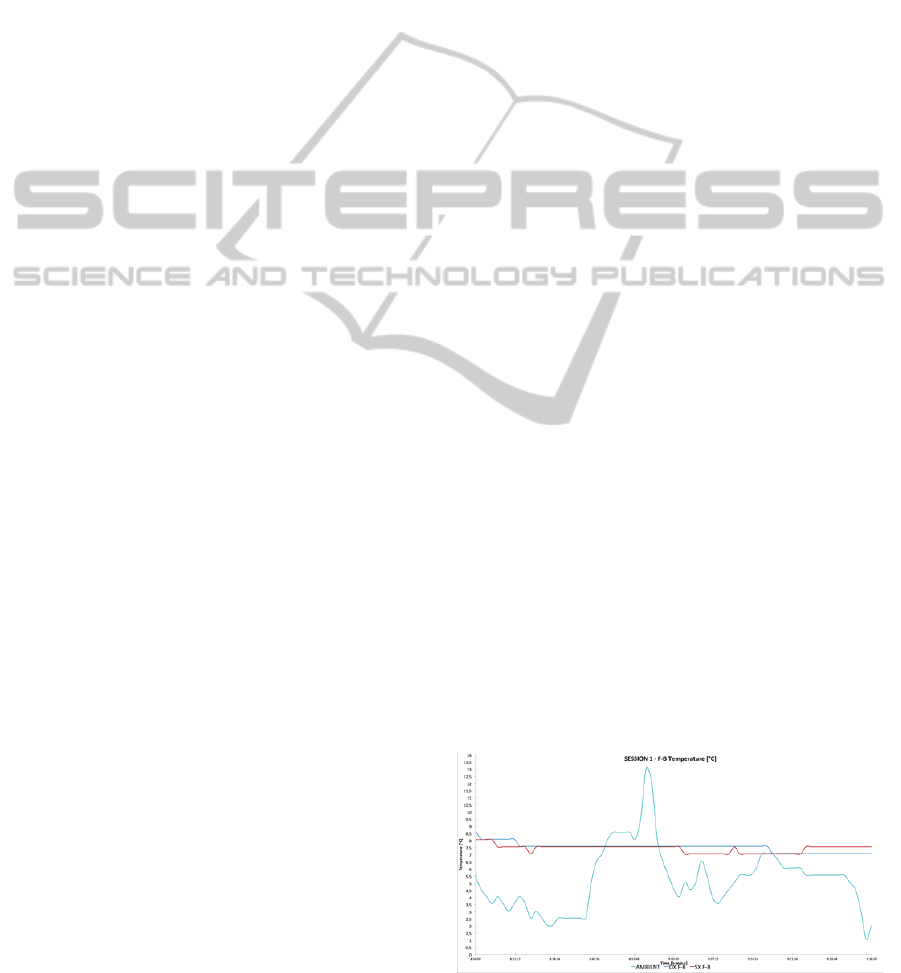
The first test has been performed to measure feet
temperature and relative humidity with the same
boot setup on both feet (Session 1, Tester 1,
traditional liner with PVC upper layer and PVC
bottom sole for each ski boot) in order to assess the
difference between left and right foot and the
reproducibility of the method.
Table 1: Session 1, TEMPERATURE [°C].
MIN MAX AVERAGE
AMBIENT 1,0 13,1 5,2
F‐BPVCsx 7,0 8,0 7,4
F‐BPVCdx 7,1 8,6 7,5
SOLEPVCsx 14,1 15,6 14,5
SOLEPVCdx 13,1 14,1 13,5
The same average foot-board temperature has
been recorded and the sole temperature difference
between the feet was 1 °C (Table 1). The humidity
values recorded on the foot-board were almost
coincident, while only in the sole it is possible to
notice a slight difference (Table 2; 2,2 %).
Table 2: Session 1, RELATIVE HUMIDITY [%].
MIN MAX AVERAGE
AMBIENT 46,6 91,1 64,6
F‐BPVCsx 51,9 56,2 53,9
F‐BPVCdx 52,2 55,7 53,8
SOLEPVCsx 96,0 101,2 99,4
SOLEPVCdx 92,5 100,9 97,2
These results show that, even if there could be a
difference in terms of temperature and relative
humidity between the two feet due to physiological
or mechanical causes (e.g. different buckles
clamping), these differences are negligible compared
to those due to the liner performance, which will be
shown in the following.
Graphs that report the temperature and humidity
measurements from S1 are shown in Appendix.
The results obtained for temperature and
humidity in the second session (S2), which has been
a mild winter day (Table 3) are reported in Table 3
and 4.
Table 3: Session 2, TEMPERATURE [°C].
MIN MAX AVERAGE
AMBIENT ‐3,5 11,1 1,9
F‐BPVC 4,1 14,1 6,4
F‐BEVA 5,1 15,6 9,6
SOLEPVC 10,6 28,2 14,5
SOLEEVA 13,1 29,6 21,2
Table 4: Session 2, RELATIVE HUMIDITY [%].
MIN MAX AVERAGE
AMBIENT 43,9 97,5 67,3
F‐BPVC 50,9 61,9 58,7
F‐BEVA 55,1 62,5 58,4
SOLEPVC 86,5 102,3 97,9
SOLEEVA 81,2 112,7 101,5
The testing session day has been characterised by
an average temperature which stayed above 0 °C
(1,9 °C) with a maximum temperature of 11,1°C
(Table 3). In this case there is a substantial
difference between the temperatures recorded in the
two soles (Table 3). The difference recorded
between the two liners (average, 6,7 °C) is well
above the difference measured in the first session
using the same ski-boot and liner set-up for both feet
(average, 1 °C) and therefore it is possible to state
that there is a clear difference in thermal insulation
icSPORTS2013-InternationalCongressonSportsScienceResearchandTechnologySupport
174
between the two liners in these skiing conditions.
The EVA liner, maintaining the average foot
temperature above the critical temperature of 20 °C,
has been able to offer a greater thermal comfort, in
agreement with what was found at the end of the
session interviewing the tester about his feelings.
Indeed, T1 reported a higher thermal comfort with
the EVA liners and a similar ergonomic comfort
with both liners.
The average values for the relative humidity
inside the liner (Table 4) in both cases have been
close or above the saturation limit.
In Table 5 and 6 are reported the results obtained
for temperature and humidity in the third session
(S3), which has been a much more colder winter day
with respect to S2.
Table 5: Session 3, TEMPERATURE [°C].
MIN MAX AVERAGE
AMBIENT ‐7,5 2,6 ‐4,6
F‐BPVC 3,1 11,6 7,5
F‐BEVA 10,5 14,6 12,4
SOLEPVC 10,1 25,6 17,3
SOLEEVA 23,1 29,6 26,9
Table 6: Session 3, RELATIVE HUMIDITY [%].
MIN MAX AVERAGE
AMBIENT 35,9 65,9 52,5
F‐BPVC 42,3 53,7 50,5
F‐BEVA 42,2 54,9 48,3
SOLEPVC 96,3 106,9 103,2
SOLEEVA 74,3 107,8 96,6
The whole test was conducted with an average
temperature which has been constantly below 0 °C.
As for S2 (Table 3), it is interesting to notice that
inside the liner, next to the toe (sole temperature),
the PVC liner has had an average temperature which
stayed in the discomfort range (Table 5; 17,3 °C),
while the EVA one offered enough comfort (Table
5; 26,9 °C), especially when compared to the
extreme cold conditions recorded.
Also the foot-board in the system equipped with
the EVA liner showed higher temperature values.
However, the temperature difference in the foot-
boards (with the two different liners) is lower if
compared to the difference of the temperature
measured in the sole for the same couple of liners.
For this reason, as expected, the sensor positioned in
the sole can show more significant differences in
terms of insulation behaviour for different liners
with respect to that positioned in the foot-board. The
sensor positioned in the foot-board should give
instead good information on the insulation behaviour
of the shell, if tests with different type of plastic
shells are performed. Indeed, the temperature in the
foot-board was always comprised between the
external temperature and the sole temperature,
indicating that the shell has a real thermal insulation.
Moreover, the thermal fluctuation between the
maximum and the minimum temperature record is
always less intense in the foot-board with respect to
the sole and to the external temperature, again
indicating an insulating behaviour of the shell.
The average relative humidity (Table 6) of the
EVA liner stayed below 100% while the PVC one
passed the saturation limit (103,2 %), indicating that
the foot was wet.
The tester reported a higher thermal comfort with
the EVA system despite a higher ergonomic comfort
with the PVC liner.
The results confirmed the tendency of the EVA
liner to be warmer compared to the PVC one.
Maximum difference between the two, during
session 1 and session 2, can be calculated from
Table 5 (9,6 °C) and from Table 3 (6.7 °C)
indicating that the external conditions have an effect
on the temperature difference between the two liners
and in particular that in very cold environments
(below -10°C) the difference between the liners will
be larger.
In Table 7 and 8 are reported the results obtained
for temperature and humidity in the fourth session,
which is the first of two sessions (S4 - S5) carried
out with tester 3. These tests have been performed in
order to maintain the same tester and to perform two
different skiing activities (free-skiing and slalom
racing).
In tables 7 and 8 are reported the results obtained
for temperature and humidity, measured with the on-
board sensor (AMBIENT) and at the sole level
(SOLE) for the comparison between PVC liner and
full EVA one during a free skiing session with no
gates.
Table 7: Session 4, TEMPERATURE [°C].
MIN MAX AVERAGE
AMBIENT 5,0 10,0 7,6
SOLEPVC 13,5 16,0 14,9
SOLEEVA 14,5 17,1 15,9
Table 8: Session 4, RELATIVE HUMIDITY [%].
MIN MAX AVERAGE
AMBIENT 27,6 48,0 36,7
SOLEPVC 93,5 100,5 97,2
SOLEEVA 91,1 99,6 95,2
In Table 9 and 10 are reported the results
obtained for temperature and humidity in the fifth
PilotStudyfortheEvaluationofThermalPropertiesandMoistureManagementonSkiBoots
175
session, which is the second (S5) carried out with
T3, this time in a slalom racing skiing activity.
Table 9: Session 5, TEMPERATURE [°C].
MIN MAX AVERAGE
AMBIENT 5,6 12,2 8,2
SOLEPVC 20,6 27,6 23,4
SOLEEVA 24,6 28,1 25,8
Table 10: Session 5, RELATIVE HUMIDITY [%].
MIN MAX AVERAGE
AMBIENT 26,5 39,8 33,5
SOLEPVC 99,1 103,8 101,6
SOLEEVA 94,5 99,9 97,6
Both sessions of tests have been carried out in
similar conditions of temperature (Table 7 and Table
9) and humidity (Table 8 and Table 10). In both
cases the EVA liner has recorded higher sole
temperature values compared to the PVC one; but
during S4 both average temperatures (PVC and
EVA) have been very low (Table 7) while in session
5 they have been both closer to the comfort area
(Table 9).
This difference can be ascribed to the different
physical effort made by T3 between the two
sessions. Indeed, S4 has been a free skiing session
while S5 has been characterized by a racing ski
slalom session using gates that requires more effort
with respect to a free skiing activity.
The higher physical effort in S5 is also
responsible of the higher humidity values (Table 10)
compared to S4 (Table 8). Therefore, it is clear the
effect of the type of skiing performed and for this
reason it is not possible to make comparison
between different sessions unless a controlled skiing
is performed (same terrain, same length of the run,
same skiing approach and speed). Nevertheless, the
use of two different skiing styles does not affect the
relative behaviour of the two liners: in both sessions
(S4 and S5) a similar trend was observed since in
both cases the full EVA liner was warmer compared
to the PVC liner (average difference 1°C in session 4
and 2,4 °C in session 5).
3.2 Female Tests
All four sessions have been performed in winter,
using four types of liners. Similarly to what has been
done for men tests, for each session, the trend of
environmental parameters for the entire duration of
the test has been recorded and analysed. The
following results have been recorded testing ski
boots with a professional skier, female, 26 years old
(T4).
In the following tables are reported the results
obtained for temperature and humidity, measured
with the on-board temperature (AMBIENT), and at
sole level (SOLE).
Table 11, Table 12 (
PE vs. PE + tip extra insulation)
Table 13, Table 14 (
PVC vs. PE + tip extra
insulation
)
Table 15, Table 16 (
PVC vs. full EVA)
Table 17, Table 18 (
PE vs. full EVA)
Table 11: Session 6 - PE vs. PE + tip insulation
TEMPERATURE [°C].
MIN MAX AVERAGE
AMBIENT ‐5,5 12,6 1,7
SOLEPE 17,6 28,1 20,7
SOLEPE+
tipextra
insulation
17,6 28,6 21,8
Table 12: Session 6 - PE vs. PE + tip insulation
RELATIVE HUMIDITY [%].
MIN MAX AVERAGE
AMBIENT 35,2 86,3 66,4
SOLEPE 94,1 113,3 103,5
SOLEPE +
tipextra
insulation
75,6 102,4 99,3
The average temperatures of the sole (Table 11)
show that, under the conditions in which S6 took
place, the extra insulation on the toe of the shoe
ensures a slightly improved thermal comfort.
Furthermore, the different type of material used for
the tip insulation seems to give the footwear a higher
breathability, due to the lower relative humidity,
especially with reference to the minimum and
maximum values (Table 12).
Table 13: Session 7 - PVC vs. PE + tip insulation
TEMPERATURE [°C].
MIN MAX AVERAGE
AMBIENT ‐4,0 ‐0,4‐2,7
SOLEPVC 13,6 17,6 15,3
SOLEPE +
tipextra
insulation
11,6 16,1 13,4
Table 14: Session 7 - PVC vs. PE + tip insulation
RELATIVE HUMIDITY [%].
MIN MAX AVERAGE
AMBIENT 77,8 103,7 95,8
SOLEPVC 100,1 102,9 101,2
SOLEPE +
tipextra
insulation
95,6 103,1 100,1
icSPORTS2013-InternationalCongressonSportsScienceResearchandTechnologySupport
176

A rather cold climate and short snow showers have
characterized this second test made by T4 (session
7). In these conditions the PVC liner was warmer
compared to the PE with extra insulation liner but
none of the two shoes tested has allowed the athlete
to maintain the temperature of the feet within the
comfort levels (Table 13; both < 20 °C). The relative
humidity was very high in both cases (Table 14).
Table 15: Session 8 - PVC vs. full EVA [°C].
MIN MAX AVERAGE
AMBIENT 0,5 11,5 4,7
SOLEPVC 17,6 29,6 22,9
SOLEEVA 17,6 30,6 22,5
Table 16: Session 8 - PVC vs. full EVA RELATIVE
HUMIDITY [%].
MIN MAX AVERAGE
AMBIENT 53,2 91,32 74,0
SOLEPVC 84,6 110,8 103,2
SOLEEVA 92,5 106,8 101,5
S8 has been carried out in a winter sunny day
with high average temperature (4,7 °C; Table 15);
moreover, the aspect of the slopes and the solar
radiation should have emphasized the feeling of
comfort. In fact, both liners behaved in a similar
manner, ensuring enough thermal comfort at the tip
of the foot (Table 15).
Table 17: Session 9 - PE vs. full EVA [°C].
MIN MAX AVERAGE
AMBIENT ‐2,5 9,6 1,2
SOLEPE 18,6 26,6 22,8
SOLEEVA 21,1 24,6 22,7
Table 18: Session 9 - PE vs. full EVA RELATIVE
HUMIDITY [%].
MIN MAX AVERAGE
AMBIENT 64,1 104,7 94,5
SOLEPE 95,5 104,7 101,0
SOLEEVA 88,5 100,5 95,7
S9 was performed with an average temperature
slightly above 0 °C (Table 17; 1,2 °C) and a really
high air humidity due to some snow showers (94,5
%). The analysis of the extreme values in table 17
shows that, despite a difference of 2,0 °C for the
maximum values (26,6 °C and 24,6 °C), the EVA
liner did not crossed the border between the comfort
and the feeling of cold; indeed, the minimum
temperature recorded in the PE liner is 2,5 °C lower
compared to the one in the EVA liner (18,6 °C and
21,1 °C; Table 17). For each liner comparison, the
tester’s sensation of comfort was in agreement with
the data collected by the sensors.
4 CONCLUSIONS
Using this innovative method, it has been possible to
measure the performance of the footwear in the real
conditions of use, providing detailed information on
the thermal comfort for different materials used.
From the perspective of interaction with the
human body, taking into account the environmental
conditions in which the tests were performed (being
those that generally characterize alpine skiing), the
EVA liner seems to have superior thermal
characteristics for both male and female testers.
As for the temperature, very high differences
were found between the different types of liner
(Table 5) and significant differences were revealed
with the selective use of insulating material in the
area of the tip of the foot (Table 11). These
differences, even if of the order of a few degrees,
can be decisive for the achievement of a sufficient
thermal comfort, for a safe sport practice and for the
attainment of high performance.
Though with minor differences, the behaviour of
the ski boots in moisture management is in line with
what expect from a shell completely impermeable to
air and water. The ability of the ski boot system to
manage the water vapour and its condensation inside
the boot represents an important research field for
further investigation in the immediate future.
The climate data collected by the weather
stations (fixed and portable) and from the additional
on-board sensors have been essential to correlate the
environmental parameters to the behaviour of
different materials used. In fact, the difference in
terms of average temperature inside the shoe
between EVA liners and traditional ones increases as
the ambient temperature decreases (Table 3, Table
5).
While the on-board sensors showed fluctuations
synchronous with the typical phases of stop/motion
due to the alternation between lift and skiing
sessions, the ski boot system seems to be not
affected by these alternations, showing no
fluctuation in phase with those mentioned above; for
this reason it can be argued that, under the
conditions in which the tests were conducted, lifts
sessions do not represent a particularly critical issue
in achieving thermal comfort, though it must be
taken into account that they represent quasi-static
sessions.
The data collected also show that higher
temperatures have been recorded for men testers
PilotStudyfortheEvaluationofThermalPropertiesandMoistureManagementonSkiBoots
177
with respect to those for women; this denotes a
greater difficulty in ensuring a good level of thermal
comfort for the female gender. For both male and
female, further research can be carried out on
subjects with different tolerance to cold.
The application of this method to a larger
number of testers in a more standardised manner
(i.e. using the same skiing exercise pattern, the same
duration of each session and the same socks),
coupled with a statistical analysis, can assure great
improvements in products optimization, for a better
sport experience and a higher performance.
ACKNOWLEDGEMENTS
The authors would like to thank Calzaturificio Dal
Bello S.r.l. (Casella d'Asolo – TV – Italy) for the
support and funding of the research project.
REFERENCES
Afanasieva R. F. (1972) Hygienic basis for designing cold
protective clothing (Doctoral thesis), Moscow.
Bertaux E., Derler S., Zeng X., Koehl L., Ventenat V.
(2010) Textile, Physiological, and Sensorial
Parameters in Sock Comfort. Textile Research Journal
Vol 80(17): 1803–1810 DOI: 10.1177/004051
7510369409.
Enander A., Ljungberg A-S., Holmér I., (1979) Effects of
work in cold stores on man. Scand J Work Environ
Health 5, 195–204. Ergonomics 34, 687–720.
Fogarty A. L., Barlett R., Ventenar V., Havenith G.,
(2007). Regional foot sweat rates during a 65-minute
uphill walk with a backpack. The 12th International
Conference on Environmental Ergonomics, Mekjavic
I. B., Kounalakis S. N., Taylor N. A. S., (Eds.), 283–4,
Biomed d.o.o., Ljubljana, Piran.
Gran G (1957) Investigations on shoe climate and foot
comfort. J Soc Leather Techn & Chem 43, 182–97.
Goldman R., Kampmann B., (2007) Handbook on
clothing. Biomedical Effects of Military Clothing and
Equipment Systems. 2
nd
Edition.
Havenith G., Richards M. G., Wang X., Brode P., Candas
V., den Hartog E., Holmer I., Kuklane K., Meinander
H., Nocker W., (2008) Apparent latent heat of
evaporation from clothing: attenuation and “heat pipe”
effects. J Appl Physiol 104(1): 142-149.
Kuklane K., Holmér I., (1998) Effect of sweating on insu-
lation of footwear. Int J Occup Saf Ergon 4, 123–36.
Kuklane K., Holmér I., Giesbrecht G., (1999) Change of
footwear insulation at various sweating rates. Appl
Human Sci 18, 161–8.
Kuklane K., Holmér I., Giesbrecht G., (2000) One week
sweating simulation test with a thermal foot model. In:
The Third International Meeting on Thermal Manikin
Testing, Nilsson H and Holmér I (Eds.), 106–13,
National Institute for Working Life, Stockholm.
Kuklane K., (2009) Protection of Feet in Cold Exposure.
Luczak H., (1991). Work under extreme conditions.
Oakley E. H. N., (1984) The design and function of mili-
tary footwear: a review following experiences in the
South Atlantic. Ergonomics 27, 631–7.
Pezzoli A., Baldacci A., Cama A., Faina M., Dalla Vedova
D., Besi M., Vercelli G., Boscolo A., Moncalero M.,
Cristofori E., Dalessandro M., (in press) Wind-wave
interactions in enclosed basins: the impact on the sport
of rowing. In: Physics of Sport. Ed. Ecole
Polytechnique de Paris. Paris.
Pezzoli A., Cristofori E., Gozzini B., Marchisio M.,
Padoan J., (2012) Analysis of the thermal comfort in
cycling athletes. Procedia Engineering, 34:433-438.
Pezzoli A., Moncalero M, Boscolo A, Cristofori E,
Giacometto F, Gastaldi S, Vercelli G (2010) The
meteo-hydrological analysis and the sport
performance: which are the connections? The case of
the XXI Winter Olympic Games, Vancouver 2010.
Journal of Sports Medicine and Physical Fitness,
50:19-20.
Rintamaaki H., Hassi J., (1989) Thermal physiology and
cold protection of feet with two types of rubber boots.
Arctic Rubber, Scandinavian Rubber Conference,
Tampere.
Taylor N. A. S., Galdwell J. N., Mekjvic I. B., (2006).The
sweating foot: local differences in sweat secretion
during exercise-induced hyperthermia. A viat Space
Environ Med 77, 1020–7.
The Thermal Environment Laboratory, Division of
Ergonomics and Aerosol Technology, Department of
Design Sciences, Faculty of Engineering, Lund
University, Box 118, SE-221 00 Lund, Sweden.
Wang F., del Ferraro S., Lin L. Y., Sotto Mayor T.,
Molinaro V., Ribeiro M., Gao C., Kuklane K., Holmer
I., (2012). Localised boundary air layer and clothing
evaporative resistances for individual body segments.
Ergonomics 55(7):799-812. doi: 10.1080/00140139.
2012.668948.
APPENDIX
Graph 1: Session 1, F-B TEMPERATURE [°C].
icSPORTS2013-InternationalCongressonSportsScienceResearchandTechnologySupport
178
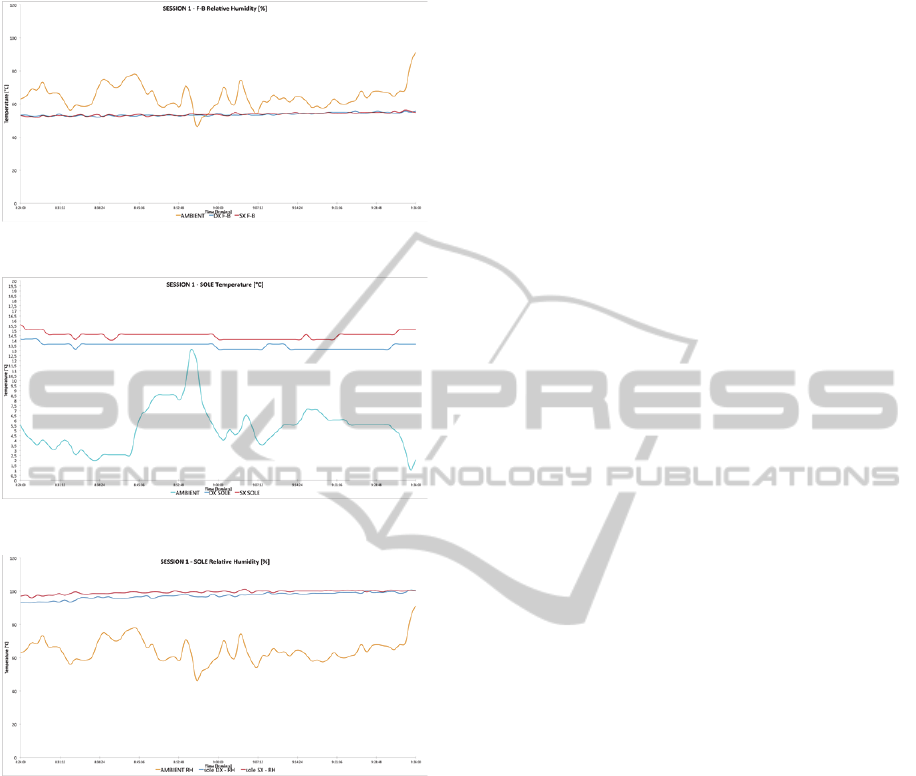
Graph 2: Session 1, F-B RELATIVE HUMIDITY [%].
Graph 3: Session 1, SOLE TEMPERATURE [°C].
Graph 4: Session 1, SOLE RELATIVE HUMIDITY [%].
PilotStudyfortheEvaluationofThermalPropertiesandMoistureManagementonSkiBoots
179
