
Demo-based Cost Model
Marco Arede, Carlos Mendes and Miguel Mira da Silva
Instituto Superior Técnico, Technical University of Lisbon, Avenida Rovisco Pais, Lisboa, Portugal
Keywords: Enterprise Ontology (EO), Design Engineering Methodology for Organizations (DEMO), Enterprise
Complexity, Cost Model, Implementation Costs.
Abstract: The complexity of organizations has become difficult to manage and organizations have lost the traceability
between their essential transactions and the respective implementation costs. Most organizations do not
have a coherent, comprehensive and consistent vision of the costs directly or indirectly related to the
organization essential operations. This essential operations are based on networks of subjects that interact in
order to coordinate and perform work, contributing for global performance. The lack of understanding of
where costs occur leads to difficulties when taking decisions, limiting what can be achieved in a planned
way, reason for the need of a properly cost analyses. A solution could contribute to a better understanding of
where costs occur, providing managers with more information to support their decisions, so they can
improve organizations in order to be more profitable. In our research we propose a DEMO-based Cost
Model to address this problem, which intends to reduce the complexity of analysing costs, mapping the
implementation costs with the essence of organizations. Our proposal allows analysing costs from different
perspectives, by act, actor role, transaction and business process. The demonstration was applied to Invoice
Management of a research and development unit. This research was conducted using DSRM.
1 INTRODUCTION
Over time organizations become increasingly
complex and managing that complexity is a growing
challenge. Organizations complexity has been
described as the organized complexity: too
organized for statistics and too complex for analysis
(Weinberg, 2001). Since costs in organizations have
become too complex for analysis, organized
complexity also applies to costs (Wileman, 2008).
Complexity seems to be a common background
of enterprise problems (Association of Chartered
Certified Accountants & Institute of Management
n.d.). In a complex system, elements can interact
with others, moving into more elaborated structures
and increasing the number of the transactions. As a
consequence organizations also incur in more costs
that are hard to identify (Ray, 2013).
Costs are associated to the enterprise operations
and its processes. Costs are not only inherent of
enterprise operation but also of complexity, mergers,
search for growth, acquisitions, or other factors. One
of the top challenges nowadays, as revealed by
several surveys, is to identify cost reductions
(Association of Chartered Certified Accountants &
Institute of Management n.d.). However the
complexity of organizations has become
unmanageable (Schapper et al., 2005) and
organizations have lost the traceability between the
organization essence and the respective
implementation costs, meaning that most
organizations do not have a coherent, comprehensive
and consistent vision of the costs related to the
essential operations (Dietz, 2006). Organization
operations are performed by networks of subjects
that contribute to global performance, interacting
with others to coordinate and perform work (Cross
and Parker, 2004). A solution to approach this
problem should reduce the analysis complexity,
focus on the system and ignore the subsystems, to
separate enterprise essence from the implementation.
Our research focused on DEMO to overcome the
complexity of modelling organizations, allowing us
to separate the way organization are implemented
from its ontological essence, reducing the analysis
complexity. We also used Time-Driven Activity
Based Costing (TDABC) to allow reflecting the
complexity and variability of business processes
with time equations. TDABC is more simpler, less
costly and faster to implement than Activity Based
431
Arede M., Mendes C. and Mira da Silva M..
Demo-based Cost Model.
DOI: 10.5220/0004656204310441
In Proceedings of the International Conference on Knowledge Engineering and Ontology Development (SSEO-2013), pages 431-441
ISBN: 978-989-8565-81-5
Copyright
c
2013 SCITEPRESS (Science and Technology Publications, Lda.)

Costing (ABC) which adds more complexity, needs
large data estimates calculations, and not considers
the subjective time consumption of resources.
Therefore we propose a method based on DEMO
Methodology (Dietz, 2006) and on TDABC theory
(Kaplan and Anderson, 2007). This research was
conducted using the Design Science Research
Methodology, a framework commonly accepted to
produce of Design Science Research in Information
Systems.
The main contribution to solve the identified
problem is the understanding of where costs occur
relating the essential operations to their
implementation costs, and areas of responsibility.
This would provide information for managers to
support their managing decisions, making
organizations more profitable (Pesonen, 2001).
The remaining paper is structured as follows, in
Section 2 we present the related work. In Section 3
we explain our proposal. A demonstration of the
proposed artifact is shown in Section 4. In section 5
a conclusion, the achievements and the future work
are presented. In appendix we present the auxiliary
calculations tables (Appendix B).
2 RELATED WORK
In this section we detail the work that has been done
in this domain of investigation. We will describe
Enterprise Ontology and TDABC in Sections 2.1
and 2.2.
2.1 Enterprise Ontology
Enterprise Ontology (EO) is a comprehensive theory
that supports DEMO methodology and allows
overcoming organizations complexity.
This last is composed by methods and techniques
based on EO theory, so that organizations
conceptual model can be constructed showing only
the essence of the operations in way that is coherent,
comprehensive, consistent and concise (Dietz 2006).
EO is defined as the structure behind the
observable surface, the realization and
implementation independent essence of an
organization.
Competing methodologies do not guarantee to
produce implementation independent models, and in
addition the aspect models are not totally linked to
each other.
2.1.1 Theory
The PSI-Theory is the theory that supports the
notion of Enterprise Ontology. It is based on four
axioms (operation, transaction, composition,
distinction) and one theorem (organization theorem).
Operation axiom explains that operations are a
set of actor roles activities, either roles of authority
or responsibility, fulfilled by subjects, which
perform production acts or coordination acts. Their
results are production facts - goods and/or services -
and coordination facts - commitments with others.
2.1.2 Methodology
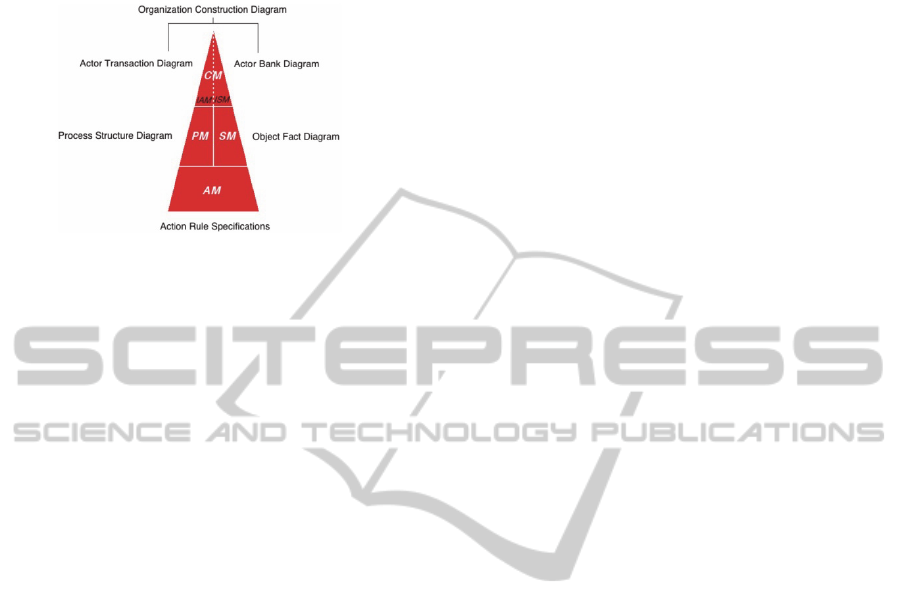
DEMO methodology consists of four aspect models
with particular diagrams, lists and tables:
The Construction Model (CM) specifies the
identified transaction types and the associated actor
roles, as well the information links between actor
roles and the information bank. The composition,
structure and environment of organizations can be
specified by the CM using two models: 1) The
Interaction Model (IAM) that shows active
influences between actor roles, i.e. the execution of
transactions; 2) The Interstriction Model (ISM)
showing the passive influences between actor roles;
The Process Model (PM) contains the specific
transaction pattern of the transaction type, also the
causal and conditional relationships between
transactions. Those relationships determine the
transaction patterns and the possible trajectories in
the Coordination-world (transition space and state
space);
The Action Model (AM) specifies action rules as
guidelines for actors deal with their agenda. Action
rules guide how the performing actor role should
respond to the reached status;
The State Model (SM) identifies the state space
of P-world: object classes and fact types, the result
types, and ontological coexistence rules. SM is ideal
to start developing and maintaining the data
dictionary of an organization, facilitating the
identification of business components (software
components), based on the fact types around
categories.
These models are illustrated in Figure 1 and
constitute the complete ontological model of the
organization. To produce the aspect models we use
the logical sequence anticlockwise, starting with
interaction model (IAM).
As business architectures approaches areas such
as management science, business administration,
logistics and informatics, they are unable to provide
integrated understandings of actors, communication,
KEOD2013-InternationalConferenceonKnowledgeEngineeringandOntologyDevelopment
432
production and their realizing technologies (Mulder
and Dietz n.d.).
Figure 1: DEMO ontological aspects models and diagrams
(Dietz, 2006).
Regarding this concerns, Enterprise Ontology
offers a new kind of understanding, brought by the
approach of Design & Engineering Methodology for
Organizations.
2.2 Tdabc
Time-driven activity-based costing is an alternative
approach to ABC model estimation, addressing its
limitations being: simpler, faster to implement, and
less costly.
TDABC allows overcoming transaction
complexity, by using time equations and time
consumption of process in the departments, basing
the cost driver rates on the practical capacity of
supplied resources (Kaplan & Anderson 2007).
This new approach considers the number of
times that an activity is performed (number of
production runs, setups, number of shipments,
purchase orders, and number of customer orders)
and resources effort that is required to perform
activities (setups that might be more complex or
difficult to do than others, time and effort spent).
In ABC, transactions heterogeneity is handled in
two ways: 1) Expanding the number of activities
(simple orders, average orders, and complex orders).
2) Using duration drivers to estimate the required
time to perform the task (example are the material
handling time, setup hours, direct labour hours and
machine hours).
The simplicity of Time Driven Activity-Based
Costing is essentially to measure and manage the
capacity of organization, requiring only two
estimates: 1) The unit cost of supplying capacity,
and 2) The consumption of capacity (unit times) by
the activities the organization performs for products,
services, and customers.
2.2.1 Estimating Unit Cost
For estimating the cost of supplying capacity,
various groups of resources that perform activities
must be identified (activities performed in
administration, front-line employees, their
supervisors and the support resources).
There are two possible ways of measuring
practical capacity. One is to estimate practical
capacity as a percentage of theoretical capacity,
including personnel time for breaks, arrival and
departure, communication and reading unrelated to
work, machine time for downtime due to
maintenance, repair, and scheduling fluctuations.
The other way is to measure practical capacity,
obtaining historical time of activities and taking in
consideration fluctuations that can occur in certain
periods (due to excessive delays, poor quality,
overtime, or stressed employees). This number is
then used as the estimate for capacity of resources
that perform that activity.
After estimating the 1) cost of supplied capacity
of each resource and 2) the practical capacity, the
analyst can calculate the unit cost using Eq. 1:
Unit Cost = (Cost of capacity Supplied) /
(Pratical Capacity supplied)
(1)
The numerator includes direct or indirect expenses
attributed to the unit and the denominator is the
available capacity time.
2.2.2 Estimating Unit Time
TDABC requires an estimation of the time an
activity takes to be performed. The procedure uses
an estimate of time, replacing the ABC process of
interviewing people. The time estimates can be
obtained either by direct observation or by
interviews, rough accuracy is sufficient.
An analysis to the results obtained by the model
can reveal the costs of both resource capacity used
and resource capacity unused. Rather than reducing
unused capacity in the present, managers can choose
to reserve that capacity to grow in the future.
Managers can forecast how much the business
can handle with the existing capacity and if capacity
shortages might happen.
2.2.3 Time Equations
Business processes activities have different
durations, being similar to requests, complains, or
performing other transactional activity. Companies
most of the times can predict the drivers that turn
transactions into simpler or more complex ones
Demo-basedCostModel
433
(Kaplan and Anderson, 2007).
For example, to dispatch a letter in the post
office the operation may take 2 minutes, but if the
item requires a special delivery then an additional 4
minutes might be required, also if the item has more
weight another 2 minutes is required to weigh in the
balance.
Instead of defining separate activities to each
procedure, the time-driven approach uses a simple
equation, Eq. 2:
Dispatch Time =
= 2 + 4 (if special delivery required)
+ 2 (if additional weight)
(2)
TDABC approach is a powerful framework and is
useful to apply in our proposal because: 1) it is more
accurate and can operate with fewer equations than
the number of activities in traditional ABC systems,
allowing a variety and complexity in products,
orders, and customers; 2) it gives information about
the unit cost and unit times, as consequence the
knowledge about possible improvements in
efficiency (Kaplan and Anderson, 2007).
With TDABC a time equation model can be
obtained, reflecting any business processes
complexity and variability. The complexity in
processes can be surpassed by modelling
departments as one process, in one time equation.
Time equations can also be expanded to add
more terms including variations of different types of
transactions, reflecting the actual activities during
each period (Kaplan and Anderson, 2007).
In our proposal time-equations can allow us to
calculate the costs of activities, based not only on
the used resources but also on the time consumed.
3 PROPOSAL
This section corresponds to objectives definition for
solution, design and development steps of DSRM.
3.1 Objectives of the Solution
The objectives for a solution have two major
concerns: first the need to obtain an artefact that
allows modelling an organization in a
comprehensive, consistent and concise way; second
the artefact should allow identifying and relating the
implementation costs with organization's essential
operations.
3.2 Proposed Method
We propose an artefact that uses contributions from
both TDABC and DEMO methodology. We choose
to use DEMO since it was conceived to overcome
complexity.
This methodology allow us to separate the way
organization is implemented from its ontological
essence, reducing the analysis complexity and allow
to be more focus on the system of interest (Dietz,
2006).
Organizations consist of people, interacting in
order to coordinate and perform work. The duration
of their activities should also be included when
modelling organization costs. To consider this aspect
we propose to use TDABC time equations, adapting
them to reflect not only the duration of essential
activities but also their dependencies.
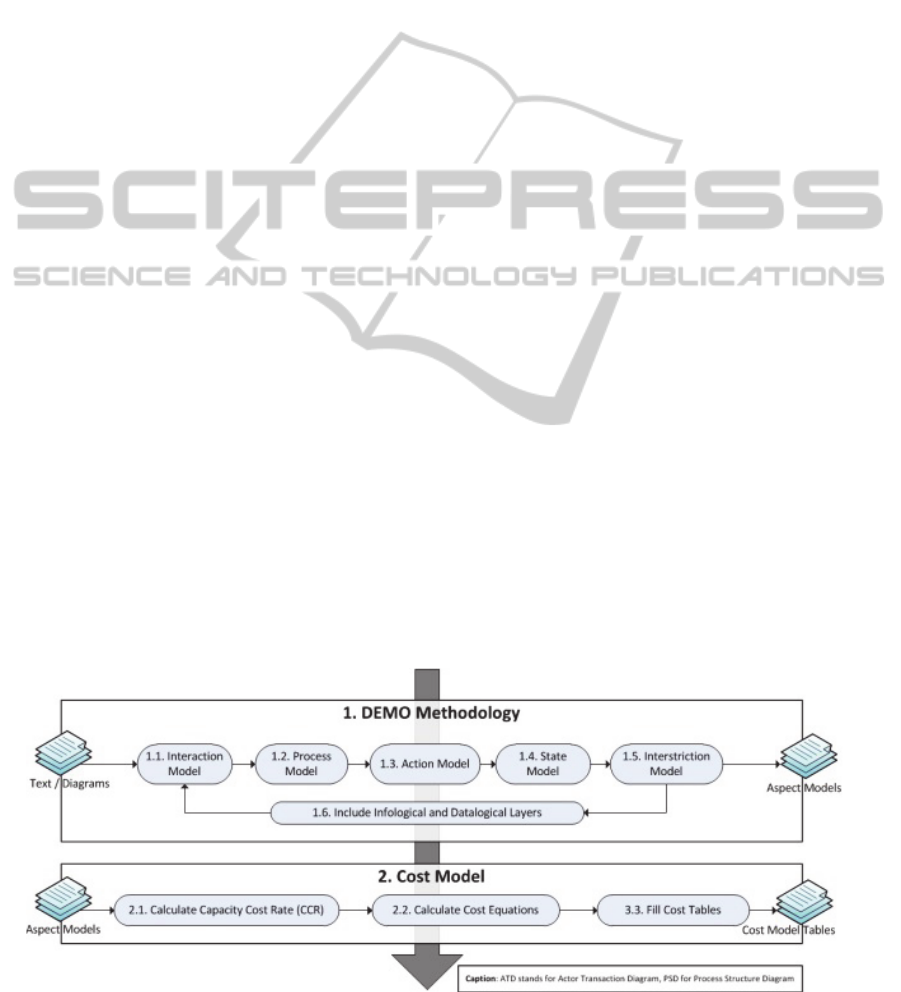
In Fig. 1 we introduce the proposed method with
a diagram, showing two phases each with several
steps. The first phase consists on DEMO
Methodology and the second phase is based on
TDABC theory.
Figure 1: Steps of the proposed method.
KEOD2013-InternationalConferenceonKnowledgeEngineeringandOntologyDevelopment
434

3.2.1 Demo Methodology
The first phase is based on DEMO Methodology and
is composed of six steps as shown in Fig. 1. Each
step consists on modelling the aspect models (Dietz,
2006), we propose to consider not only the
ontological transactions but also the infological and
datalogical transactions, identifying them with the
respective colours (accordingly to the distinction
axiom) and a letter "I" and "D" before the
designation of infological and datalogical
transactions respectively.
With the Process Structure Diagram (PSD), the
Actor Transaction Diagram and Result Structure
Chart, in particular, we can understand which
dependencies exist between acts and continue to the
second phase.
3.2.2 Cost Model
The second phase is based on TDABC theory
(Kaplan and Anderson, 2007). Having as output the
diagrams of first phase we can proceed to the steps
of Cost Model.
Capacity Cost Rate. The first step of this phase is
to calculate Capacity Cost Rate (CCR) for each
Actor Role using Eq. 3. The variable (x) belongs to
Actor domain and (y) belongs to Actor Role
domain.
CCR (x,y) = (Expenses Attributable to (x)
who fulfill (y)) / (Available Capacity of (x)
who fulfills (y))
(3)
The Eq. 3 gives actor role cost for unit of time, the
numerator includes expenses related to the time
period in consideration.
Some examples of Portuguese organization
expenses that can be divided in two categories are
personnel expenses (salary, social security, holiday’s
subsidy, Christmas subsidy, sickness subsidy, meal
subsidy, taxes) and operation expenses (space rent,
electricity, water, equipment, services, training, and
taxes). The denominator is calculated as the
available capacity of resource.
We start with the number of days in one year,
then we subtract non-working days (to get the
number of working days in a month) and finally we
multiply this last value with the available hours per
day of work. Available hours per day of work are
obtained by subtracting to daily work hours the non-
work times. Some examples of non-work days/times
are holidays, breaks, vacations, expected
personal/sick leave, and training.
Cost Equations. The second step of Cost Model
phase is to calculate cost equations, starting by act
cost equation, Eq. 4.
Act_cost = CCR_ActorRole
+ estimated_time + number_ocurrences +
specific_cost + dependencies_cost
(4)
Eq. 4 is calculated having as basis several
parameters:
CCR_ActorRole is the capacity cost rate
calculated previously;
estimated_time the average estimation time of
act;
number_ocurrences as the number of times act
was performed;
specific_cost are the act costs not included in
CCR (x,y) numerator expenses. Taking an
example of a pharmacy, when a medicine is
dispensed, the specific costs is the medicine cost;
dependencies_cost are costs of other acts costs
that must be performed before, dependencies can
be captured following the conditional lines in
PSD diagram.
After calculating Acts Cost we calculate transaction
cost using Eq. 5. Transaction_cost which is the sum
of both Executor_(cost) and Initiator_Cost.
Table 1: Table model to represent Transaction Costs.
Transaction
rq dc qt pm ex st rj sp ac Txsum
Initiator
€a €b €c €d €e €f €g €h €i €j
Executor
€k €l €m €n €o €p €q €r €s €t
Table 2: Table model to represent Business Process Costs.
A01 A02 (…) A0M Sum
T1 €c11 €c12 € (…) €c1M €c1
T2 €c21 €c22 € (…) €c2M €c2
(…) € (…) € (…) € (…) € (…) € (…)
TN €cN1 €cN2 € (…) €cNM €cN
Sum €c01 €c02 € (…) €c0M
€BP
We consider participations from Initiator acts
times in some Executor acts time, meaning that in
some business processes we might want to assume
that initiator and executor have both the same act
time duration.
For example in a Pharmacy when a client makes
a request that is being heard by the pharmacist, the
duration of the request will be the same for initiator
and executor, so we will differentiate this as it can
be seen represented in cost tables (Table 1).
Transaction_cost =
= Initiator_Cost + Executor_(cost) =
= (Sum of Initiator Acts_cost)
+ (Sum of Executor Acts_cost)
(5)
Demo-basedCostModel
435
The Business Process Cost BP_cost can be obtained
with Eq. 6 for ontological transactions T1 to TN.
Here we only consider ontological transactions
that have their result at the end of the result structure
chart, since we don't want to include costs that
already were considered, due to dependencies (Eq.
4).
BP_cost = T1cost + T2cost + ...+ TNcost (6)
Cost Tables. The third step of phase two is to fill
cost tables. In Table 1 we represent the Transaction
Costs, which we only consider transactions that are
parameters of Eq. 6. Here two rows represent
Initiator and Executor Actor Role, their acts are in
columns and each cell will have the correspondent
Act Cost (calculated using Eq. 4).
In Table 2 we represent Business Process Costs,
but only those that are parameters of Eq. 6. Here we
can represent also how each Transaction Cost is
related to each Actor Role responsibility area,
understanding the implementation cost for the
organization when providing a service or product.
DEMO models show actor roles and their area of
responsibility (represented in Fig. 4 with a grey
colour rectangle). Since the limit of actor roles
responsibility areas is well defined, we can trace
costs between actor roles and their acts. The
advantage of associating costs to actor roles is the
overview about specific roles costs, understanding
which ones are more costly.
The Cost Model is the last phase of the proposed
method. With this method we have a direct
correspondence between ontological acts costs and
their implementation costs. Then analysis can be
made, concerning which transactions are more
costly, who is responsible for them, or even make
other conclusions about the organization costs.
4 DEMONSTRATION
This section corresponds to the Demonstration step
of Design Science Research Method. The
application of the artefact is presented using Invoice
Management of a Portuguese research group.
4.1 Modelling Phase
The research group is a Portuguese private group
composed by thirty persons, dedicated to the
research, innovation and development of new
solutions to problems in the IT Governance and
digital services areas. The invoice department is a
shared service company that provides financial
services to the research group, including invoice
management.
Next we describe the invoice management
process, making DEMO analysis. In red we colour
Performa items, green Informa items, and for Forma
items. Brackets enclose parts of text, namely “[“ and
“]” indicate an actor role, “(“ and “)” indicate a C-
act/result, and the brackets “<” and “>” indicate a P-
act/result.
The process is conducted by e-mail. It starts
when the [chief of the research and development
unit] needs to (send an invoice) to a [customer].
He then (e-mails) [someone at the invoice
department], belonging to the shared services
company that provides financial services. This e-
mail contains information about the date, value,
address or description that should be present in
the invoice. After receiving the e-mail, the
[invoice department] <has to create the invoice>
and <send> it to the [customer], adding in
carbon copy (CC) the chief of the research and
development unit. When the invoice is paid, the
research group leader receives an e-mail
In Table 3 we present all identified transactions,
their result, and then we colour them accordingly to
each transaction type. Note that transactions that are
not ontological are identified as DT or IT, meaning
that they are datalogical transaction or infological
transaction, the same for transactions results.
Table 3: Transaction Result Table (TRT) with transaction
types and result types.
Transaction Result Type
T01 service payment R01 service P has been paid
DT02 invoice sending
DR02 invoice I has been sent
on date D
DT03 invoice creation
DR03 invoice I has been
created on date D
IT04 additional
information obtainment
IR04 additional information for
invoice I has been obtained
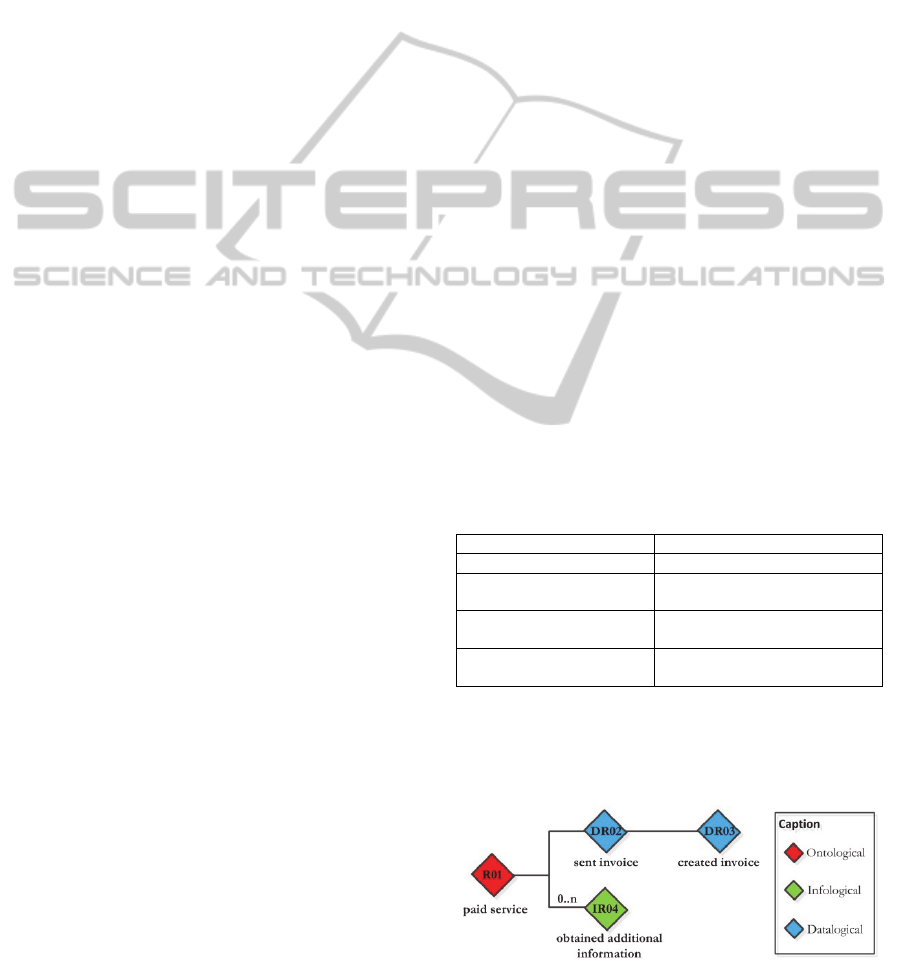
The Result Structure Analysis allows us to
identify dependencies and in this case three
dependencies are identified.
Figure 2: Result structure chart.
KEOD2013-InternationalConferenceonKnowledgeEngineeringandOntologyDevelopment
436
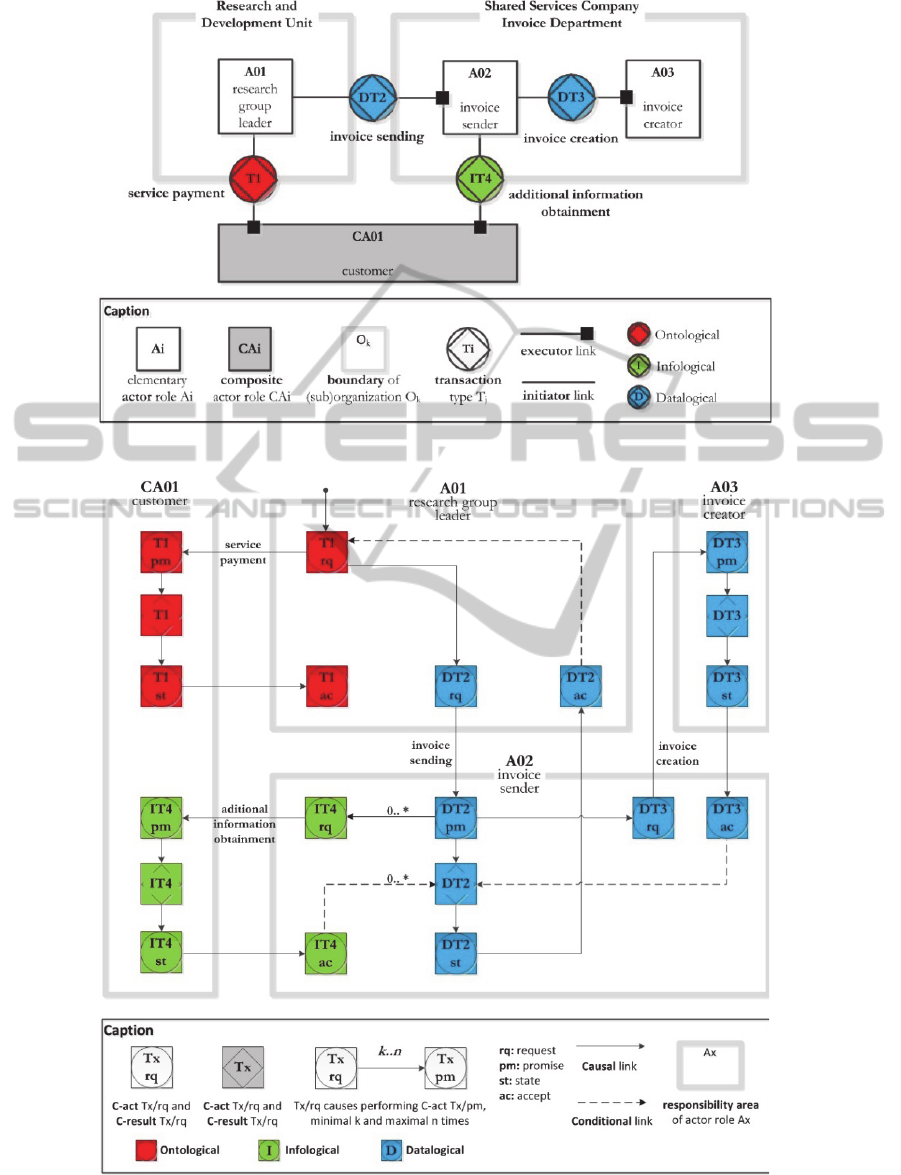
Figure 3: Actor Transaction Diagram (ATD).
Figure 4: Process Structure Diagram (PSD).
Demo-basedCostModel
437

In Fig. 2 we can see the first dependency is that
in order to pay for the service, an invoice has to be
sent first, but for that it has to be created (second
dependency).
The third dependency is the result of additional
information to pay the service. Since this
dependency is optional, the minimum number is
zero and the maximum number is variable.
4.1.1 Interaction Model
The interaction model is presented next, where
transactions are coloured accordingly to the
distinction axiom.
In Fig. 3 the actor role A01 (research group
leader) represents the person who want the service to
be paid (Transaction T1) by the customer,
represented by the actor role CA01. The actor roles
A02 and A03 represent the person who works in the
Invoice Department, responsible for sending
(transaction DT2) and creating the invoice
(transaction DT3). Actor role A02 can also request
to customer additional information (transaction IT4).
4.1.2 Process Model
In figure 4 we present the Process Structure Diagram
(PSD) for invoice management.
In PSD we colour the acts accordingly to the
distinction axiom. Transaction T1 represents a
request for service payment, by the Research Group
Leader to customer. Transaction DT2 is initiated and
leads to a request for invoice sending, by the
Research Group Leader to the invoice sender. If
more information was needed, IT4 request would be
initiated by the invoice sender and executed by
customer, this demonstration consider that IT4 do
not happen. In Transaction DT3 there is a request for
invoice creation, by the invoice sender to invoice
creator.
We could continue to present the other diagrams,
but ATD and PSD are enough for this
demonstration, since they have all the information
we need to proceed to the Cost Model phase.
4.2 Cost Model
The second phase of the demonstration continues
with Cost Model, which is composed by three steps:
1) Calculate Capacity Cost Rate; 2) Calculate Cost
Equations; 3) Fill Cost Tables.
4.2.1 Capacity Cost Rate
Based on the PSD of Fig. 4 we construct Table 4 to
show CCR for Actor Roles, using Eq. 3 in which the
expenses and available capacity indicated are only
estimates (considered to be four times more than the
cost of a salary).
Table 4: Capacity cost rate calculation.
Actor Role
Expenses
Attributable
by month
Available
Capacity in
minutes
CCR
€/min
CA01
Customer
€ 6000 9000 minutes 0.67
A01 Research
Group Leader
€ 8000 9000 minutes 0.89
A02 invoice
Sender
€ 4000 9000 minutes 0.44
A03 Invoice
Creator
€ 4000 9000 minutes 0.44
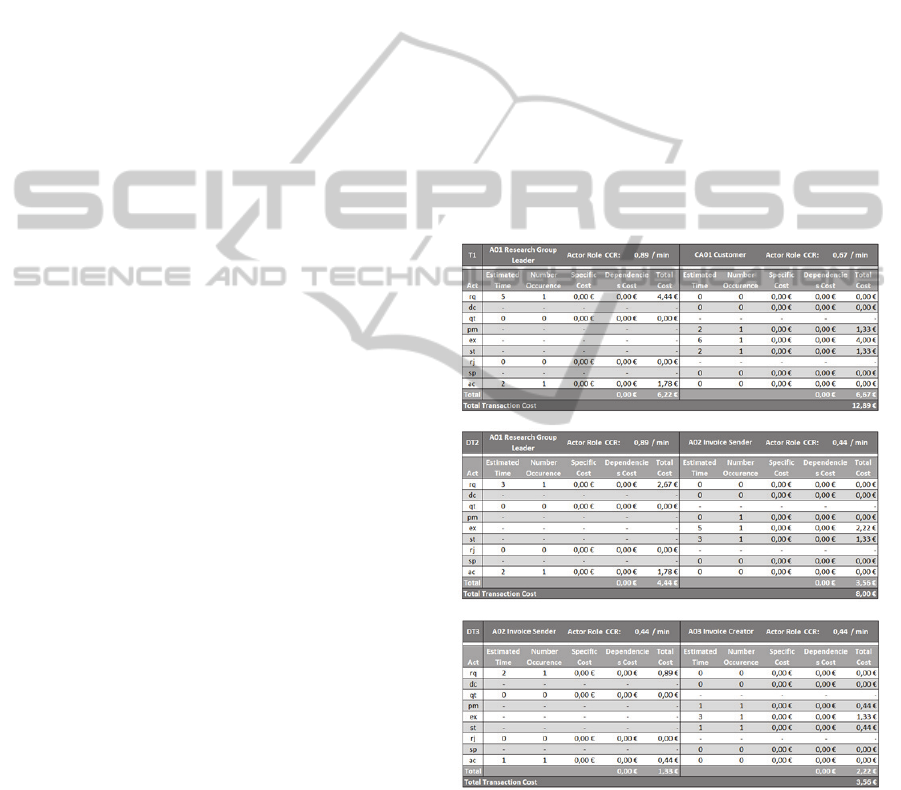
4.2.2 Cost Equations
In this step we calculate the cost equations, which
calculations are in attachment (see Appendix).
KEOD2013-InternationalConferenceonKnowledgeEngineeringandOntologyDevelopment
438
Table 5: Transaction T1 Costs.
T1
rq dc qt pm ex st rj sp ac €24.44
A01 Research Group Leader €16 - €0 - - - €0 - €1.78 €17.78
CA01 Customer €0 €0 - €1.33 €4 €1.33 €0 €0 €0 €6.67
Table 6: Unitary Transaction Cost for each Actor Role.
CA01 A01 A02 A03 Sum
T1 €6.67 €6.22 €0.00 €0.00 €12.89
DT2 €0.00 €4.44 €3.56 €0.00 €8.00
DT3 €0.00 €0.00 €1.33 €2.22 €3.56
IT4 €0.00 €0.00 €0.00 €0.00 €0.00
Sum €6.67 €10.67 €4.89 €2.22 €24.44
Since Transaction IT4, corresponding to
additional information obtainment, was not initiated
the cost equations for this transaction were not
presented.
4.2.3 Cost Tables
Next we fill the first cost table to calculate each act
cost. Notice that we only have one transaction
represented in Table 5, since there is only one
transaction that has result at the end of result
structure chart.
The reasoning to obtain implementation costs of
T1rq was:
T1rq_cost = T1rq_(unit.cost) + DT2_cost +
DT3_cost = €4.44 + €8.00 + €3.56 = €16.00
(7)
We do not present a similar table to Table 2 to
represent this Business Process Costs, since there is
only one ontological transaction. However, we
choose to represent in Table 6 the cost of each
unitary transaction (without its implementation cost)
for each actor role.
In Table 6 we can observe that Business Process
Cost is €24.44, but if we exclude CA01 cost, the
client participation on costs, we can calculate
organization invoice management cost: €24.44 -
€6.67 = €17.78.
5 EVALUATION
This evaluation assesses the demonstration we made
at Invoice Department. We have collected feedback
from practitioners, applied the Moody & Shanks
Framework and used the Österle principles.
5.1 Evaluation Strategy
In this subsection we identify what is actually
evaluated, how it is evaluated and when the
evaluation takes place. To do so we illustrate the
answers in three questions proposed by the
framework (Pries-Heje 2004):
What is actually evaluated? The artifact to be
evaluated is the method proposed, Section 3.2;
How is it evaluated? We used feedback gathered,
the Moody & Shanks and the Österle Principles
to evaluate the DEMO-based Cost Model. This
represents a naturalistic evaluation, it was
conducted in a real organization, using a real
artefact;
When was it evaluated? It was evaluated ex post,
after the design artefact was developed.
To evaluate the proposed artifact, using the eight
quality factors of the Moody & Shanks Framework,
the following results are presented:
Completeness: our focus is on one specific part
of the organization, however we consider that the
Transaction Result Table and the Actor
Transaction Diagram can represent consistently
the description of the Invoice and Research
Departments;
Integrity: we have identified dependencies
between the transactions which are illustrated in
the Process Structure Diagram (PSD), and
expressed the organization business process;
Flexibility: this aspect of quality decreases with
the increase of the number of transactions, actor
roles and dependencies;
Understandability: the models at the beginning
are difficult to understand because the
stakeholders must know DEMO in order to
model the organization with the models proposed
in this methodology;
Correctness: DEMO and TDABC have strong
theoretical foundation, that allows to model
correctly organizations and trace the
implementation costs of essential operations;
Simplicity: DEMO and TDABC allow to
overcome the complexity of organizations;
Demo-basedCostModel
439

Integration: with the description of the
organization we have enough information to
construct the Transaction Result Table (TRT),
the Result Structure Chart and to model the
organization. We think that these models are
consistent with organizations reality and allow to
model the organization in a consistent way, by
easily integrating DEMO and TDABC;
Implementability: this artifact can be
implemented since DEMO allows to model the
organizations implementation operations details
and focuses on organization essence.
As results of applying Moody & Shanks Framework,
the negative aspects were Flexibility and
Understandability, the other aspects have a positive
result.
5.2 Österle Principles
We present the evaluation of the proposed artifact,
based on the feedback received from academics and
practitioners. This research was presented at a
workshop, attended by experts who gave some
positive feedback of our proposal, allowing us to
answer the Österle principles:
Abstraction: this artifact can be applied to
different organizations and operations,
considering the ontological, infological and
datalogical layers. Organizations operations can
be identified through interviews, documents and
from a given description;
Originality: the proposed artifact has the novelty
of combining DEMO and TDABC. This new
approach allows to aggregate implementation
details into actor roles, regarding time equations
in transaction acts;
Justification: the artifact is justified by the
”Theorical Background” of DEMO and TDABC,
with a strong conceptual foundation allowing to
eliminate all the inconsistencies and limitations
occurring in other solutions. Also, our artifact
was validated by the positive feedback gathered
when communicating our findings to
practitioners, as explained before;
Benefit: the DEMO-based Cost Model allows to
identify and trace the costs of implementing the
organizations essential operations in a fast and
easy way. The feasibility of aggregating costs
especially between actor roles and their
responsibility in acts, transactions and business
process cost, gives an important contribution to
solving the identified problem.
6 CONCLUSIONS
Managing organizations is a growing challenge due
to their complexity. The traceability between the
organization essence and the respective
implementation costs has been lost. Most
organizations do not have a coherent, comprehensive
and consistent vision of the costs related to the
essential operations (Dietz, 2006).
In this research we have presented a DEMO-
based cost model solution. We expect that this
solution can give a contribution to the understanding
of essential operations costs, relating them to their
implementation costs and areas of responsibility. So
far we found several aspects: it is possible to have a
traceability between the enterprise essence, the
implementation costs and responsibility areas costs;
an association is possible between TDABC terms
and DEMO terms; a composite cost structure can be
constructed in DEMO, relating acts cost,
transactions cost and business process cost.
The research was conducted using the Design
Science Research Methodology. The evaluation of
our proposal uses several methods as the Moody and
Shanks Quality Management Framework, the
Österle et al. principles and communication to
scientific community. As future work, we intend to
apply and validate our proposal in several
organizations in the next months. Also we intend to
submit papers, communicating our findings to the
scientific community and other interested audience.
REFERENCES
Association of Chartered Certified Accountants & Institute
of Management, Finance leaders survey report:
December 2012, viewed April 2013,
<http://www.imanet.org/PDFs/Public/Research/pol-af
b-fls01.pdf>.
Blocher, E., 2005, Cost Management: A strategic
emphasys, McGraw-Hill/Irwin, viewed 2005.
BusinessBalls, Business Process Modelling History,
viewed April 2013, <http://www.businessballs.com/
business-process-modelling.htm>.
Chinosi, & Trombetta, A., 2012, 'BPMN: An introduction
to the standard', Computer Standards & Interfaces, vol
34, pp. 124--134.
Cross, R. & Parker, A., 2004, The Hidden Power of Social
Networks: Understanding How Work Really Gets
Done in Organizations, Harvard Business School
Press.
Dietz, J., 2003, 'Generic recurrent patterns in business
processes', Business Process Management, pp. 200--
215.
KEOD2013-InternationalConferenceonKnowledgeEngineeringandOntologyDevelopment
440
Dietz, J., 2006, Enterprise Ontology: Theory and
Methodology, Springer.
e3value, The e3value methodology: Exploring innovative
e-business ideas, viewed April 2013,
<http://e3value.few.vu.nl/e3family/e3value/>.
Gordijn, J., Akkermans, H. & Vliet, V., 2001, 'Designing
and evaluating e-business models', IEEE intelligent
Systems, vol 16, pp. 11--17.
Hevner & March, S 2004, 'Design Science in Information
Systems Research', MIS Quarterly, vol 28, pp. 75--
105.
Kaplan , R & Porter, , Why Medical Bills Are a Mystery,
viewed May 2013, <http://www.nytimes.com/2012/
04/15/opinion/sunday/why-medical-bills-are-a-myster
y.html?_r=3&>.
Kaplan, R & Anderson, S 2007, Time-Driven Activity
Based Costing, Harvard Business School Publishing
Corporation.
Kaplan, R. & Anderson, S., 2007, Time-Driven Activity-
Based Costing: A simpler and more powerful path to
higher profits, Harvard Business School Press.
Management and Technology Consultancy, B 2013, Spend
Management: Key Elements for Realising Cost
Savings in Procurement, <http://www.bearingpoint.
com/en-other/download/Spend_Mgmt_WP_FI_8p.pdf
>.
Moody L., & Shanks, G., 2003, 'Improving the quality of
data models: empirical validation of a quality
management framework', Information Systems, vol 28,
pp. 619--650.
Muehlen, M., 2008, 'Getting started with business process
modeling', IIR BPM Conference, Orlando, Florida.
Mulder, H. & Dietz, J., 'Business Architecture based on
the integration of Communication, Actors and
Production'.
Nuffel, Mulder & Kervel, 2009, 'Enhancing the formal
Foundations of BPMN by Enterprise Ontology',
Advances in Enterprise Engineering III, 2009, pp.
115--129.
Osterle, H., 2010, 'Memorandum on design-oriented
information systems research', European Journal of
Information Systems, vol 20, pp. 7-10.
Pesonen, L., 2001, Implementation of design to profit in a
complex and dynamic business context, viewed April
2013, <http://herkules.oulu.fi/isbn9514264509/isbn95
14264509.pdf>.
Pries-Heje, J., 2004, 'Strategies for Design Science
Research Evaluation', 16th European Conference on
Information System (ECIS).
Ray, L., 2013, Overhead Costs in a Service Industry,
<http://smallbusiness.chron.com/overhead-costs-servic
e-industry-20984.html>.
Richardson, K., 2008, 'Managing complex organizations:
Complexity thinking and the science and art of
management', Emergence, vol 10, pp. 13--26.
Roberts, & Silvester, K. J., 1996, Why ABC failed and
how it may yet succeed, viewed April 2013,
<http://maaw.info/ArticleSummaries/ArtSumRoberts9
6.htm>.
Schapper, J., Cieri, H. & Cox, J., 2005, The Ontological
and Epistemologicla Dimensions of Complex
Organisations.
Scheer, A. W., 2000, ARIS: business process modeling.
Tuunanen, T, Rothenberger, M & Chatterjee, K 2008, 'A
Design Science Research Methodology for
Information Systems Research', Journal of
Management Information Systems, vol 24, pp. 45--77.
Weinberg, G 2001, An Introduction to General Systems
Thinking, Dorset House Publishing.
Weinberg, G. M., 2001, An Introduction to General
Systems Thinking, Dorset House Publishing.
WFMC 1999, Workflow Management Coalition -
Terminology and Glossary, viewed May 2013,
<http://www.wfmc.org/standards/docs/TC-1011_term
_glossary_v3.pdf>.
Wileman, A., 2008, Driving Down Cost: How to Manage
and Cut Costs - Intelligently, Nicholas Brealey
Publishing.
APPENDIX
Demo-basedCostModel
441
