
On the Impact of Pathological Tremor Intensity on Noninvasive
Characterization of Motor Unit Discharge Properties
Petra Povalej Bržan
1
, Vojko Glaser
1
, Simon Zelič
1
, Juan Álvaro Gallego
2
,
Juan Pablo Romero Muñoz
3,4
and Aleš Holobar
1
1
System Software Laboratory, University of Maribor, Smetanova ulica 17, 2000 Maribor, Slovenia
2
Bioengineering Group, Consejo Superior de Investigaciones Científicas, Madrid, Spain
3
Neurology Department, 12 de Octubre University Hospital, Madrid, Spain
4
Medical School, Faculty of Health Sciences, Francisco de Vitoria University, Madrid, Spain
Keywords: Surface Electromyograms, Decomposition, Motor Units, Pathological Tremor, Motor Unit Discharge
Patterns.
Abstract: The impact of severity of pathological tremor on surface EMG decomposition was systematically assessed
on eight essential tremor patients. The inertial data and surface EMG signals were concurrently recorded
from wrist extensor and flexor muscles of both patients’ arms. The inertial recordings were segmented into
different tremor cycles and the tremor amplitude was assessed in each tremor cycle. Surface EMG was
decomposed by Convolution Kernel Compensation (CKC) technique in order to yield individual motor unit
discharge patterns in each tremor cycle. Accuracy of EMG decomposition was assessed for each identified
motor unit and was largely uncorrelated with tremor amplitude. In all the patients, the percentage of EMG
energy identified by decomposition and the number of identified motor units were found to be positively
correlated with tremor amplitude, though the correlation was relatively weak and not always significant.
The results demonstrate that the CKC decomposition not only copes with moderate and severe tremor but
also improves its performance with tremor intensity.
1 INTRODUCTION
Pathological tremor is one of the most common
movement disorders, affecting up to 15% of
population aged between 50 and 89 years (Benito-
León et al., 2006). Although not life-threatening,
tremor causes serious difficulties in activities of
daily living and greatly reduces the quality of life of
affected person.
Among pathological tremors, essential (ET) and
Parkinsonian (PD) tremors are the most common.
None of them is completely understood and their
origin is largely unknown. It has been previously
demonstrated that in both tremors peripheral (PNS)
and central nervous system (CNS) interact with each
other (Halliday et al., 1995) to produce rhythmic,
involuntary oscillatory movements of various body
parts.
Involvement of CNS into the tremor genesis is
typically assessed by neuroimaging techniques, such
as Dynamic imaging of Coherent Sources (Gross et
al., 2001) and Renormalized partial directed
coherence (Scheltera et al., 2009) that offer an
important insight into the connectivity and
tremorogenic activity of central networks, such as
primary sensor motor cortex, thalamus and basal
ganglia. For example, it has been demonstrated that
in PD patients basic tremor frequency and its higher
harmonics could have different cortical origins
(Muthuraman et al., 2012). The same differences
have been also observed in ET patients, but to much
lesser extent than in PD (Muthuraman et al., 2012).
On the other hand the tremorogenic activity of
PNS is measured by the inertial and EMG sensors.
Inertial recordings are easy to collect and, thus, very
appealing candidates for the tremor quantification,
diagnosis and/or tracking (Deuschl et al., 1995);
(Muthuraman et al., 2011); (Saunders-Pullman et al.,
2008); (Groznik et al., 2013). However, although
agreeing on the diagnostic power of the inertial
recordings, the current studies offer limited insight
into the origin of mechanic oscillations. The latter
can be better assessed by the EMG measurements.
However, practically all published studies focus on a
126
Povalej Bržan P., Glaser V., Zeli
ˇ
c S., Gallego J., Romero Muñoz J. and Holobar A..
On the Impact of Pathological Tremor Intensity on Noninvasive Characterization of Motor Unit Discharge Properties.
DOI: 10.5220/0004664001260132
In Proceedings of the International Congress on Neurotechnology, Electronics and Informatics (DeNeuro-2013), pages 126-132
ISBN: 978-989-8565-80-8
Copyright
c
2013 SCITEPRESS (Science and Technology Publications, Lda.)

very simple surface EMG metrics, such as EMG
rectification, to estimate the neural drive to
tremorogenic muscles (Gross et al., 2001);
(Scheltera et al., 2009); (Raethjen et al., 2009).
Moreover, surface EMG acquisition is typically
limited to bipolar recording systems that offer no
insight into discharges of individual motor units
(MUs). This is a problematic step as surface EMG
amplitude is known to reflect many anatomical
properties of investigated muscles that interfere with
the central control component (voluntary and
tremorogenic neural drive) from spinal and
supraspinal neural circuits (Farina et al.; 2008,
2010).
A very few studies of individual MU discharge
characteristics in pathological tremor exist. They
focus mostly on PD patients (Das Gupta, 1963);
(Dietz et al., 1974); (Dengler et al., 1986);
(Christakos et al., 2009), whereas the studies of MUs
in ET patients are close to absent. Moreover, all
these studies rely on invasive indwelling EMG
recordings that limit the number of concurrently
identified MU to a very few and hinder their long-
term tracking.
Recently, advanced surface EMG decomposition
technique has been demonstrated to identify the
discharge patterns of up to several tens individual
motor units in wrist flexors and extensors of tremor
patients (Holobar et al., 2012). The work presented
herein extends the one in (Holobar et al., 2012) by
systematically assessing the relationship between the
identified MU discharge patterns and the severity of
pathological tremor. This study focuses on ET
patients, whereas PD patients will be addressed in
the future work.
2 PROCEDURE
Eight ET patients (3 females, 5 males, age of 688
years), with mild (4 patients), moderate (2 patients)
and severe (2 patients) tremor according to the Fahn-
Tolosa-Marin scale participated to the experiment.
Six patients had family history of essential tremor.
Three patients (patient B, C and D) were taking
medications for the treatment of ET syndromes.
Detailed description of the patients is presented in
Table 1.
The experiments were conducted in accordance
with the Declaration of Helsinki and approved by
the ethics committee of the 12 de Octubre University
Hospital, Madrid, Spain. The patients received a
detailed explanation of the study and gave written
informed consent prior to participation.
Table 1: Description of patients involved in the study.
Patient Gender Age Family history
Age at tremor
onset
Tremor
severity
A F 69 yes 48 severe
B F 63 yes 56 moderate
C M 76 no 74 moderate
D M 67 yes 46 mild
E M 75 yes 32 mild
F M 69 yes 59 mild
G F 51 no 41 mild
H M 73 yes 50 severe
2.1 Experimental Protocol
The patients were equipped with surface EMG
sensors and inertial measuring units (IMUs)
mounted bilaterally over both upper extremities.
Inertial sensors with 3D accelerometer, gyroscope
and magnetometer (Technaid Motion Capture
System) have been mounted to the third metacarpal,
edge of the forearm (dorsal side), olecranon process
and distal part (dorsal side) of each arm. The inertial
signals were sampled at 200 samples/s and recorded
concurrently with surface EMG.
Matrices of 12×5 surface electrodes (OT
Bioelettronica and LISiN, Italy) were centred over
the bellies of the left and right flexor carpi radialis
and extensor carpi ulnaris. Before mounting the
matrices, the skin has been lightly abraded by using
the abrasive paste (Meditec–Every, Parma, Italy)
and cleansed afterward. Electrical conductivity was
ensured by filling the electrode grids with
conductive gel (Meditec–Every, Parma, Italy). The
signals were amplified, band-pass filtered (3 dB, 10-
500 Hz) and sampled at 2048 samples/s (EMG-
USB2 amplifier, OT Bioelettronica).
Patient performed three repetitions of the
following tremor-triggering tasks, each in duration
of at least 30 s:
1. Arms outstretched against gravity (AO): after 5
seconds of rest, the patient outstretched his/her
arms and maintained the posture against gravity.
2. Arms outstretched against gravity with weights
(WO): the same as AO task with additional
weight load of ~1kg applied to both hands.
3. Arms supported + postural tremor elicited (PO):
patient was sitting relaxed, with arms supported
in elbow and with wrists hold extended against
the gravity.
OntheImpactofPathologicalTremorIntensityonNoninvasiveCharacterizationofMotorUnitDischargeProperties
127

2.2 Data Analysis
The acquired surface EMG signals were
decomposed by Convolution Kernel Compensation
(CKC) technique (Holobar et al., 2012), which is
fully automatic and provides so called Pulse-to-
Noise ratio (PNR) which has been demonstrated to
reliably assess the decomposition accuracy for every
identified motor unit (Holobar et al., 2013). Only
MUs, with PNR > 26 dB and, thus, sensitivity in
identification of discharges > 80 % and false alarm
rates < 5 % (Holobar et al., 2013) were kept for
further analysis. All the remaining motor units were
discarded.
The surface EMG signals were reconstructed
using the MU action potential (MUAP) shapes
estimated by spike-triggered averaging of surface
EMG (Holobar et al., 2010) and the discharge times
estimated from the surface EMG decomposition.
The surface EMG reconstructed in this way was
compared with the original signal by the following
signal-to-interference ratio (SIR):
2
2
(() ())
( ) 1 100 %
()
iij
j
i
xn z n
E
SIR i
E
xn
(1)
where x
i
(n) denotes the i-th surface EMG channel
and z
ij
(n) stands for the MUAP train of the j-th MU
as reconstructed from the i-th surface EMG signal.
In addition to decomposition, surface EMG was
also band-pass filtered (50-200 Hz) and full-wave
rectified (Halliday et al., 1995). Relative power
(RP
BF
) of basic tremor frequency was then
calculated for each EMG channel as the ratio
between the peak in the power spectrum of rectified
EMG and its total power.
The recorded IMU data has been upsampled to
2048 samples/s, synchronized with EMG signals and
processed by Ensemble Empirical Mode
Decomposition (Wu et al. 2009) in order to extract
tremor component from voluntary movement
(Rocon et al., 2006). The extracted tremor
component and the MU discharge patterns have been
segmented into different tremor cycles (Figure 5).
The following metrics have been calculated for each
identified tremor cycle: the mean tremor amplitude
and power as assessed from inertial data, the number
of active MUs as assessed from surface EMG
decomposition, the total number of MU discharges
and standard deviation (SD) of their discharge times
within the tremor cycle.
All extracted features were statistically analysed
in RStudio software. The Wilcoxon matched pairs
signed rank test was used to compare the extracted
features between extensors and flexors muscles and
Spearman correlation coefficient was used to
evaluate the relationship between the RP
BF
and SIR
and inertial tremor measurements and MU discharge
characteristics, respectively. Statistical significance
was set to P<0.05. The results are presented as mean
± SD.
3 RESULTS
From 2 to 30 (19.2 ± 8.8) MUs were identified in
extensors muscles and from 0 to 32 MUs (18.9 ±
11.1) in flexor muscles in all the patients and all the
tasks. All the cases with zero identified MUs
coincided with the lack of muscle activity as
measured by surface EMG. PNR was not
significantly correlated with RP
BF
, except in patient
H, where a positive correlation of 0.48 and 0.61 was
observed in the extensor and flexor muscles of
dominant tremor arm, respectively.
Figures 1 and 2 depict the distribution of the
maximal RP
BF
(maximum calculated across all EMG
channels per matrix) and the SIR, as defined in Eq.
(1), calculated on the channel with maximal RP
BF
(SIR*). Across the patients, the maximal RP
BF
varied from 0.04 to 0.72 (0.24 ± 0.17) on extensor
and from 0.05 to 0.65 (0.24 ± 0.17) on flexor
muscles (Figure 1).
Figure 1: Distribution of the maximal RP
BF
across all the
tasks of individual patients.
NEUROTECHNIX2013-InternationalCongressonNeurotechnology,ElectronicsandInformatics
128
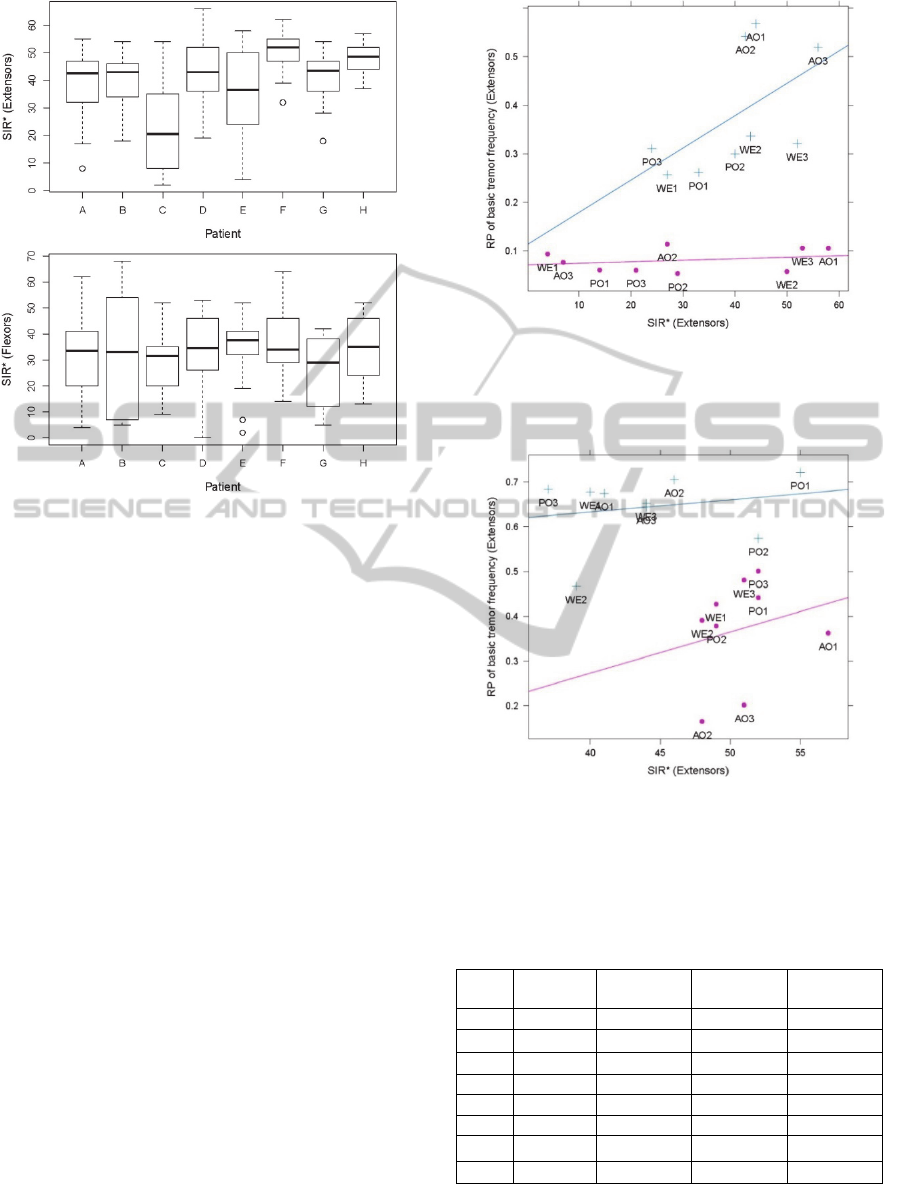
Figure 2: Distribution of SIR* across all the task
repetitions of individual patient. In each task repetition,
the SIR* was calculated on the EMG channel with
maximal RP
BF
.
Wilcoxon matched pairs signed rank test
indicated no significant differences in maximal RP
BF
of extensors and flexors muscles, except in patient B
where maximal RP
BF
was significantly higher in
extensors (z = -2.72). In EMG channel with maximal
RP
BF
, the SIR* varied from 2 to 66% (39.6 ± 14.2 )
on extensor and from 0 to 68% (31.9 ± 15.2) on
flexors muscles. Wilcoxon matched pairs signed
rank test indicated significant difference between
SIR of extensor and flexor muscles in 4 out of 8
patients (Patient A, F, G and H in Figure 2).
The relation between the maximal RP
BF
and the
corresponding SIR in each task repetition is depicted
in Figures 3 and 4 and summarized in Table 2.
Practically all the patients exhibited a positive
correlation between the RP
BF
and the SIR* in at least
one out of extensor and flexor muscles. In six out of
eight patients, the correlation was statistically
significant (P < 0.05). In patients G and H the
correlation was not statistically significant. In patient
H correlation was negative but SIR* was extremely
high over all measurements on wrist extensors
(Figure 4) and flexor muscles (results not shown).
In patient G, the tremor amplitude was always low
(Figure 1).
Figure 3: The relationship between the RP
BF
of wrist
extensor muscle and the SIR* (patient E). Blue plusses
depict results on dominant hand, the pink dots represent a
non-dominant hand.
Figure 4: The relationship between the RP
BF
of wrist
extensor muscle and the SIR* in patient H. Blue plusses
depict results on dominant hand, the pink dots represent a
non-dominant hand.
Table 2: Correlation coefficients between the maximum
RP
BF
and SIR* in both arms.
▲
statistically significant
correlation, Spearman Correlation test (P < 0.05).
Patient
Extensors
R
P
BF
& SIR*
Flexors RP
BF
& SIR*
Extensors No.
MUs & SIR
Flexors No.
MUs & SIR
A 0.49
▲
0.16 0.79
▲
0.57
▲
B 0.51
▲
0.42 0.76
▲
0.87
▲
C 0.62
▲
0.19
▲
0.71
▲
0.29
D 0.30 0.80
▲
0.93
▲
0.80
▲
E 0.41 0.74
▲
0.71
▲
0.56
▲
F -0.25 0.54
▲
0.36 0.35
G 0.13 0.05 0.37 0.73
▲
H - 0.33 0.36 0.00 0.89
▲
In dominant tremor arm alone a significant
correlation between the RP
BF
and the SIR* was
OntheImpactofPathologicalTremorIntensityonNoninvasiveCharacterizationofMotorUnitDischargeProperties
129
observed in the wrist flexor or extensor muscles in 4
patients only. The reduction in sample size (3 AO, 3
PO and 3 WE taks) is the most likely reason. In the
nondominant tremor arm the correlation was
frequently not significant, likely because of
relatively low tremor amplitude values, especially in
patients with unilateral tremor (Figure 3).
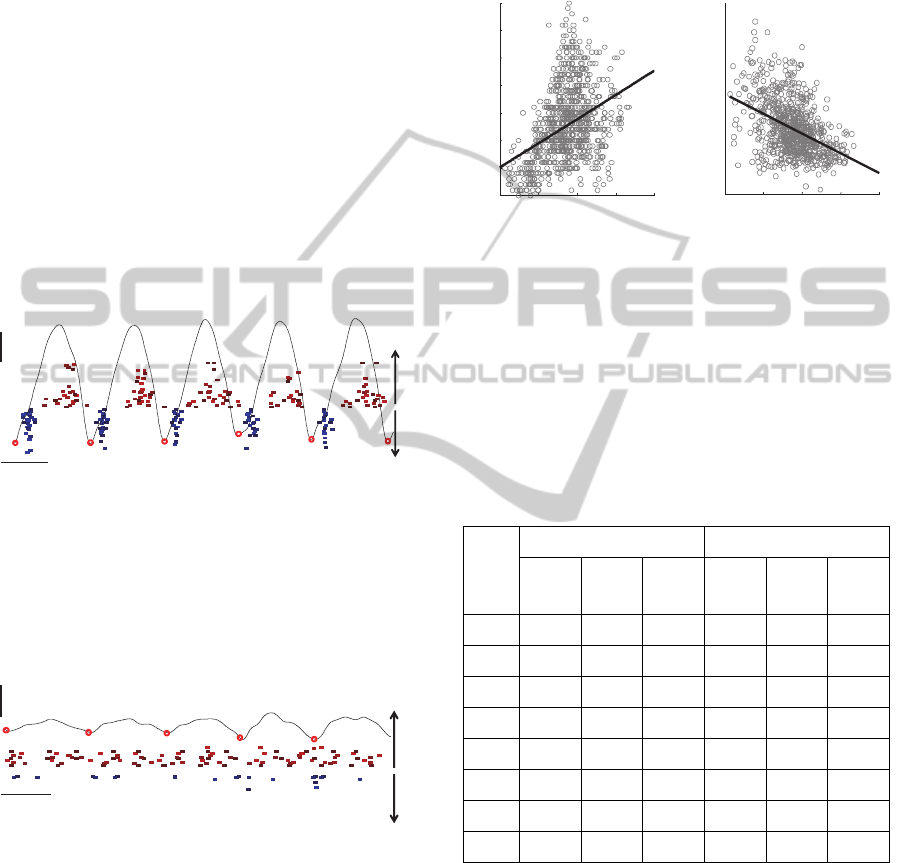
The discharge patterns of individual MUs as
identified by surface EMG decomposition of
extensor and flexor muscles of dominant tremor
hand in patient H are depicted in Figure 5, along
with the tremor component as recorded by inertial
sensor placed at the patient’s wrist. Out-of-phase
flexor-extensor activity is clearly visible. The MU
discharge patterns in the same patient but during the
period of low tremor amplitude are depicted in
Figure 6. The difference in MU discharge patterns
between the periods with high and low tremor
amplitudes are clearly visible.
Figure 5: discharge patterns of individual MUs identified
by surface EMG decomposition of extensor and flexor
muscles of dominant tremor arm in patient E during the
period of high tremor amplitude. Each filled rectangle
denotes one MU firing. Thin black line depicts the tremor
component as measured by the inertial sensor. Circles
denote the segmentation of inertial tremor recording into
the tremor cycles.
Figure 6: discharge patterns of individual MUs identified
by surface EMG decomposition of extensor and flexor
muscles of dominant tremor hand in patient E during the
period of low tremor amplitude.
The global relationship between the tremor
amplitude as assessed by inertial measurements and
the identified MU discharge characteristics in each
tremor cycle are exemplified in Figure 7 and
summarized in Table 3. In the tremor dominant arm,
all the patients exhibited relatively weak but
statistically significant positive correlation between
the tremor amplitude and the number of MUs
discharges per tremor cycle in at least one of
measured muscles (wrist extensors and flexors). The
same applies for the number of active MUs (Table
3).
Figure 7: The number of MUs discharges per tremor cycle
as identified from the left wrist extensor of patient H (left)
and the dispersion of their discharge times (right) vs.
tremor amplitude in each tremor cycle. Results are
accumulated over three repetitions of AO, WE and PO
tasks.
Table 3: Correlation coefficients between the number of
MUs (No. MUs), the number of their discharges (No. MUs
disch.), and their dispersion (SD MUs) in individual
tremor cycle and the tremor amplitude as measured by
inertial sensor placed at dominant wrist; n.s. - not
significant.
Patient
Flexors Extensors
No.
MUs.
No.
MUs
disch.
SD MUs
No.
MUs.
No.
MUs
disch
SD MUs
A n.s. n.s. -0.25 0.24 0.24
-0.48
B 0.19 0.21 n.s. n.s. n.s. -0.20
C
0.47
0.25 n.s. 0.19 0.16 -0.26
D
0.47 0.46
-0.18 n.s n.s -0.14
E 0.26 0.29 n.s.
0.42
0.32
-0.43
F n.s. 0.20 n.s. 0.25 0.31 n.s.
G 0.11 0.12 n.s. 0.20 0.18 -0.25
H
0.53 0.52
n.s. 0.37
0.45 -0.44
Dispersion of MU discharges within the tremor
cycles, as measured by SD of MU discharge times
was inversely related to tremor amplitude, though
also in this case the correlation coefficients were
relatively small.
It is noteworthy that the strongest correlations
between the tremor amplitude and investigated MU
discharge characteristics were observed in patients
with strongest tremor (A, C, D, E and H), whereas
they were much weaker or even not significant in the
100ms
1m/s
extensorflexor
100ms
1m/s
extensorflexor
0 1 2 3 4
0
5
10
15
20
25
30
35
Tremor amplitude (m/s)
No. MU discharges
0 1 2 3 4
0
0.01
0.02
0.03
0.04
0.05
0.06
0.07
0.08
SD of MU discharge times (s)
Tremor amplitude (m/s)
NEUROTECHNIX2013-InternationalCongressonNeurotechnology,ElectronicsandInformatics
130

patients B, F and G with relatively mild tremor. The
strongest correlations were observed in patient with
the most severe tremor (patient H).
Also interesting, there were frequently different
trends in MU behaviour with increasing tremor
amplitude. Patient A, for example, increased the
number of active MUs in extensors and
synchronized their discharges. The same MU
synchronization was also observed in flexor muscle,
though to much less extent. Patient D, on the other
hand, mostly increased the number of active MUs
and their discharges in the flexor muscle.
4 CONCLUSIONS
In this study, the CKC-based decomposition of
multichannel surface EMG was tested on eight ET
patients with different tremor severity. Two different
measures of decomposition performance have been
applied. First, the PNR measure of decomposition
accuracy (Holobar et al., 2013) was found to be
largely uncorrelated with tremor severity, except in
patient H where correlation was positive for both
extensor and flexor muscles. Note that the higher the
PNR, the more accurate the decomposition and that
MUs with PNR > 30 dB typically exhibit sensitivity
in the identification of their discharges greater than
90% (Holobar et al., 2013).
The second measure of decomposition
performance was SIR as defined in Eq. (1). SIR
measures the relative proportion of signal energy
that is accounted for by identified MUs and typically
ranges between 20 % and 50 % in healthy subjects
(Holobar et al., 2010). The values measured in ET
patients are in perfect agreement with these values.
No negative impact of pathological tremor on SIR
was observed. On the contrary, as demonstrated by
results in Figures 3 and 4 and Table 2, the SIR was
mostly positively correlated with the tremor
intensity as measured by RP
BF
i.e. the relative power
of rectified surface EMG at basic tremor frequency.
Not surprisingly, the SIR was also positively
correlated with the number of identified MUs (Table
2).
Detailed analysis of MU discharge patterns in
each tremor cycle revealed weak but consistent
positive correlations between the number of MUs
discharges and MU synchronisation and tremor
amplitudes as measured by inertial sensors. The
observed weakness of correlation can be contributed
to many different factors. First, the inertial sensors
measure the net mechanical oscillations contributed
by many different muscles. In our case, not all the
muscles of wrist were measured, hindering the full
interpretation of the mechanical oscillations with the
introduced electrophysiological variables. Second,
relatively simple and crude metrics of MU
synchronization and neural drive to the muscle were
used in this study, preferring, for example, the time
resolution over the accurate estimation of MU
synchronization. Third, we did not quantify the
extent of out-of-phase flexor-extensor activity
depicted in Figure 5. All this factors likely
contributed to conservative estimation of relation
between the observed MU discharge properties and
kinetic tremor properties and need to be addressed in
the future work.
In conclusion, the impact of tremor severity on
surface EMG decomposition has been systematically
assessed on eight ET patients. As demonstrated by
the results, the CKC decomposition not only fully
copes with severe tremor but also improves its
performance in sense of percentage of identified
signal energy and the number of identified motor
units. This makes it an appealing novel tool for non-
invasive and long-term tracking and physiological
interpretation of pathological tremor.
ACKNOWLEDGEMENTS
This study was supported by the Commission of the
European Union, within Framework 7, under Grant
Agreement number ICT-2011.5.1-287739
"NeuroTREMOR: A novel concept for support to
diagnosis and remote management of tremor".
REFERENCES
Benito-León, J., Louis, E. D., 2006. Essential tremor:
emerging views of a common disorder. In Nature
Clinical Practice Neurology 2. pp. 666-678.
Christakos, C. N., Erimaki, S., Anagnostou, E.,
Anastasopoulos, D., 2009. Tremor-related motor unit
firing in Parkinson’s disease: implications for tremor
genesis. In J Physiol. vol. 587. pp. 4811-4827.
Das Gupta, A., 1963 Paired response of motor units during
voluntary contraction in Parkinsonism. In J Neurol
Neurosurg Psychiatry. vol. 26(3). pp. 265–268.
Dengler, R., Wolf, W., Schubert, M., Struppler, A., 1986
Discharge pattern of single motor units in basal
ganglia disorders. In Neurology. vol 36(8). pp. 1061-
1066.
Deuschl, G., Lauk, M., Timmer, J., 1995. Tremor
classification and tremor time series analysis. In
Chaos. vol. 5. pp. 48–51.
Dietz, V., Hillesheimer, W., Freund, H. J., 1974.
OntheImpactofPathologicalTremorIntensityonNoninvasiveCharacterizationofMotorUnitDischargeProperties
131

Correlation between tremor, voluntary contraction,
and firing pattern of motor units in Parkinson's
disease. In J Neurol Neurosurg Psychiatry. vol. 37(8).
pp. 927–937.
Farina, D., Holobar, A., Merletti, R., Enoka R.M., 2010
Decoding the neural drive to muscles from the surface
electromyogram. In Clin Neurophysiol. vol. 121. pp.
1616–1623.
Farina, D., Negro, F., Gazzoni, M., Enoka, R.M., 2008
Detecting the unique representation of motor-unit
action potentials in the surface electromyogram. In J.
Neurophysiol. vol. 100. pp. 1223–1233.
Gross, J., Kujala, J., Hamalainen, M., Timmermann, L.,
Schnitzler, A., Salmelin, R., 2001. Dynamic imaging
of coherent sources: Studying neural interactions in
the human brain. In Proc. Natl. Acad. Sci. USA 98. pp.
694-699.
Groznik, V. , Guid, M., Sadikov, A., Možina, M.,
Georgiev, D., Kragelj, V., Ribarič, S., Pirtošek, Z.,
Bratko, I., 2013. Elicitation of neurological knowledge
with argument-based machine learning. In Artificial
Intelligence in Medicine. vol. 57(2). pp. 133-44.
Halliday, D. M., Rosenberg, J. R., Amjad, A. M., Breeze,
P., Conway, B. A., Farmer, S. F., 1995. A framework
for the analysis of mixed time series/point process data
- theory and application to the study of physiological
tremor, single motor unit discharges and
electromyograms. In Prog Biophys Mol Biol. vol.
64, no. 2/3, pp. 237-278.
Holobar, A., Glaser, V., Gallego, J.A., Dideriksen, J.L.,
Farina, D., 2012. Non-invasive characterization of
motor unit behaviour in pathological tremor. In J
Neural Eng. vol. 9.
Holobar, A., Minetto, M. A., Botter, A., Negro, F., Farina
D., 2010. Experimental analysis of accuracy in the
identification of motor unit spike trains from high-
density surface EMG. In IEEE trans. neural syst.
rehabil. eng.vol. 18. no. 3. pp. 221-229.
Holobar, A., Minetto, M. A., Farina, D., 2013. A signal-
based approach for assessing the accuracy of high-
density surface EMG decomposition. Submitted to 6th
International IEEE/EMBS Conference on Neural
Engineering 2013.
Muthuraman, M., Heute, U., Arning, K., Anwar, A.R.,
Elble, R., Deuschl, G., Raethjen, J., 2012. Oscillating
central motor networks in pathological tremors and
voluntary movements. What makes the difference?. In
NeuroImage. vol. 60. pp. 1331–1339.
Muthuraman, M., Hossen, A., Heute, U., Deuschl, G.,
Raethjen, J., 2011. A New Diagnostic Test to
Distinguish Tremulous Parkinson’s Disease from
Advanced Essential Tremor. In Movement Disorders.
vol. 26. no. 8. pp. 1548-1552.
Raethjen, J., Govindan, R.B., Muthuraman, M., Kopper,
F., Volkmann, J., Deuschl, G., 2009. Cortical
correlates of the basic and first harmonic frequency of
Parkinsonian tremor. In Clin Neurophysiol. vol. 120.
pp.1866–1872.
Rocon, E., Andrade, A.O., Pons, J. L., Kyberd, P., Nasuto,
S. J., 2006. Empirical mode decomposition: a novel
technique for the study of tremor time series. In Med.
Biol. Engineering and Computing. vol. 44(7). pp. 569-
582 .
Saunders-Pullman, R., Derby, C., Stanley, K., Floyd, A.,
Bressman, S., Lipton, R.B., Deligtisch, A., Severt, L.,
Yu, Q., Kurtis, M., Pullman, S.L., 2008. Validity of
spiral analysis in early Parkinson's disease, In Mov
Disord. vol. (4). pp. 531-537.
Scheltera, B., Timmer, J., Eichler, M., 2009. Assessing the
strength of directed influences among neural signals
using renormalized partial directed coherence. In
Journal of Neuroscience Methods. vol. 179 (1). pp.
121–130.
Wu, Z., Huang, N.E., 2009. Ensemble Empirical Mode
Decomposition: a Noise-assisted Data Analysis
Method. In Adv Adapt Data Anal. vol. 1. pp. 1–41.
NEUROTECHNIX2013-InternationalCongressonNeurotechnology,ElectronicsandInformatics
132
