
Effect of Stimulus Size and Shape on Steady-State Visually Evoked
Potentials for Brain-Computer Interface Optimization
Wenjie Zheng, François-Benoît Vialatte, Parvaneh Adibpour, Chen Chen,
Antoine Gaume and Gérard Dreyfus
SIGnal Processing and MAchine Learning (SIGMA) laboratory, École Supérieure de Physique et de Chimie
Industrielles de la ville de Paris (ESPCI ParisTech),75005 Paris, France
Keyword: SSVEP, Stimulus, Size, Shape, Checkerboards, BCI.
Abstract: Steady-state visually evoked potentials (SSVEP) can be elicited by a large variety of stimuli. To the best of
our knowledge, the size and shape effect of stimuli has never been investigated in the literature. We study
the relationship between the visual parameters (size and shape) of the stimulation and the resulting brain
response. A tentative physiological interpretation is proposed and the potential of the effect in a Brain-
Computer Interface is outlined.
1 INTRODUCTION
A Brain-Computer Interface (BCI) allows a direct
communication of an individual to a computer
through direct measurements of brain electrical
activity (Nicolelis et al., 2000). Since Hans Berger
recorded the first electroencephalogram (EEG) from
the human scalp and discovered the brain alpha
waves (neural oscillations in frequency range of 8-
12 Hz, Berger 1929), EEG has become a major
noninvasive technique for studying brain activity. It
is believed that EEG is mostly reflecting the
synaptic activity that occurs in the superficial layers
of the cortex.
Sensory evoked potentials are electrical
responses of the brain (usually EEG) elicited by
sensory stimulation. They can be recorded from the
central nervous system of humans or animals while
visual, somatosensory, or auditory modalities are
stimulated (Dawson, 1954) ; they are distinct from
spontaneous potentials (background EEG), that can
be recorded without stimulation (Vialatte et al.,
2010). Steady-state visual evoked potentials (SSVEP)
are signals that are responses to a visual stimulation
at a constant frequency. The Fourier spectrum of the
EEG signal exhibits characteristic SSVEP peaks that
are stable over time. SSVEP signals have a better
signal-to-noise ratio than other visual evoked
potentials, so that they are good candidates for
applications in brain-computer interface systems
(Vialatte et al., 2010). SSVEP are measured in the
human visual cortex when the retina is exposed to a
flickering visual stimulus that, in our experiments, is
a computer-generated image that flickers at constant
frequency. EEG electrodes located above the
occipital lobe (where the visual cortex is located)
record the brain response.
The limits and properties of SSVEP are not
completely known. A better understanding of these
properties would allow better designs for SSVEP-
based BCI systems. In a previous investigation, we
had for instance challenged the lower limits of
SSVEP (Vialatte et al., 2008). In the present
manuscript, we investigate the effect of the visual
stimulus size and shape on the fundamental and
higher harmonics of the SSVEP response. In
addition, we investigate the possibility of using
visual stimuli with that elicit common harmonics as
SSVEP commands.
2 METHOD
2.1 Subjects
We recorded EEG signals from 13 young adults
(ages 20-26, 11 males and 2 females). All subjects
were healthy with normal or corrected-to-normal
vision. They had no history of brain disorder or
anomaly.
574
Zheng W., Vialatte F., Adibpour P., Chen C., Gaume A. and Dreyfus G..
Effect of Stimulus Size and Shape on Steady-State Visually Evoked Potentials for Brain-Computer Interface Optimization.
DOI: 10.5220/0004667705740577
In Proceedings of the 5th International Joint Conference on Computational Intelligence (SSCN-2013), pages 574-577
ISBN: 978-989-8565-77-8
Copyright
c
2013 SCITEPRESS (Science and Technology Publications, Lda.)
2.2 Stimulus Design
The source of the stimulus was a Samsung
S23A750D LED screen with 120Hz input and
display refresh rate, with 250 cd/m² luminous
intensity. Subjects were placed at ~1 m from the
screen, sitting in a relaxed position. During the
experiments, a succession of flickering images is
presented to the subjects. Five different stimulus
sizes and five different stimulus shapes were tested.
This display was realised using Cogent Graphics
developed by John Romaya at the LON at the
Wellcome Department of Imaging Neuroscience,
and using Hovagim Bakardjian’s BCI-SSVEP-LCD
toolbox.
2.3 EEG Recording
EEG was recorded using an Acticap system with 16
active channels connected to a V-Amp amplifier
from Brain Products. Signals were filtered with a
band-pass filter (0.5-100 Hz) and a notch filter at 50
Hz, and sampled at 500 Hz. The EEG signals were
recorded from 4 channels located above the visual
cortex (PO
3
, PO
4
, O
1
, and O2 in the 10-20
international system).
2.4 Effect of Stimulus Size
We used a flickering black and white rectangle as
visual stimulus to test the effect of size on SSVEP
responses. Responses to stimuli of five different
sizes were studied: 50-by-50 pixels (1.4-by-1.4 cm²)
to 250-by-250 pixels (7 x 7 cm²) by steps of 50
pixels.
All different sizes were tested with two
flickering frequencies: 15Hz and 30Hz, resulting in
ten different stimulus conditions.
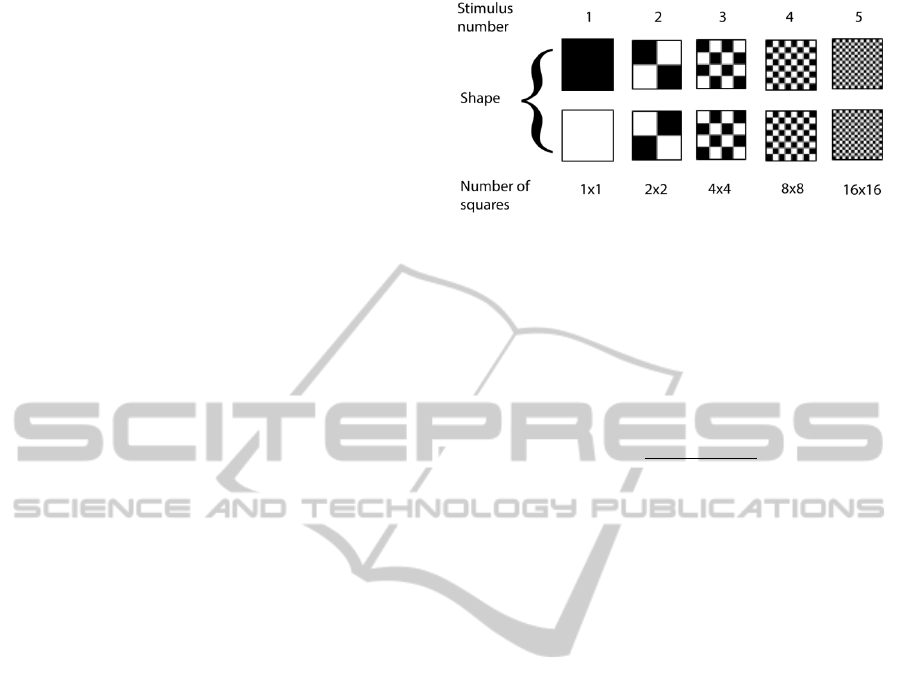
2.5 Effect of Stimulus Shape
The effect of the five different checkerboard shapes
shown on Figure 1 was investigated. The
checkerboard size was 250 x 250 pixels, divided into
2
2n
squares, with n = 0, 1, …, 4.. As in the previous
case, two flickering frequencies (15Hz and 30Hz)
were investigated.
The subjects were presented with all 18
conditions in a randomized order, during one min for
each condition. The total recording time was
approximately 30 min.
The total duration of the experiment was about
one hour, including the installation of the EEG
electrodes.
Figure 1: Illustration of the five different stimuli used to
test the effect of shape.
2.6 Signal Processing
The discrete Fourier transforms of the signals were
computed, and the signal-to-noise ratios (SNR) were
estimated as:
SNR
argmax
〈
〉
Where
is an interval of ±0.1Hz in the Fourier
domain around the stimulus frequency,
is an
interval of ±0.5Hz around the stimulus frequency
excluding interval
, and
〈
⋅
〉
stands for the average.
The SSVEP peaks may not appear exactly at the
stimulation frequency due to hardware limits.
Consequently we use the interval
to find the
maximum peak nearby the stimulus frequency. SNR
is actually a way to enhance SSVEP peaks (Thorey
et al., 2012, Wang et al. 2006): it computes the ratio
of the SSVEP peak amplitude to the average Fourier
power of the background EEG.
Statistical analysis was performed using
multiway analysis of variance (ANOVA). Normality
of the data was controlled using a Lilliefors test.
3 RESULTS AND DISCUSSION
3.1 Effect of Stimulus Size
As expected, the response and the signal-to-noise
ratio decrease significantly with stimulus size, for
stimuli at 15 Hz as well as stimuli at 30 Hz.
Nevertheless, SNR with a median value above 10
can still be observed for a size of 100-by-100 pixels.
This size effect is illustrated in Figure 2 and Figure 3.
EffectofStimulusSizeandShapeonSteady-StateVisuallyEvokedPotentialsforBrain-ComputerInterfaceOptimization
575
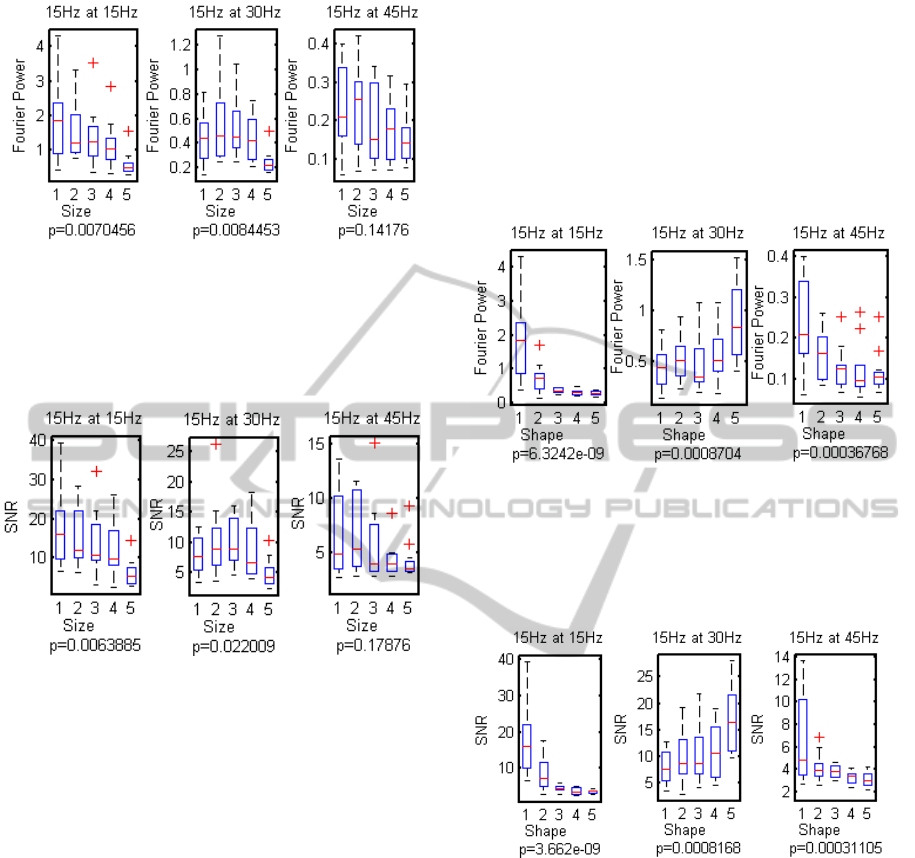
Figure 2: Boxplots of the Fourier power of the response to
a 15Hz stimulus (fundamental at 15 Hz, and harmonics at
30 and 45 Hz) vs. stimulus size. “p" is the ANOVA p-
value (p<0.05 indicates a significant difference between
the means of the observed Fourier powers). Red crosses
indicate outliers.
Figure 3: Boxplots of the SNR of the response to a 15Hz
stimulus (fundamental at 15 Hz, and harmonics at 30 and
45 Hz) vs. stimulus size. "p" is the ANOVA p-value
(p<0.05 indicates a significant difference between the
means of the observed SNR values). Red crosses indicate
outliers.
3.2 Effect of Stimulus Shape
Figure 4 and Figure 5 show that the response
and the SNR decrease with increasing number
of checkerboard squares, but that the second
harmonic increases
. This result may be related to
the existence of two major visual pathways:
The parvo-cellular(PC) pathway, originating in
the midget retinal ganglion cells (RGCs), reacts
to the high contrast, shape, color and red/blue
information (e.g. Foxe et al. 2008). It is
assumed to correspond to tonic cells, which
generate the fundamental harmonics;
The magno-cellular (MC) pathway, originating
in the parasol RGCs. It is achromatic and reacts
to low contrast stimuli, especially moving
stimuli; it carries depth information. It is
assumed to correspond to phasic cells, which
generate the second harmonic (see for instance
McKeefry et al. 1996).
The observed second harmonic effect might be
accounted for by the fact that checkerboards with
many flickering areas stimulate preferentially the
MC pathway, while checkerboards with a small
number of flickering areas stimulate the PC pathway.
These assumptions will be substantiated by more
detailed experiments in the future.
Figure 4: Boxplots of the Fourier power of the response to
a 15Hz checkerboard stimulus (fundamental at 15 Hz, and
harmonics at 30 and 45 Hz) with the five shapes shown on
Figure 1. "p" is the ANOVA p-value (p<0.05 indicates a
significant difference between the means of the observed
Fourier powers). Red crosses indicate outliers.
Figure 5: Boxplots of the SNR of the response to a 15Hz
checkerboard stimulus (fundamental at 15 Hz, and
harmonics at 30 and 45 Hz) with the five shapes shown on
Figure 1. "p" represents the ANOVA p-value (p<0.05
indicates a significant difference between the means of the
observed SNR values). Red crosses indicate outliers.
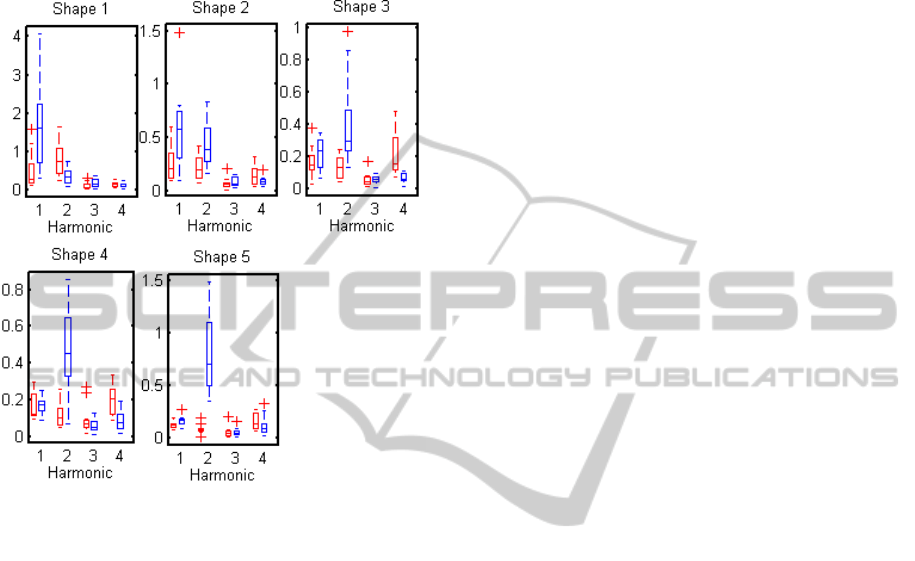
The shape effect could be useful for brain-computer
interfaces, by allowing the use of stimuli having the
same flickering frequency but different shapes: the
stimulation by a plain rectangle can be discriminated
from the stimulation by a checkerboard by the fact
that the 1
st
harmonic of the response to the former is
more powerful than its 2
nd
harmonic, while the
reverse is true in the case of a checkerboard
stimulation (Figure 6). In the design of such a BCI
system, the commands would appear as the
IJCCI2013-InternationalJointConferenceonComputationalIntelligence
576
juxtaposition of commands represented by
rectangles together with commands represented by
checkerboards, but flickering at the same frequency
(thereby potentially doubling the number of possible
commands).
Figure 6: Fourier Power of the SSVEP responses to 30Hz
and 15Hz stimuli. 1/2/3/4 denote correspondingly the
frequencies 15Hz/30Hz/45Hz/60Hz (harmonics and
subharmonics of 30Hz stimulation may be observed at 15,
30 and 60Hz; and for 15Hz stimulation at 15, 30, 45 and
60Hz). Red boxes denote the Fourier powers in response
to a 30Hz stimulus; blue boxes denote the Fourier powers
in response to a 15Hz stimulus.
4 CONCLUSIONS
In this study, we observed that different size and
different type of shape of the stimuli change the
properties of SSVEP responses. The main
observation is the fact that a flickering checkerboard
elicits responses whose 2
nd
harmonic contain more
power than the first. This effect could be useful for
increasing the number of possible commands in
SSVEP brain-computer interfaces.
5 REFERENCES
Dawson, G. D., 1954. A summation technique for the
detection of small evoked potentials. Electroenceph.
Clin. Neurophysiol.1954; 6:65-84.
Foxe, J. J., Strugstad, E. C., Sehatpour, P., Molholm, S.,
Pasieka, W., Schroeder, C.E., McCourt, M.E. 2008.
Parvocellular and magnocellular contributions to the
initial generators of the visual evoked potential: high-
density electrical map-ping of the ‘‘C1’’ component.
Brain Topogr. 21 (1), 11–21.
Herrmann, C. S., 2001. Human EEG responses to 1–100
Hz flicker: resonance phenomena in visual cortex and
their potential correlation to cognitive phenomena.
Exp. Brain Res. 137 (3–4), 346–353.
McKeefry, D. J., Russell, M. H., Murray, I. J.,
Kulikowsky, J.J. 1996. Amplitude and phase
variations of harmonic components in human
achromatic and chromatic visual evoked
potentials.Vis. Neurosci. 13, 639–653.
Nicolelis, M. A-L., Wessberg, J., Stambaugh, C. R.,
Kralik, J. D., Beck, P. D., Laubach, M., Chapin, J. K.,
Kim, J., Biggs, S. J., Srinivasan, M. A. 2000. Real-
time prediction of hand trajectory by ensembles of
cortical neurons in primates. Nature 408 (6810): 361–
5.
Regan, D., 1989. Human Brain Electrophysiology: Evoked
Potentials and Evoked Magnetic Fields in Science and
Medicine. Elsevier, New York.
Silberstein, R. B., 1995. Steady-state visually evoked
potentials, brain resonances, and cognitive
processes.Nunez, P. L. (Ed.), Neocortical Dynamics
andHuman EEG Rhythms. Oxford University Press,
Oxford, pp. 272–303.
Tanaka, K., 1996. Inferotemporal cortex and object
vision.Annu. Rev. Neurosci. 19, 109–139.
Tanaka, K., 1997. Mechanisms of visual object
recognition: monkey and human studies. Curr. Opin.
Neurobiol. 7 (4), 523–529.
Thorey, J., Adibpour, P., Tomita, Y., Gaume, A.,
Bakardjian, H., Dreyfus, G., Vialatte, F.B. 2012. Fast
BCI calibration – Comparing methods to adapt BCI
systems for new subjects. Proc. NCTA 2012,
Barcelona, Spain. IJCCI (NCTA) 2012:663-669.
Vialatte, F. B., Maurice, M., Dauwels, J., Cichocki, A.
2010. Steady-State Visually Evoked Potentials: Focus
on Essential Paradigms and Future Perspectives.
Progress in Neurobiology, 90(4):418-438.
Vialatte, F. B., Maurice, M., Dauwels, J., Cichocki, A.
Steady State Visual Evoked Potentials in the Delta
Range (0.5-5 Hz). 15th International Conference on
Neural Information Processing, ICONIP, Auckland,
New Zealand, November 25-28 2008. ICONIP 2008,
LNCS, Part I, 5506:399–406, published in 2009.
Wang, Y., Wang, R., Gao, X., Hong, B., Gao, S., 2006. A
practical VEP-based brain–computer interface. IEEE
Trans. Neural Syst. Rehabil. Eng. 14 (2), 234–239.
EffectofStimulusSizeandShapeonSteady-StateVisuallyEvokedPotentialsforBrain-ComputerInterfaceOptimization
577
