
Modelling and Validation of KPIs
Ella Roubtsova
1
and Vaughan Michell
2
1
Open University of the Netherlands, Valkensburgersweg 177, Heerlen, The Netherlands
2
Henley Business School,University of Reading, Whiteknight, Reading, RG6 6UD, U.K.
Ella.Roubtsova@ou.nl, v.a.michell@henley.reading.ac.uk
Keywords:
Key Performance Indicators, Goal Modeling, Concept Modeling, Executable Process Modeling, Validation of
Properties of Key Performance Indicators.
Abstract:
Competition for funding between organizations attracts attention to their Key Performance Indicators (KPIs).
KPIs are usually designed with a top-down approach as families of measures for a group of business units
and often do not take into account the difference in goals and business processes of organizations at the
strategic, tactical and operational level. This results in unreliable, inefficient and sometimes inconsistent
KPIs. Validation of KPI properties is typically postponed until the KPI is implemented, and databases are
populated with values. The reason is the absence of intuitive and simple methods for KPI modelling that
relate the strategic and tactical models and executable operational models. We propose such a method for KPI
modelling and validation of their properties. Our method combines ideas of goal, conceptual and executable
process modelling. Models at all levels are derived from KPI definitions. The conceptual modelling techniques
are used to relate the strategic and tactical models. The synchronous semantics of protocol modelling is used to
relate the tactical and the operational models. The executable operational and tactical models enable derivation
the KPI values, testing KPIs against the desired properties and identification of ambiguities in KPI definitions
that need to be resolved to improve KPIs.
1 INTRODUCTION
Key Performance Indicators (KPIs) are well estab-
lished measures of business performance (Parmenter,
2010). They are designed almost for any domain of
our life and there are KPI standards for many sec-
tors, including industry, medicine, education, and ser-
vices (KPIStandard, 2013; Garengo et al., 2005).
Usually the KPIs are defined by strategic and gov-
ernmental bodies for a group of organizations in a
branch in order to make the organizations compara-
ble. There is already an announcement of the Launch
of a Committee on Standards and KPIs for Brand &
Audience Campaigns in Europe (IAB Europe, 2013).
The methods of KPI design (Neely et al., 2000;
Strecker et al., 2012; Frank et al., 2009; Popova
and Sharpanskykh, 2010) include identification of the
most critical processes in the organizations of the
branch. Such generalization often leads to definitions
that use professional jargon, undefined notions and
forgotten elements of the business processes. There
is a risk of KPIs being interpreted differently in dif-
ferent organizations.
(Berler et al., 2005) note that KPIs often fail
to truly represent performance but instead highlight
problems of performance measurement. Therefore,
there is a need for a method of KPI modelling that can
adequately support the KPI definitions and localise
misleading KPIs.
Validation of KPI properties (listed, for example,
in (Peter Kueng, 2000)) is typically postponed un-
til the KPI is implemented, and databases are popu-
lated with values. The reason is the absence of intu-
itive and simple methods for KPI modelling that re-
late the strategic and tactical models and executable
operational models. Leaving validation of KPIs for
the implementation phase can result in ineffective
KPIs (Berler et al., 2005).
Therefore, there is a need for a method for vali-
dation of the underlying business process used for the
KPI definition and the KPI properties.
In this paper, we propose a method that addresses
both needs: (1) it identifies the aspects of the busi-
ness process relevant for a modelled family of KPIs
in the KPI definitions; (2) it enables validation of
the KPI properties on the abstract business process.
These useful features of our method are influenced
by the carefully chosen combination of the ideas
96
Roubtsova E. and Michell V.
Modelling and Validation of KPIs.
DOI: 10.5220/0004774400960105
In Proceedings of the Third International Symposium on Business Modeling and Software Design (BMSD 2013), pages 96-105
ISBN: 978-989-8565-56-3
Copyright
c
2013 by SCITEPRESS – Science and Technology Publications, Lda. All rights reserved

from goal (Dardenne et al., 1993), conceptual (OMG,
2003) and protocol modelling (McNeile and Simons,
2006). We explain the ideas of those methods and
show the advantages of the chosen combination for
KPI modelling.
Design of KPIs is closely related to non-functional
requirements engineering as KPIs can be used to
judge the operation of organizations (Golfarelli,
2009). It is well known that the requirements en-
gineering methods for non-functional requirements
are far from being developed (Golfarelli, 2009).
Our method contributes to methodological support of
requirements engineering of non-functional require-
ments.
Layout of the paper: Section 2 presents desired
properties of KPIs defined in literature. We explore
what those properties mean for KPI modelling and
formulate the requirements for a method for mod-
elling of KPIs and validation of their properties. Sec-
tion 3 describes our method of modelling and dis-
cusses validation of KPIs. The method is illustrated
with analysis of two families of KPIs proposed for
the programme (Improving Access to Psychological
Therapies, 2013). Section 4 presents some related
work and concludes the paper.
2 DESIRED PROPERTIES OF
KPIs AND REQUIREMENTS
FOR A METHOD FOR
MODELLING OF KPIs AND
VALIDATION OF THEIR
PROPERTIES
Kechenham and Winchell (Peter Kueng, 2000) de-
fined six desired properties separating KPIs from
other measures. These properties may be seen as
requirements for KPI engineering. We now explore
what those properties mean for KPI modelling:
1. KPIs should be in a Quantifiable Form. Quantifi-
cation means deriving a number or a conclusion
from a set of instances of selected concepts in the
models. Any KPI can be presented as a quan-
tification predicate of first-order logic (Andrews,
2002).
2. A KPI needs to be Sensitive to Change. Any vari-
ation in the KPI measure in the model should vary
with changes of predefined factors of the process
inputs and/or with changes of the states of in-
stances of selected concepts in the models.
3. A KPI should be Linear. Linearity of a KPI means
that performance changes in line with the value
of the indicator via a linear relationship. As non-
linear, e.g. power and exponentially related KPIs
exist, we change this requirement to ’the value of
a KPI must be able to be shown by a consistent
mathematical relationship in its simplest form’.
This implies that linear relationships are the best
as they are more easily tested, but that other nu-
merical relationships can be used provided the re-
lationship can be defined clearly.
4. A KPI should be Reliable. Reliability means that
the algorithms for KPI calculation should be free
from semantic errors and correctly calculate per-
formance both in routine circumstances, as well
as in unexpected circumstances. The validation
of this property demands a model of the seman-
tic concepts of the professional terminology and
a model of the relevant aspects of the underlying
business process.
5. A KPI should be Efficient.
(a) The indicators should be intuitive, unambigu-
ous and easy to understand in order to avoid
wasted effort or errors in their use and application.
This efficiency can be achieved by demonstrating
the semantics of the KPI definition on a model to
the users.
(b) A KPI must be cost-effective to produce. This
implies that a KPI should be created in the sim-
plest way from any constituent metrics or indica-
tors and that their production should use the sim-
plest possible calculations. The number of ele-
ments (e.g. numerical inputs, states from different
processes) comprising the KPI family is a mea-
sure of efficiency. If this number can be reduced,
then the KPI family is not efficient and can be im-
proved further.
6. A KPI should be Oriented to Improvement, not
to Conformance to Plans. There is a danger that
KPIs can be used to manipulate numbers instead
of showing the improvement. The improvement
oriented KPIs imply changes necessary to ensure
competitive business performance. This property
relates the KPI definitions both to strategic and
tactical goals and to the underlying business pro-
cess.
Analysis of the set of desired properties of KPIs
shows that they cannot be validated without abstract
models of the relevant aspects of the underlying busi-
ness process and the goals of the assessed organiza-
tions. The input information for modelling the under-
lying business process and the goals of the assessed
organizations should be derived from the definitions
of the KPIs and their intended use. The validation
of properties needs execution of the abstract business
Modelling and Validation of KPIs
97

model.
The method for KPI modelling and validation
should:
(1) enable understanding the KPIs and their rela-
tionships;
(2) provide intuitive models of KPIs :
(a) at the level of numerical modelling in order to test
desired properties 1,2,3;
(b) at the level of goal and conceptual modelling in
order to test desired properties 4,5,6.
3 METHOD FOR MODELLING
OF KPIs
The input of our method is a document that defines
KPIs for a branch of organizations. The KPIs are al-
ready designed, and the relevant elements of the busi-
ness process are described in the definition of KPIs
using the professional terminology.
The goal of our method is validating the assump-
tions about the relevant aspects of the underlyingbusi-
ness process and assessing the KPI properties.
3.1 Case Study
We illustrate our method with a case study of the KPIs
officially used in the programme IAPT (Improving
Access to Psychological Therapies, 2013). The goals
of this medical programme are the monitoring of the
coverage by therapies and effectiveness of therapies
for depression or anxiety disorders. It is expected that
”3.2 million people will access IAPT; 2.6 million pa-
tients will complete a course of treatment and up to
1.3 million (50% of those treated) will move to mea-
surable recovery. For common mental health condi-
tions treated in IAPT services, it is expected that a
minimum of 15% of those in need would willingly
enter treatment if available.” The indicators need to
measure a quarter on quarter improvement. The IAPT
program defines KPIs and High level indicators (HIs).
HIs are strategic indicators used to support change de-
cisions, while KPIs are at the tactical level of manage-
ment and control performance.
The program defines a family of the following in-
dicators:
KPI1: Level of Need. It presents the number of peo-
ple who have depression and/or anxiety disorders in
the general adult population. The number presenting
population is produced as a result of the Psychiatric
Morbidity Survey.
KPI2: No longer collected.
KPI3a: The number of people who have been re-
ferred for psychological therapies during the report-
ing quarter.
KPI3b: The number of active referrals who have
waited more than 28 days from referral to first treat-
ment/first therapeutic session (at the end of the report-
ing quarter).
KPI4: The number of people who have entered psy-
chological treatment, (i.e. had their first therapeutic
session) during the reported quarter is related to the
concept person.
HI1: Access Rate. It indicates the rate of people
entering treatment from those who need treatment
HI1 = KPI4/KPI1.
KPI5: The number of people completed treatment.
KPI6: The number of people moving to recovery.
This number sums up those who completed treatment,
who at initial assessment achieve ”caseness” and at
the final session did not.
KPI6a: No longer collected.
KPI6b: The number of people who have completed
treatment but were not at ”caseness” at initial assess-
ment.
HI2: Recovery Rate. It is calculated using the for-
mula HI2 = KPI6/(KPI5− KPI6b).
The indicators in this case study do not measure
the duration of operations or localized metrics of the
detailed operational process steps and so cannot be
classified as operational.
The set of indicators identifies two relevant im-
provement aspects of the business processes of the
assessed organizations, namely an aspect of access to
the treatment and the aspect of assessment of patients
and their treatment.
3.2 Method Steps
Our method of KPI modelling contains the following
steps:
1. Relating KPIs to goals of processes.
2. Conceptual modelling of the KPIs and the relevant
underlying processes.
3. Relating the KPIs to the business concepts.
4. Protocol modelling of the business concepts.
5. Deriving the KPIs from the protocol models.
6. Validating the KPI properties by using the exe-
cutable protocol model, goal and conceptual models.
1. Relating KPIs to Goals of Processes. In this
step we use ideas of the well-established group of
Goal-Oriented approaches to Requirements Engineer-
ing (GORE) (Dardenne et al., 1993; Regev and Weg-
mann, 2011). The notion of a goal is used as a partial
description of a system state being a result of an exe-
cution of the system. The authors of the GORE meth-
ods emphasize the similarity between goals, require-
Third International Symposium on Business Modeling and Software Design
98

ments and concerns and propose to combine them in a
tree structure. Goals are refined by requirements and
concerns.
Figure 1 shows three processes relevant for mod-
elling of the IAPT KPIs: (1) Survey of the Needs of
Population, (2) Psychological Therapy and (3) Pro-
gram of Improving Access to Psychological Therapies
(IAPT). Each of processes has its own goals.
The goals of the Psychological Therapy are: ”A
Referred Person has access to psychological thera-
pies” and ”A Referred Person after treatment has im-
proved conditions”. These goals are combined with
the AND operator. The Survey of the Needs of Popu-
lation has the goal ”Estimate the size of the Popula-
tion of People needed psychological treatment.”
The Program of IAPT has the goals ”Measure ac-
cess to psychological therapies” and ”Measure ef-
fectiveness of treatment”. The goals of the Program
of IAPT are related to the goals of the Psychologi-
cal Therapy. We indicate these relations in Figure 1
as ”Monitor Access” and ”Monitor Effectiveness of
treatment”.
A distinctive feature of our approach is deriving
goals of the KPI measurement and the underlying
business processes from the document with the KPI
definitions. This approach allows us to identify the as-
pects of the business process that were used in the de-
sign of the KPI definitions: Estimate the size of pop-
ulation of people needed phycological therapy; Guar-
antee that a refereed person has access to phycologi-
cal therapy; Guarantee the good chance that a refereed
person after the treatment has improved conditions.
2. Conceptual Modelling of the KPIs. As in other
GORE approaches the goals of each process are re-
fined to concepts. The conceptual modelling is a wide
variety of methods. The comparison studies conclude
that ”abstracting from their graphical form, the core
expressivity of all conceptual models proposed in lit-
erature is similar” (Golfarelli, 2009). So, we choose
the class diagram as the most used and standardized
in UML. In this step, our method has similarity with
the KAOS method (Dardenne et al., 1993).
Figure 1 shows that for modelling of each process,
we extract corresponding concepts with attributes.
The concepts are often the subjects of the process or
the result of the process. The concept Referred Per-
son corresponds to the Psychological Therapy. A Re-
ferred person is the subject of Psychological Therapy
mentioned in the goals.
The concept Survey is the result of the process
Survey of the Needs of Population.
In the search of generic concepts for modeling of
KPIs we decided to use the concept Dashboard for
each goal of the measurement process. A dashboard
in the business intelligence domain presents a collec-
tion of measures of different levels supporting a par-
ticular request. The concept Dashboard allows us to
collect the KPIs as attributes of the dashboard con-
cept.
Using this choice the Program of IAPT process
is modeled with two concepts Access Dashboard and
Recovery Dashboard. Access Dashboard corresponds
to the goal ”Measure access to psychological thera-
pies”. All the tactical and strategic measures needed
for access measurement: KPI1, KPI3a, KPI3b KPI4
and HI1, are modeled as attributes of the Access
Dashboard. Recovery Dashboard with its attributes
corresponds to the goal ”Measure effectiveness of
treatment”.
3. Relating the KPIs to the Business Concepts.
The attributes of the dashboard concepts designed for
modeling of KPIs need to be derived from the con-
cepts of the relevant business processes. From the
KPI definition, we extracted two relevant business
processes and two corresponding business concepts
for calculation of the KPIs of the IAPT program: Sur-
vey and Referred Person. Each of these concepts has
its own attributes.
Conceptual modelling forces us to think about the
attributes needed and semantics for KPI calculation.
The attributes of concepts are taken from the KPI def-
initions. For example, the definition of KPIs says that
the monitoring takes place quarterly. This implies that
the concepts of the underlying process need the at-
tributes representing the date of their appearance. The
Survey gets its attribute DateOfSurvey and Reffered
Person gets its attribute DateOfReferring.
We use also a generic attribute State and identify
its possible values from the KPI definitions. For ex-
ample, the names of the states of the life cycle of the
Referred Person: Referred, Waited 28 days, Entered
treatment and Completed treatment.
4. Protocol Modelling of the Business Concepts.
Until this point, our method just extended the domain
of application of GORE methods (such as KAOS) to
modelling of KPIs.
From this point, our method becomes semanti-
cally different from other GORE methods. We intro-
duce an intermediate step, namely modelling all the
concepts as protocol machines.
The GORE models use activity diagrams or UML
state machines for modelling of concepts. Activity di-
agrams and UML state machines have asynchronous
semantics (McNeile and Roubtsova, 2010). The in-
teraction of concepts is initialized by sending a mes-
Modelling and Validation of KPIs
99
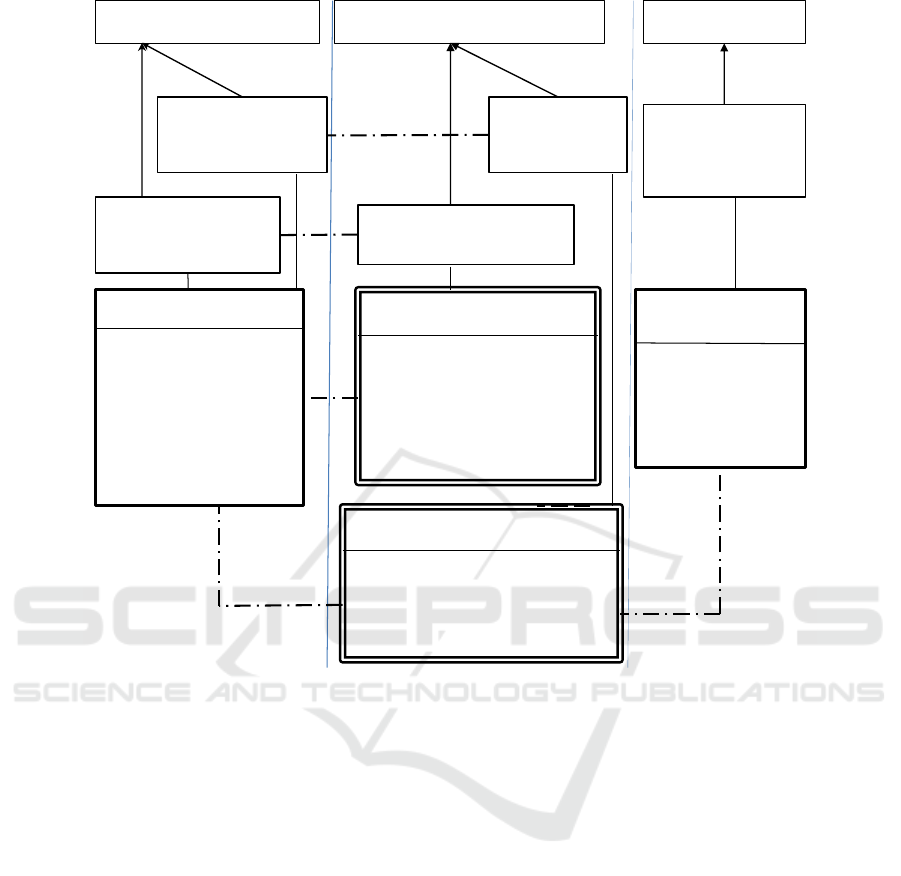
Goal
A Referred Person after
treatment has improved
conditions
AND
Goal
A Referred Person has
access to psychological
therapies
Psychological Therapy
Program of Improving Access to
Psychological Therapies
AND
Goal
Measure access to
psychological
therapies
Goal
Measure effectiveness of
treatment
<<Monitor access>
Concept
Access Dashboard
Attributes
KPI1:Number of people with disorder
identified by the annual survey
KPI4:Number of people with disorder who in
the entered treatment
HI1: Access Rate
Concept
Recovery Dashboard
Attributes
KPI5: Number of people completed
treatment
KPI6: Number of people moving to
recovery
KPI6b: Number of people not at
caseness before treatment
HI2:RecoveryRate
Concept
Referred Person
Attributes
Name: String
Date of Referring: Date
Caseness Before Treatment:
Boolean
Caseness After Treatment:
Boolean
State: {Referred, Waited 28 days,
Entered treatment, Completed
treatment}
Survey of the Needs
of Population
Goal
Estimate the size of the
Population r of people
needed psychological
therapy
Concept
Survey
Attributes
Date of Survey: Date
Population of people
with disorder: Integer
<<Monitor effectiveness of treatment
<<Derive>>
<<Derive>>
<<Derive>>
Figure 1: Goals and Concepts.
sage or by calling a method. These models suit for
modelling of system implementation. Asynchronous
interactions create many intermediate states that are
not justified by the goals of the system (Gossler and
Sifakis, 2003). Analysis of intermediate states may
be relevant for validation of asynchronous implemen-
tation, but the KPIs are situated at the tactical and
strategic level, at the level of visible states of the sys-
tem.
We have chosen the protocol machines for the
following reasons:
- Firstly, we want to minimize complexity of semantic
modelling of business concepts. Protocol modelling
uses a data-extended synchronous CSP-parallel com-
position (McNeile and Simons, 2006).CSP stands
for Communicating Sequential Processes. The initial
form of this composition operator was proposed
in (Hoare, 1985). The initial operator was extended
for machines with data by (McNeile and Simons,
2006). Because of the synchronous composition of
its parts a protocol model presents only quiescent
states of the system. This allows us to model only
visible state and essentially decrease the state space
of the model. All states can be justified by the system
goals and subgoals. Modelling and reasoning can be
focused on the business semantics.
- Secondly, we need to model KPIs that count
entities in a specified state. The semantics of derived
states is needed for KPI modelling as KPIs must
reflect the state of business processes from which
the measurements are obtained to drive the KPIs.
Activity diagrams and UML state machines do not
have semantics allowing one concept to derive its
states from the state of other concepts (OMG, 2003).
- Thirdly, we should be able to model crosscutting
sub-processes as KPIs may collect information from
different elements of the system. Crosscutting sub-
processes are repeated parts of a business process that
cannot be decomposed using hierarchy or sequential
decomposition. Activity diagrams and UML state
machines cannot easily specify the crosscutting
sub-processes as the composition techniques of
the diagrams are restricted with sequential and
hierarchical composition (Gossler and Sifakis, 2003).
Separating crosscutting sub-processes can be used
for efficient modelling of KPIs. Combining different
Third International Symposium on Business Modeling and Software Design
100

measures at different abstraction level presented with
crosscutting parts simplifies the KPI models. Proto-
col modelling supports the CSP parallel composition
of crosscutting sub-processes in the business process
that simplifies the KPI modelling.
A protocol machine is an object life-cycle model.
It is presented as a state transition structure with a data
storage that defines the ability of a system to interact
with its environment by accepting or refusing events
from the environment. A protocol machine can be
seen as an object that exists even without its creation
in its initial state. An object goes into its active state
accepting a creating event. All protocol machines are
composed with the data-extended synchronous CSP-
parallel composition.
The Protocol Model of the Program for IAPT.
Protocol machines used for modelling of KPIs are
graphically shown in Figure 2. Each concept from
Figure 1 has the corresponding protocol machine at
Figure 2 with the same name. The boxes in Figure 2
represent protocol machines, where the attributes of
concepts are shown in bubbles. The graphical pre-
sentation does not provide all the elements of the
model. The complete protocol model of the pro-
gram for IAPT is presented with its metacode and
small java functions and can be found in (Roubtsova,
2013). For instance, the metacode of an instance of
the
Survey
concept is a protocol machine
Survey
.
OBJECT Survey
NAME SurveyName
ATTRIBUTES SurveyName: String,
Population:Integer,
DateOfSurvey:Date
STATES created
TRANSITIONS @new*CreateSurvey=created
EVENT CreateSurvey
ATTRIBUTES Suvey:Survey,
SurveyName:String,
Population:Integer,
DateOfSurvey:Date
It is assumed that the survey is periodic (the pe-
riod is not given), and we add the tacit attribute to the
Survey
:
DateOfSurvey:Date
. Only the
Survey
in-
stance closest to the date of KPI monitoring is used
for KPIs calculation.
Each instance of the
Survey
is created by ac-
cepting an event
Create Survey
. Only the
Survey
in state ”
created
” can provide the values of its
attributes of the
LevelOfNeed
and
Population
for performance indicators. The acceptance of
an event
Create Survey
brings with its attribute
Population
the number of people who have depres-
sion and(or) anxiety disorders and with its attribute
DateOfSurvey
the value of the attribute of the proto-
col machine
Survey
.
By accepting or refusing this event the protocol
model communicates with the environment. This
communication is simulated in Modelscope tool sup-
porting Protocol Modelling (McNeile and Simons,
2005).
A protocol machine may also describe a part of the
life cycle of an object. The metacode is started with
the key word BEHAVIOURFor example, the concept
Refereed Person is presented as the protocol machine
Referred Person
. This protocol machine includes
behaviour
Treatment
. Both protocol machines
Referred Person
and
Treatment
are synchronized
with an event
EnterTreatmentAndAssess
. The sep-
aration of the concept
Treatment
simplifies the quan-
tification on the states of the
Referred Person
used
for KPI definition.
OBJECT ReferredPerson
NAME PersonName
INCLUDES Treatment
ATTRIBUTES PersonName: String,
DateOfReferring:Date,
STATES referred, 28DaysWaited, left,
enteredTreatmentAndInitiallyAssessed,
completedTreatmentAndAssessed
TRANSITIONS @new*Refer =referred,
referred*Decline=left,
left*Return=referred,
referred*Wait=28DaysWaited,
28DaysWaited*Leave=left,
28DaysWaited*EnterTreatmentAndAssess=
28DaysWaited
BEHAVIOUR Treatment
ATTRIBUTES CasenessBefore:Boolean,
CasenessAfter:Boolean
STATES enteredTreatmentAndInitiallyAssessed,
completedTreatmentAndAssessed,left
TRANSITIONS
@new*EnterTreatmentAndAssess
=enteredTreatmentAndInitiallyAssessed,
enteredTreatmentAndInitiallyAssessed*Leave=left,
enteredTreatmentAndInitiallyAssessed*
CompleteTreatmentAndAssess
=completedTreatmentAndAssessed
EVENT Refer
ATTRIBUTES ReferredPerson:ReferredPerson,
PersonName:String,
DateOfReferring:Date
EVENT Decline
ATTRIBUTES ReferredPerson:ReferredPerson
EVENT Return
ATTRIBUTES ReferredPerson:ReferredPerson
EVENT Wait
ATTRIBUTES ReferredPerson:ReferredPerson
EVENT Leave
Modelling and Validation of KPIs
101

ATTRIBUTES ReferredPerson:ReferredPerson
EVENT EnterTreatmentAndAssess
ATTRIBUTES ReferredPerson:ReferredPerson,
CasenessBefore:Boolean
EVENT CompleteTreatmentAndAssess
ATTRIBUTES ReferredPerson:ReferredPerson,
CasenessAfter:Boolean
Attributes of the protocol machines
Referred
Person
and
Treatment
are shown in bubbles in
Figure 2. Attributes
CasenessBefore:Boolean
and
CasenesAfter:Boolean
model the procedure
of assessment of the patient’s conditions. Each
transition is labelled with an external event. As
events are the structures that carry data, they al-
low the model to updatethe attributes in the life cy-
cle of an instance of the
Referred Person
. The
value of the
DateOfReferring
is entered with event
Refer
.
CasenessBefore
is inserted with event
EnterTreatmentAndAssess
.
CasenessAfter
is en-
tered with event
CompleteTreatmentAndAssess
.
5. Deriving the KPIs from the Protocol Models of
Concepts. An instance of a dashboard protocol ma-
chine models a KPI report request. The metacode of
the
Access Dashboard
is shown below.
OBJECT AccessDashboard
NAME DashboardName
ATTRIBUTES,
DashboardName:String,
StartOfReportingQuarter:Date,
!LevelOfNeed:Integer,
!NumberReferredPersons:Integer,
!NumberReferredPersonsWaited:Integer,
!NumberOfEnteredTreatment:Integer,
!AccessRate: Integer,
STATES created
TRANSITIONS
@new*CreateAccessDashboards=created
The protocol machines
AccessDashbord
and
RecoveryDashboard
present KPIs monitoring the
access and recovery by selecting and counting the in-
stances of the protocol machines. Derived attributes
of dashboard protocol machines marked by the ex-
clamation symbol ”!” represent individual KPIs. The
event
CreateAccessDashboard
is used to insert the
value of the starting date of the reporting quarter into
the attribute
StartOfReportingQuarter:Date
.
Each dashboard protocol machine reads the state
of protocol machines
Survey
and
Referred Person
and derives the values of own attributes presenting
KPIs.
Each derived attribute presenting a KPI has a cor-
responding derivation function. The functions are
stored in the java files extending behaviour of dash-
board protocol machines. For example, the attribute
KPI1:
LevelOfNeed
is calculated using its request
function presented below.
public class AccessDashboard extends Behaviour{
//KPI 1 Level of Need
public int getLevelOfNeed() {
int LevelOfNeed=0;
// choose the date three years ago
Calendar cal = Calendar.getInstance();
cal.add(Calendar.YEAR, -100);
Date dd = cal.getTime();
Date Dashd =
this. getDate("StartOfReportingQuarter");
Instance[] existingSurvey =
selectInState("Survey", "@any");
for
(int i = 0; i < existingSurvey.length; i++) {
Date SD=
existingSurvey[i].getDate("DateOfSurvey");
if
(SD.compareTo(dd)>0 && SD.compareTo(Dashd)<0)
{LevelOfNeed=
existingSurvey[i].getInteger("Population");
dd=SD;
}}
return LevelOfNeed;
}}
AccessDashboard
reads the state of protocol ma-
chine
Survey
(but does not change it). It finds
the Survey with the closest date and takes the value
of the
Population
of this
Survey
and assigns it
to own attribute
LevelofNeed
. The search func-
tion
selectInState("Survey", "@any")
selects
the set of surveys to choose the latest survey from this
set.
Protocol modelling has predefined select func-
tions useful for definition of tactical KPIs:
- selectInState (”BehaviourName”,”State”) returns
an array of instances, all of which include the speci-
fied behaviour;
- selectByRef(”BehaviourName”,”AttributeName”)
returns an array of instances, all of which include the
specified behaviour (or object) and have the specified
attribute.
6. Validating the KPI Properties by using the
Executable Protocol Model, Goal and Conceptual
Models. At the moment, when the KPIs are proto-
col modeled as valid numeric algorithms they can be
analyzed and tested. The algorithms for KPIs are pre-
sented in java files and implement exceptions, e.g. for
the division by zero for
Access Rate
and
Recovery
Rate
.
Third International Symposium on Business Modeling and Software Design
102
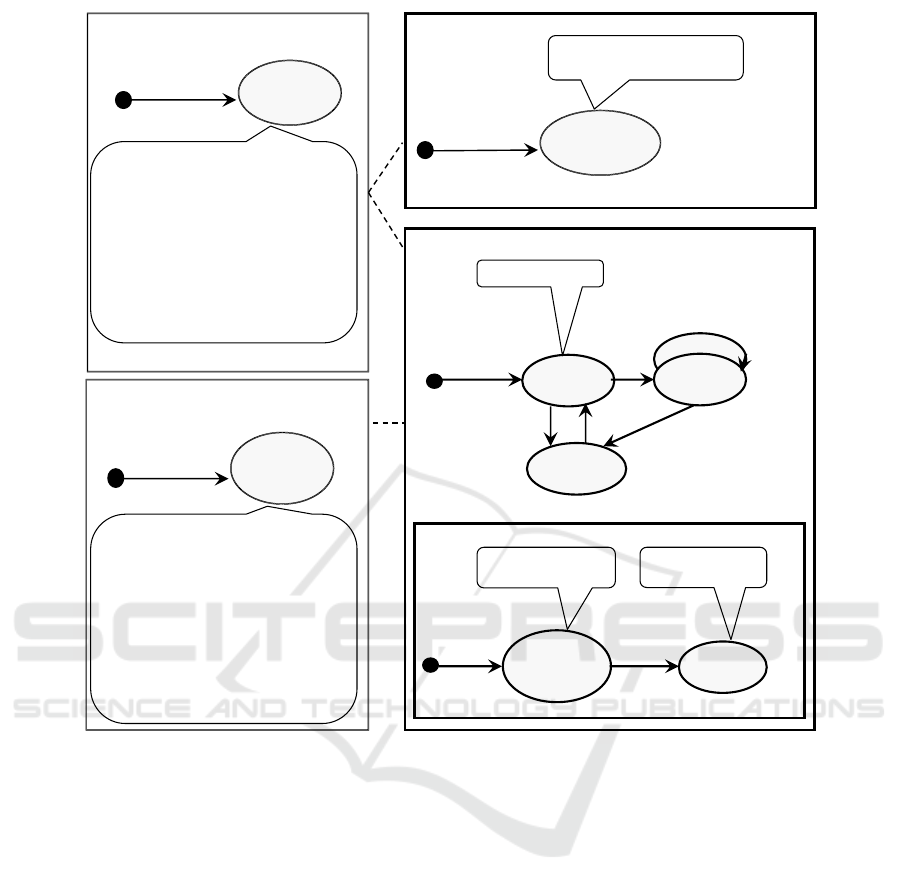
Population =Population
DateOfSyrvey=DateOFSurvey
Create Survey
(DateOfSurvey,
Population)
created
Survey
Referred Person
referred
left
Refer
(DateOf Reffering)
Decline
Return
Leave
DateOfReferring
28 days
waited
Wait
Enter
Treatment
and Assess
entered
treatment and
initially
assessed
completed
treatment and
assessed
Complete
Treatment and
Assess
(CasenessAfter)
CasenessBefore=
CasenessBefore
CasenessAfter=
Caseness,After
Enter
Treatment and Assess
(CasenessBefore)
Treatment
Create Dashboard
(start of reporting
quarter)
created
Access Dashboard
Create Dashboard
(begin of reporting
quarter)
created
Recovery Dashboard
KPI1 - Latest Survey. Population
KPI3a - Number of Referred Persons
DateOfReferring within the reported
quarter
KPI3b - Number Referred Persons in any
state except “left” DateOfReferring is
within the reporting quarter.
KPI 4 - Number Of Entered Treatment
(in state entered treatment or completed
treatment ) within the reporting quarter
HI1Access Rate=KP14/KPI1
KPI5=- Number of People Completed
Treatment (in state completed treatment)
within the reporting quarter
KPI6= Number of People Moving To
Recovery within the reporting quarter:
CasenessAfter=false.
KPI6b= Number of Caseness People
entered treatment within the reporting
quarter: CasenessBefore=false.
HI2_Recovery Rate= KPI6/(KPI5-PI6b)
Figure 2: Protocol Model of the IAPT KPIs.
Quantifiability. Quantification means deriving a
number or a conclusion from a set of instances of se-
lected concepts in the models. As we apply the select
functions for KPI derivation, this means that quantifi-
cation is already built into the KPI derivation proce-
dure.
Sensibility to the Change. In order to test the
sensitivity to change for any KPI, the protocol model
is populated with instances.
Let us assume that we want to test how
val the KPI1:Level of Need is changed when
the new instance of
Survey
appears. We cre-
ate two instances of the protocol machine
Survey
with different
DateOfSurvey
and
one instance of the
AccessDashboard
with
StartOfReportingQuarter
. We need to test
that the closest instance of the
Survey
will be
chosen to update the KPI1. We do not need to create
a database to test the KPI definition in protocol
modeling. We use only two instances of the pro-
tocol machine
Survey
needed for validation of the
sensitivity to the change of the
DateOfSurvey
.
Linearity. In order to test linearity of a KPI to
a number of instances, we need a model with N in-
stances and a model with N + 1 instances. The tests
are collected during the execution. Because the pro-
tocol model has only the quiescent states, the KPI-
attributes of the dashboard, are derived from other
protocol machines at the same moment. For exam-
ple, all KPIs of
AccessDashboard
are derived at the
StartOfReportingQuarter
.
Reliability of the Business Process used for KPI
Definitions. Execution may question semantic relia-
bility of KPIs because of incompleteness of the busi-
ness process used in the KPI definition.
For example, the procedure of testing
Caseness
is not specified in document of the IAPT (Improving
Access to Psychological Therapies, 2013). The strate-
gic HI:Recovery Rate depends on the quality of the
procedure of testing
Caseness
both before and after
Modelling and Validation of KPIs
103

treatment. The Recovery Rate is increased if more of
healthy people with assessed as ”false” will enter the
treatment. The Recovery Rate is increased if more of
sick people are wrongly assessed as ”false” will leave
the treatment. In other words, the quality of testing is
the point of attention for management of the business
process using this KPI family. In order to improve
reliability of the
HI: Recovery Rate
, the procedure
of the
Caseness
testing should be specified.
Efficiency of KPI Sets. It is more difficult to val-
idate efficiency as there are usually several different
ways to collect data from the model for a KPI calcu-
lation. The KPI is efficient in organization if it is sim-
ple and well understood. In this way, the efficiency is
related with semantic reliability.
In general, the KPIs should not duplicate each
other. As we analyse the working programme, the
duplications were already avoided. In the IAPT pro-
gramme, the KPI2 and KPI6a duplicate other KPIs.
They were found superfluous already by organiza-
tions trying to apply the set of the IAPT KPIs. The
validation could be done on the model.
Improvement Orientation of KPIs. The most
important property of KPIs is improvement orienta-
tion. There is a danger of replacing the improvement
orientation of KPIs with the plan orientation. In this
case, the KPIs may be used for manipulating num-
bers. The value of an improvement oriented KPI can-
not be manipulated in the attempt to meet its planned
value.
Our case study presents examples of both an im-
provement oriented KPI and a possibly plan oriented
KPI.
The HI AccessRate =
(NumberOfEnteredTreatment/LevelO fNeed) is an ex-
ample of the improvement oriented KPIs. It cor-
responds to the goal: ”A Referred Person has ac-
cess to psychological therapies.” The improvement
means positive growth of the ratio of treated people
to the people needing treatment. Modelling shows
that the numerator and denominator of the KPI are
objective values that grow through the model execu-
tion and cannot be manipulated in the defined pro-
cess. The
LevelOfNeed
comes from an independent
process Survey. The
NumberOfEnteredTreatment
is a summation of individually
Referred Persons
,
which are independent of the treatment providing
The HI RecoveryRate =
NumberofPeopleMovingToRecovery/
(NumberofPeopleCompletedTreatment −
NumberOfCasenessPeopleBeforeTreatment)
may become plan oriented and open to manipulations.
For validation of the improvement orientation of this
indicator, we use both the goals associated with KPIs
and the model of the underlying process.
The KPI corresponds to the goal ”A Referred
Person after treatment has improved conditions”.
The improvement corresponds to the growth of the
Recovery Rate
, but the growth may be manipulated
by the procedure of the assessment
Caseness
both
before and after treatment. If this procedure is in-
dependent of the process of treatment and well de-
fined/specified to avoid manipulations, the
Recovery
Rate
is improvement oriented. If the procedure of
Caseness
assessment belongs to the treatment pro-
cess, and this treatment process gets funding on the
basis of this KPI, then the value of
Recovery Rate
can be manipulated to meet the planned values by as-
sessing healthy people as sick before the treatment
and sending them for the treatment or by assessing
sick people as healthy after the treatment.
4 RELATED WORK AND
CONCLUSIONS
The KPI specific modelling techniques described by
(Strecker et al., 2012; Frank et al., 2009; Popova and
Sharpanskykh, 2010), are based on conceptual mod-
elling and propose metamodels for KPI design. They
are aimed to integrate the enterprise models with a
model of performance measurement systems and use
the integrated model as a basis for further analysis
at different organizational levels of abstraction. The
methods do not have means for execution of process
models and validating the properties of KPIs.
The aim of our method is different as we take a de-
signed set of KPIs as an input from a document or a
standard and then model and analyse the abstract busi-
ness process derived from this KPI set and the prop-
erties of KPIs. We relate KPIs only to the abstract
business processes derived from the KPI definitions
and therefore, simplify the analysis.
We don’t restrict our modelling techniques with
conceptual modelling. Our method combines ele-
ments of goal modelling, conceptual modelling and
protocol modelling. The need of a practical combina-
tion of these methods to validate KPI properties led
us to the choice of the synchronous protocol mod-
elling technique. As a protocol model is a combi-
nation of process model and data model, it contains
useful procedures for communication of protocol ma-
chines with data and advanced procedures for deriva-
tion of states of one protocol machine from the states
of others. These advanced protocol modelling opera-
tors are supported with the Modelscope tool (McNeile
and Simons, 2005). The model is executed and tested.
The combination of techniques proposed in this
Third International Symposium on Business Modeling and Software Design
104

paper supports the requirements for the method for
KPI modelling as it presents a) an abstraction of the
available conceptual models enabling modelling of
KPIs and understanding their relationships; b) intu-
itive models of KPIs of different levels. Our method
enables model execution and therefore, validation of
the desired properties of KPIs. The goal model and
the executable protocol model support the validation
of the properties of KPIs including semantic reliabil-
ity and improvement orientation. The validated pro-
cesses and KPIs can be used for implementation mod-
elling.
In the future work, we plan to further develop
techniques to test semantic reliability and efficiency
of a KPI and adapt our method for design and anal-
ysis of tactical, strategic and complex KPIs (Robert
Kaplan, and David Norton, 2001) used in industry.
We also plan to integrate our method with the
methods for system implementation modelling. The
models of implementation are usually asynchronous.
All asynchronous deviations of their behaviour from
the visible system behaviour presented with protocol
models should be required or accepted by users. In
such a way using protocol models may contribute to
reliability of requirements and models of implemen-
tations.
REFERENCES
Andrews, P. (2002). An Introduction to Mathematical Logic
and Type Theory: To Truth Through Proof. Berlin:
Kluwer.
Berler, A., Pavlopoulos, S., and Koutsouris, D. (2005).
Using key performance indicators as knowledge-
management tools at a regional health-care authority
level. IEEE Transactions on Information Technology
in Biomedicine, 9(2):184–192.
Dardenne, A., van Lamsweerde, A., and Fickas, S. (1993).
Goal-directed requirements acquisition. Sci. Comput.
Program., 20(1-2):3–50.
Frank, U., Heise, D., and Kattenstroth, H. (2009). Use of a
domain specific modeling language for realizing ver-
satile dashboards. In: Tolvanen JP, Rossi M, Gray
J, Sprinkle J (eds) Proceedings of the 9th OOPSLA
workshop on domain-specific modeling (DSM).
Garengo, P., Biazzo, S., and Bititci, U. S. (2005). Perfor-
mance measurement systems in SMEs: A review for
a research agenda. International Journal of Manage-
ment Reviews, 7:25–47.
Golfarelli, M. (2009). From User Requirements to Concep-
tual Design in Data Warehouse Design - a Survey. In
Data Warehousing Design and Advanced Engineering
Applications: Methods for Complex Construction. L.
Bellatreche (Ed.), pages 1–14.
Gossler, G. and Sifakis, J. (2003). Composition for Compo-
nent Based Modeling. Springer,LNCS, 2852):443–46.
Hoare, C. (1985). Communicating Sequential Processes.
Prentice-Hall International.
IAB Europe (2013). http://www.iabeurope.eu/news/launch-
of-a-committee-on-standards-and-kpis-for-brand-
and-audience-campaigns.aspx.
Improving Access to Psychological Therapies (2013).
IAPT Key Performance Indicator (KPI). Technical
Guidance for Adult IAPT Services. http://www.iapt.
nhs.uk/silo/files/iapt-kpi-technical-guidance-201213-
v20-.pdf.
KPIStandard (2013). http://kpistandard.com/html/EN/
Sectors.
McNeile, A. and Roubtsova, E. (2010). Aspect-Oriented
Development Using Protocol Modeling. LNCS 6210,
pages 115–150.
McNeile, A. and Simons, N. (2005). http://
www.metamaxim.com/.
McNeile, A. and Simons, N. (2006). Protocol Modelling.
A Modelling Approach that Supports Reusable Be-
havioural Abstractions. Software and System Model-
ing, 5(1):91–107.
Neely, A., Mills, J., Platts, K., Richards, H., Gregory, M.,
Bourne, M., and Kennerley, M. (2000). Performance
measurement system design: developing and testing a
process-based approach. International Journal of Op-
erations and Production Management, 20(10):1119 –
11452.
OMG (2003). Unified Modeling Language: Superstructure
version 2.1.1 formal/2007-02-03.
Parmenter, D. (2010). Key Performance Indicators, Devel-
oping, Implementing and Using Winning KPIs. John
Wiley & Sons, New Jersey.
Peter Kueng (2000). Process performance measurement
system - a tool to support process-based organizations.
TOTAL QUALITY MANAGEMENT, 11(1):67–85.
Popova, V. and Sharpanskykh, A. (2010). Modeling organi-
zational performance indicators. Information systems,
35(4):505–527.
Regev, G. and Wegmann, A. (2011). Revisiting Goal-
Oriented Requirements Engineering with a Regulation
View. Springer. LNBIP, 109):56–69.
Robert Kaplan, and David Norton (2001). Transforming the
Balanced Scorecard from Performance Measurement
to strategic management: Part I. Accounting Horizons,
pages 87–104.
Roubtsova, E. (2013). Protocol Model of the KPIs from
”The programme ”Improving Access to Psychological
Therapies. http://www.open.ou.nl/elr/IAPT.zip.
Strecker, S., Frank, U., Heise, D., and Kattenstroth, H.
(2012). MetricM: A modelling method in support of
the reflective design and use of performance measure-
ment systems. Springer, Information Systems and e-
Business Management, 10:241–276.
Modelling and Validation of KPIs
105
