
The Development of an Imitation Model of a Multi-tenant Database
Cluster
Evgeny Boytsov and Valery Sokolov
Department of Computer Science,Yaroslavl State University, Yaroslavl, Russia
{boytsovea, valery-sokolov}@yandex.ru
Keywords: Databases, SaaS, Multi-tenancy, Imitation Modelling.
Abstract: This paper deals with the main principles forming the foundation of an imitation model of a multi-tenant
database cluster — the concept of reliable and easy to use data storage for high load cloud applications with
thousands of customers, based on ordinary relational database servers. The main architectural principles of
cloud applications are discussed; some statistics about real multi-tenant cloud application is given. This
statistics is interpreted to detect the key characteristics of a flow of queries. Basing on this interpretation, the
architecture of the imitation model and the process of its development are described.
1 INTRODUCTION
The development of a cloud application throws a lot
of architectural challenges to software engineers.
One of such challenges is the problem of organizing
the storage of data in the cloud with the requirement
of high performance, fault-tolerance and reliable
tenants’ data isolation from each other. At the
moment these tasks are usually solved by designing
an additional layer of application logic at the level of
application servers. Such a technique is discussed in
a lot of specialized papers for application developers
and other IT-specialists (Chong et al., 2006a/b,
Candan et al., 2009). There are also some projects of
providing native multi-tenancy support at the level
of a single database server (Schiller et al., 2011).
This paper is devoted to the alternative concept of a
multi-tenant database cluster which proposes the
solution of the above problems at the level of a data
storage subsystem. In particular, the key
characteristics of the query flow are being studied
basing on the statistics of an existing multi-tenant
cloud application. The correlation between various
parameters of a tenant and its query flow are studied.
The process of the development of cluster imitation
model is described and basic principles of the model
architecture and mode of operation are highlighted.
2 THE ARCHITECTURE OF THE
MULTI-TENANT DATABASE
CLUSTER
A multi-tenant database cluster (Boytsov and Sokolov,
2012
) is a concept of data storage subsystem for
cloud applications. It is an additional layer of
abstraction over ordinary relational database servers
with a single entry point which is used to provide the
isolation of cloud application customers’ data, load-
balancing, routing of queries among servers and
fault-tolerance. The main idea is to provide an
application interface which has most in common
with the interfaces of traditional RDBMS (relational
database management system). At the moment a
typical scenario of interaction with the cluster from
the developer point of view is seen as the following:
Connect(TenantId,ReadWrite/ReadOnly);
SQL-commands
Disconnect();
A multi-tenant cluster consists of a set of
ordinary database servers and specific control and
query routing servers.
The query routing server is a new element in a
chain of interaction between application servers and
database servers. This is the component application
developers will deal with. In fact, this component of
the system is just a kind of a proxy server which
hides the details of the cluster structure, and whose
237
Boytsov E. and Sokolov V.
The Development of an Imitation Model of a Multi-tenant Database Cluster.
DOI: 10.5220/0004776002370241
In Proceedings of the Third International Symposium on Business Modeling and Software Design (BMSD 2013), pages 237-241
ISBN: 978-989-8565-56-3
Copyright
c
2013 by SCITEPRESS – Science and Technology Publications, Lda. All rights reserved
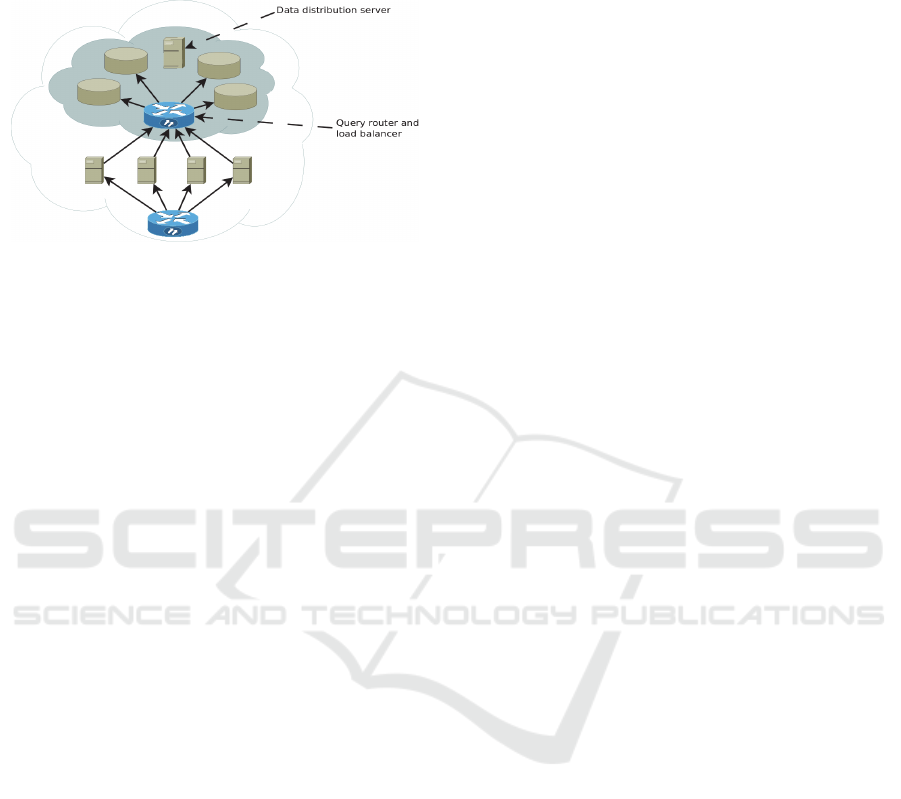
main purpose is to find an executor for a query and
route the query to him as fast as possible. It makes a
decision based on the map of a cluster.
Figure 1: Multi-tenant database cluster architecture.
It is important to note that a query routing server
has a small choice of executors for each query. If the
query implies data modification, there is no
alternative than to route it to the master database of a
tenant, because only their data modification is
permitted. If the query is read-only, it can also be
routed to a slave server, but in the general case there
would be just one or two slaves for a given master,
so even in this case the choice is very limited.
The data distribution and load balancing server is
the most important and complicated component of
the system. Its main functions are:
initial distribution of tenants data among servers
of a cluster during the system deployment or
addition of new servers or tenants;
management of tenant data distribution, based on
the collected statistics, including the creation of
additional data copies and moving data to
another server;
diagnosis of the system for the need of adding
new computing nodes and storage devices;
managing the replication.
This component of the system has the highest value
since the performance of an application depends on
the success of its work.
3 ANALYSIS OF EXISTING
APPLICATION
Analysis of existing applications and their mode of
operation is the first thing to study when designing
an imitation model. In the context of the multi-tenant
cluster theme the most interesting question is the
characteristics of the query flow, since this
component has the greatest impact on the results
obtained during the modelling. As the multi-tenant
cluster is a queuing system, the Poisson flow of
events is a good basic model of a query flow. The
key points to explore are:
1. intensity distribution of incoming query flows
among clients;
2. presence or absence of dependency between an
average time of query execution and
characteristics of the client which this query
belongs to;
3. characteristics of a customer base;
4. characteristics of customer base changes over
time.
Since questions 1 and 2 have a significant impact on
the distribution of queries between servers thus
making a decisive contribution to the assessment of
the efficiency of load balancing across the cluster as
a whole, they are very important. The answer to the
fourth question will allow us to adequately simulate
the dynamism inherent to all cloud systems and
therefore offer an effective long-term data
management strategy.
There are many factors that possibly can affect
parameters of a client query flow. At the initial stage
of the study it was decided to take the size of the
data that the client stores in the cloud as its key
characteristic. The relationship between this
parameter and the intensity of the query flow or an
average time of query execution has been studied.
The following assumptions seemed to be reasonable:
1. the most of client schemas are approximately of
the same size, but there are also significant (but
rare) variations in both directions;
2. client query flow intensity is directly dependent
on the size of client data (the greater data the
client has, the more often they are accessed);
3. the query execution time is directly dependent on
the size of client data (the greater data the client
has, the more data are accessed by the average
query, thus its execution time increases);
4. client data size and activity smoothly change
over time.
The verification of the above assumptions has been
performed on the basis of statistics and logs of the
existing multi-tenant cloud application. This
application is the online service that provides an
electronic flow of documents and accounting. The
diversity of offered services leads to the diversity of
possible scenarios of interaction between a client
and the application, thus making a complicated
query flow. The application uses Postgres SQL
server as its primary data storage. All management
stuff is performed by a set of specialized services
and routers. Currently, the cluster consists of about
Third International Symposium on Business Modeling and Software Design
238
database 60 servers and continues to grow. The
statistics being investigated is incomplete and rather
inaccurate due to the way it is collected. There is a
dedicated service that is used to collect this statistics.
It “wakes up” every 24 hours and processes logs of
all application servers within the cluster, making
conclusions about average values of key
characteristics. Since this service is only able to
analyse the entire client’s remote procedure call,
which can consist of several SQL queries, it can not
provide accurate data about the amount of queries
and their execution time. Despite this fact the
statistics allows to find out some notable trends
since the most of remote procedure calls consist of a
single SQL query.
At first, the graph of clients’ data size
distribution was built to better understand the
characteristics of the application’s user base, that
currently consists of about 40 000 clients. The most
significant part of this graph is shown in Figure 2.
Figure 2: Client data size distribution.
The values on the horizontal axis correspond to
the size of client’s database schema in megabytes.
The values on the vertical axis correspond to the
amount of clients with that data size.
Here we can see that most clients of the
application being studied (about 37000 of 40000)
have a schema with 7-8 megabytes of data. The
curve of clients data size distribution basically
corresponds to the curve of lognormal distribution
This means, that if we want to visualize dependency
between the client data size and some other
characteristics, it is better to use the logarithmic
scale.
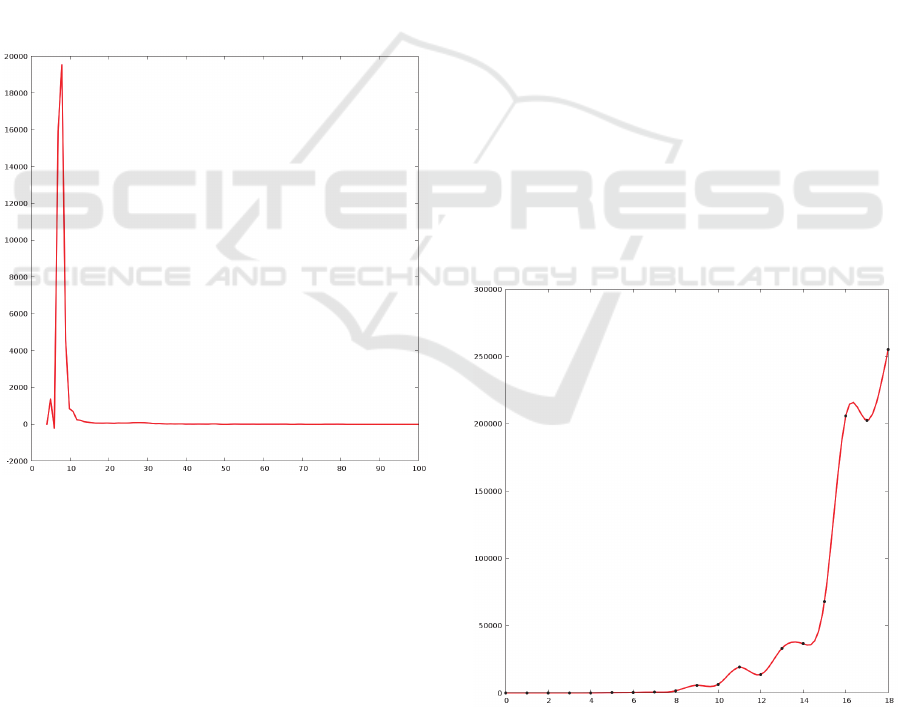
To verify the correctness of assumptions 1 and 2,
the data set containing 40 000 records with the
format (client data size, total amount of queries for a
week) was built and analysed. The graph that
visualizes this data set is given below in Figure 3.
The values on the horizontal axis correspond to the
size of client data. The horizontal axis has the
logarithmic scale and every next interval is about 1.5
times longer than the previous one. The values on
the vertical axis correspond to the average amount of
queries from clients that fall into the corresponding
interval.
The analysis of the above data set confirmed
assumptions 1 and 2 about the relationship between
the data size and the client activity: the coefficient of
correlation between the size of the client's schema
and the number of client queries is about 0.7, which
indicates a fairly strong correlation between these
two values.
At the next stage the assumption about the
dependency between the average query execution
time and the client data size was studied. Another
data set with the format (client data size, average
query execution time for the last 24 hours) with
7500 records was built to confirm or reject this
assumption. According to that data set, the
coefficient of correlation between these two values
equals to 0.03, that corresponds to a very weak
dependency or its absence. This allows to throw
away Assumption 3 as not confirmed.
Figure 3: Dependency between the data size and the
amount of queries.
The above data set also allowed to build a graph
of average query execution time distribution (Figure
The Development of an Imitation Model of a Multi-tenant Database Cluster
239
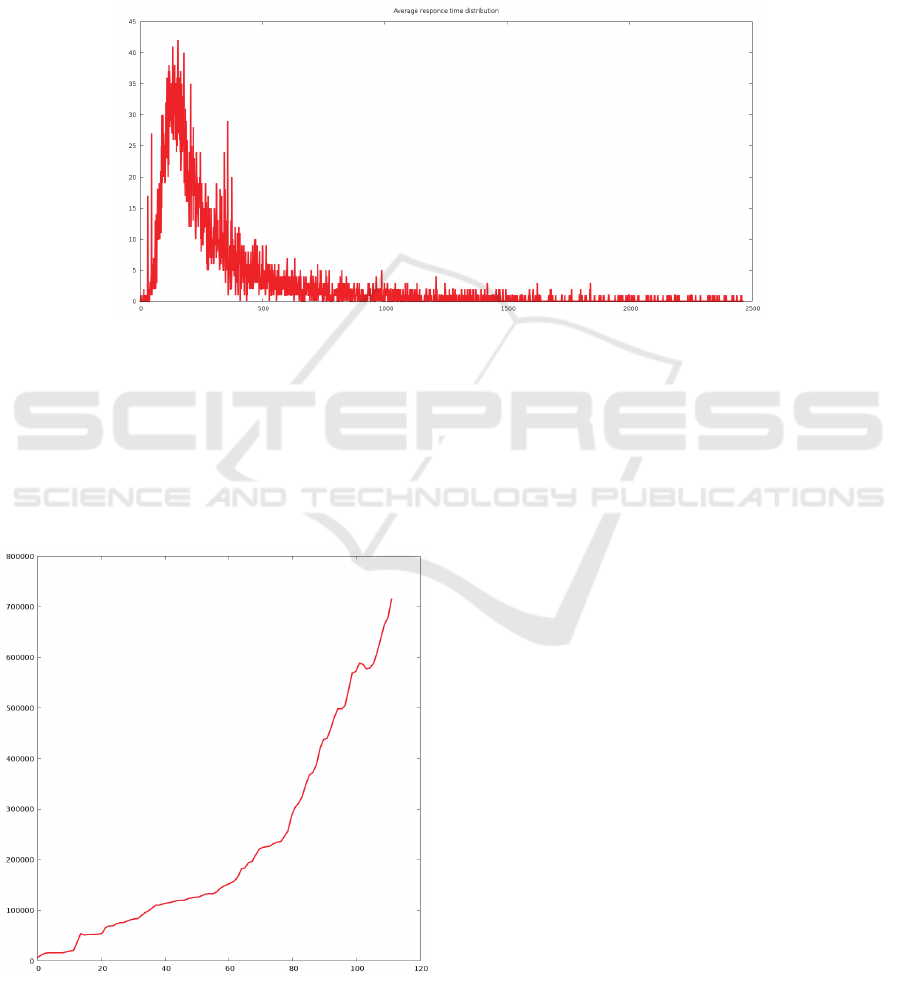
4). The values on the horizontal axis correspond to
an average query execution time in milliseconds,
and the values on the vertical axis correspond to a
number of clients with that average query execution
time. The resulting curve basically corresponds to
the curve of lognormal distribution.
Another interesting point about the cloud
application is the dynamics of users base grow.
Unfortunately, the application studied is currently
not very mature and goes through a phase of initial
accumulation of a customer base. The dynamics of
the total data size within the cluster is given in
Figure 5, where the values on the horizontal axis
correspond to a number of weeks and the values on
the vertical axis correspond to the total size of client
data in megabytes.
4 THE IMITATION MODEL OF
THE MULTI-TENANT
CLUSTER
The imitation model of the multi-tenant database
cluster has been developed according to the analysis
of the collected data. The model is a GUI application
that runs under Linux OS. It was developed using Qt
framework and C++ programming language.
The model works in virtual discrete time from
one event to another. There are the following main
entities that can produce events:
1. a query generator, including queries for creating
of new tenants;
2. database servers inside of the cluster – query
execution finish events;
3. a generator of failures – a special entity, which is
used to simulate failures of cluster components.
Models of other cluster subsystems are implemented
according to an “observer” design pattern. That
means that they are notified by the model core about
all occurring events and are able to generate
derivative events (for example, data replication
queries after finishing the execution of primary data
modification query at the client’s master server). A
data distribution algorithm, in particular, is one of
such observers that allow it to collect some statistics
and analyse cluster performance for further
optimization of its operation.
The Poisson flow of events is the basic model
used for the query generator. The flow intensity can
be set in two ways: as a static value, representing the
amount of queries per unit of model time or as a
dynamic value depending on the amount of clients
(for example, 0.05 queries per client per unit of
model time). When the generator operates in the
second mode, the total intensity of the flow is equal
to the product of the total amount of clients by the
Figure 4: Query execution time distribution.
Figure 5: Total data size dynamics.
Third International Symposium on Business Modeling and Software Design
240

value set that is it changes with a rise of the clients
base. Every new query is supplied with a weight
coefficient that affects the query execution time by
the server. According to the above statistics these
coefficients are distributed by the lognormal law and
distribution parameters can be changed during the
generator setup.
Besides, the model is able to simulate server’s
failures and a denial of service. For that purpose
there is a special entity – the failure generator. Every
server inside the cluster has a non-negative
probability of its failure per unit of model time. If
this probability is not equal to zero, then sooner or
later the server stops to serve queries for some time.
The time of server’s malfunctioning is determined
by the distribution with parameters set by the user.
This feature allows to research the cluster for fault-
tolerance.
A lot of graphical reports on the cluster operation
can be generated by the model (an average response
time for the last 100 queries, a queue size at each
server and a total queue size, a query flow
distribution between servers and so on). These
reports can be used to monitor a state of the model
and to analyse trends in operation of the cluster.
There is also a special mode of mass parallel
simulation to collect statistics about characteristics
of algorithms tested. When this mode is used, the
predefined configuration of the cluster and the
profile of query flow is tested in combination with
the offered algorithms of query routing and data
distribution. There are several special stop
conditions that are used to indicate the completion of
modelling (a period of time, a specified queue size at
any server, a specified total queue size at the level of
the entire cluster). Many identical experiments run
in parallel. A complete statistics about the state of
the cluster and the combination of the used
algorithms are stored in resulting files by the model.
5 CONCLUSIONS
Some primitive algorithms of data distribution and
query routing were developed for the model (the
balancing of data size or the amount of clients per
server). The early experiments with the model were
devoted to analysing the efficiency of these
algorithms. The study has shown that the usage of
primitive strategies sometimes leads to the formation
of query queues at some servers inside the cluster
even when the actual intensity of the flow is less
than the theoretical throughput. This effect is caused
by a burst of client activity for some period of time.
The formation of queues leads to a degradation of
application performance from the point of view of
the client whose data are stored by these servers.
The above fact means that primitive strategies
should not be used in the real production
environment. Further study will be devoted to the
model improvement and identification of key factors
that influence the efficiency of the proposed cluster
control system.
REFERENCES
Chong, F., Carraro, G. (2006a). Architecture Strategies for
Catching the Long Tail. Microsoft Corp. Website.
Chong, F., Carraro, G., Wolter, R. (2006b). Multi-Tenant
Data Architecture. Microsoft Corp. Website.
Candan, K.S., Li, W., Phan, T., Zhou, M. (2009).
Frontiers in Information and Software as Services. In
Proc. of ICDE, pages 1761-1768.
Schiller, O., Schiller, B., Brodt, A., Mitschang, B. (2011).
Native Support of Multi-tenancy in RDBMS for
Software as a Service. In Proc. of the 14th
International Conference on Extending Database
Technology.
E.A. Boytsov, V.A. Sokolov (2012). The Problem of
Creating Multi-Tenant Database Clusters. In Proc. of
SYRCoSE Conf., pages 172-177.
The Development of an Imitation Model of a Multi-tenant Database Cluster
241
