
Health Information Services using Finger Plethysmogram
Mayumi Oyama-Higa
1
, Tiejun Miao
2
and Shigeki Takada
3
1
Chaous Technology Research Lavolatory, 6-26-5 Seta, Otsu, Shiga, Japan
2
TAOS Institute Inc, 1-7-8 kaigann,Minatoku, Tokyo, Japan
3
Kwansei Gakuin University 1-1-155 Uegahara, Nishinomiya, Hyogo, Japan
mhiga@chaotech.org, info@itaos.org, takada@kwansei.ac.jp
Keywords: Vital Signs, Mental Wellness, Mental Disorders, Autonomic Nerve Balance, Pulse Chaos, Nonlinear
Dynamics, Information Complexity, Plethysmograms.
Abstract: The goal of this research is to develop a system that stores and displays visual analysis of measurements
taken from pulse waves at the fingertip so that anyone can check their mental state including past
information at any time and at any location. Furthermore, there is also the need to fully utilize the power of
digital networks so that people and the people surrounding them are aware of such mental states.
1 INTRODUCTION
Up to now, it was said that living organisms must
maintain homeostasis to maintain life. It was also
thought that living organisms are capable of
maintaining homeostasis due to the automatic
control systems of the negative feedback
mechanism. When applying vital signs that are
directly associated with our lives such as the heart
rate, respiration, blood pressure and body
temperature to the concept of homeostasis, it can be
said feedback is triggered to compensate any
disturbance that causes certain values to deviate
from their normal values, and the more stable these
values are the more efficient the control systems of
the living organism are functioning. But the
heartbeat of a healthy person, for example, is never
constant even if the person is in a relaxed state of
mind. On the contrary, it fluctuates quite irregularly
(heart rate variability). This also applies to the
respiration, blood pressure, body temperature, etc. In
fact, we know that there is less fluctuation of the
heart rate among the elderly and individuals with
medical conditions. The same can be observed in
pulse waves. For this reason, there were continuous
reports in the field of physiology around the mid-
1980’s indicating the possibility that such
fluctuations including heart rate and brain waves are
chaotic. Because no new knowledge could be gained
when using the conventional method of linear
analysis to analyze chaotic fluctuations, there was
the need to analyze chaotic fluctuations using
nonlinear methods. Recent advancements in
computer processing speed and visualization
capabilities have allowed us to analyze nonlinearly
the chaotic properties of vital signs. Such
technologies have opened new doors of
understanding concerning information that was
treated as error or simply unknown in the past to
actually contain information that we wanted to know
most.
Psychologists in the past have tried to examine
the mental state of people through trial and error by
asking a series of questions as there was no way to
read a human mind. But if accurate information can
be obtained by directly measuring vital signs and
performing nonlinear analysis, such information
should be greatly effective in the field of psychology
that relies on the rules of thumb. Those involved in
brain research conducted large-scale experiments
such as directly inserting electrodes into the brain or
taking video images based on the principle that all
information can be found in the brain. However, we
can now check with relative ease the various states
of the mind by examining the pulse waves at the
fingertip which contains information of the central
nervous system. We are now able to assess the state
of the sympathetic and parasympathetic nerves from
pulse waves taken from finger plethysmogram.
Combined with the information gained from
nonlinear analysis of pulse waves we can also obtain
other types information such as moods, etc. Such
understanding was gained through many
psychological and biological tests. In recent years,
there has been an increase in the number of suicides
245
B. Velev V., Doukovska L., Oyama-Higa M., Miao T. and Takada S.
Health Information Services using Finger Plethysmogram.
DOI: 10.5220/0004776102450252
In Proceedings of the Third International Symposium on Business Modeling and Software Design (BMSD 2013), pages 245-252
ISBN: 978-989-8565-56-3
Copyright
c
2013 by SCITEPRESS – Science and Technology Publications, Lda. All rights reserved
resulting from depression as well as people causing
social problems as the result of becoming mentally
“high.” What kind of mental state are they in? We
believe that a measurement device that allows us to
check the various mental states of ourselves would
contribute, to a certain degree, a safer and peaceful
society. We also believe the need to develop a
system so that people can check themselves in order
to handle major issues in the increasingly complex
human society such as how to rejuvenate people
mentally incapable of fitting into society in the aging
society where one in every four will be 65 years old
or older, how to detect and deal at an early stage the
bullying of children that has become a serious
problem of communal life, etc.
2 MEASUREMENT AND CHAOS
ANALYSIS OF VITAL SIGNS
2.1 Vital Signs and Chaos
From the day we are born to the day we die, we
humans continuously emit vital signs that fluctuate
dynamically. Complex fluctuations are everywhere,
including macroscopic fluctuations of life activities,
the fluctuations of the heart and blood pressure, and
the microscopic fluctuations on a molecular level.
Such fluctuations, however, are neither constant
fluctuations created mechanically nor fluctuations
that are completely random. Living organisms
fluctuate chaotically. Often times, chaos and random
are interpreted to be the same. Unlike random,
however, chaos has deterministic rules as shown in
the diagram below. There are a number of ways to
check whether a certain fluctuation is random or
chaotic. One of these methods is to draw an
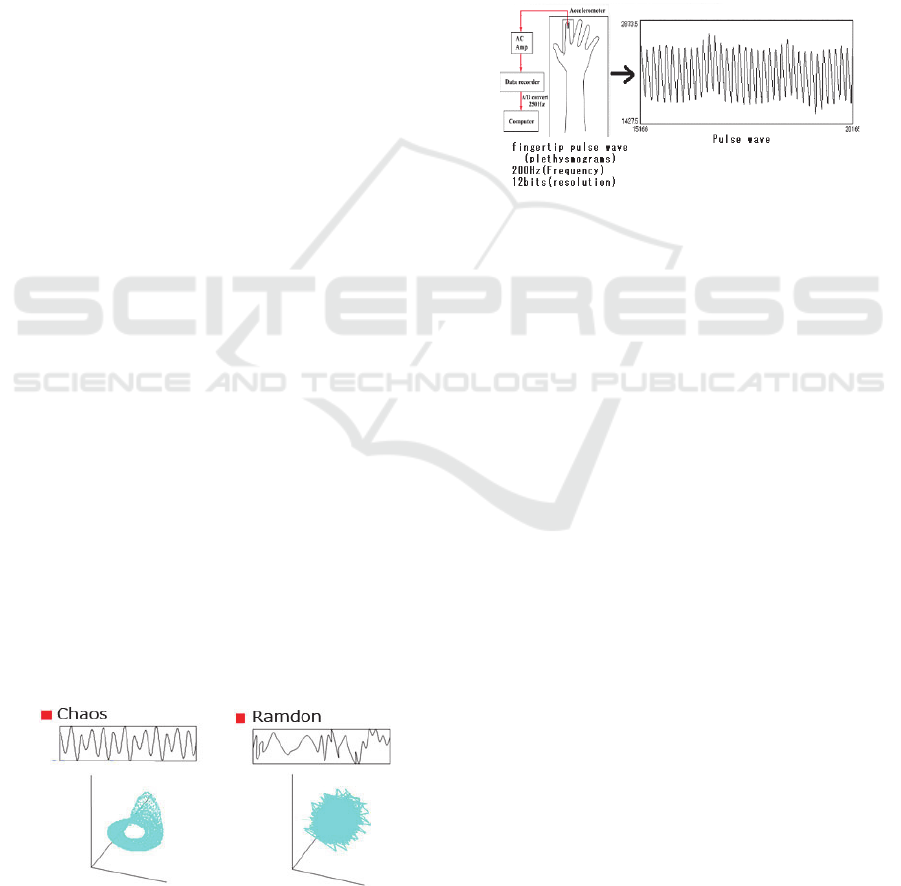
attractor. Fig. 1 shows one of the methods for
checking whether fluctuating data is random or
chaotic. In the natural world, random and chaotic
fluctuations exist outside constant, regular
fluctuations. And it has already been established that
pulse waves possess chaotic properties.
Figure 1: Difference between chaos and random shown
using an attractor.
2.2 Measuring Pulse Waves from the
Fingertip
As shown in Fig. 2, pulse waves from a finger is
taken by measuring the increase and decrease of
hemoglobin flowing through the capillaries at the
fingertip using an infrared sensor and then
converting the obtained analog information to digital
data for use in calculation. Other than a fingertip, the
sensor can also take measurements from an earlobe
or even a toe. However, the sensitivity of the left-
hand fingertip is especially suitable for measurement
to synchronize with the blood flow from the heart.
Figure 2: Measuring fingertip pulse waves.
2.3 Chaos Attractor and Analysis of
LLE (Largest Lyapunov Exponent)
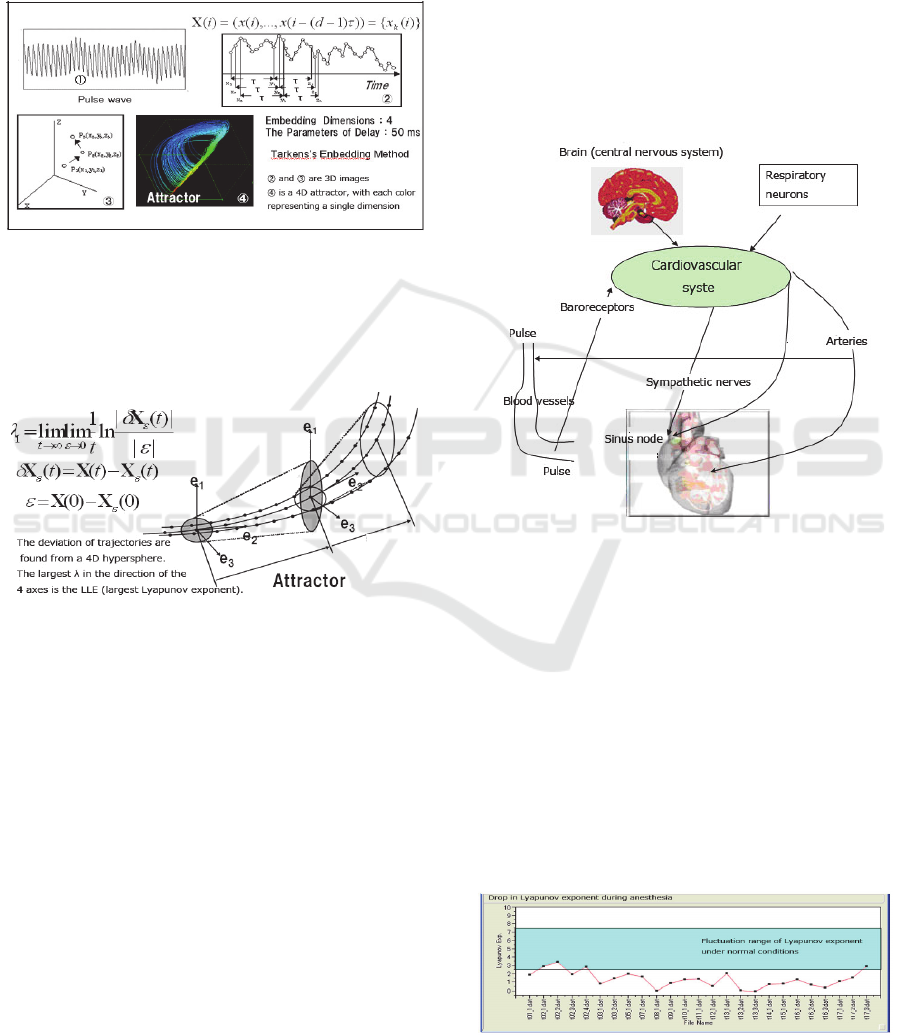
In order to create an attractor from fingertip pulse
waves (hereafter just “pulse waves”) , embedding
dimensions d and delay time (time delayed for
embedding) τ must be determined using Takens’
embedding theorem. A good attractor cannot be
drawn unless an appropriate value of τ is selected. If
τ is too small, the value before delaying time τ and
the value after delaying time τ will be almost the
same, and the values will no longer be independent
as the correlation is too strong. If τ is too large,
phase relation information is lost as there will be no
statistical correlation. Hence, there is the need to
select the optimal delay time. Delay time is
determined by continuously calculating nonlinear
average mutual information (cross-correlation
coefficient and delay time) to first find the smallest
value of τ.
Next, embedding dimensions d is found by
incrementally increasing the number of dimensions
starting from two using the G-P algorithm
(correlation dimension method) until number of
correlations within the attractor stops increasing.
The trajectories of an attractor fluctuate along with
time. Such fluctuation is referred to as the largest
Lyapunov exponent, or LLE. In our research, we
Third International Symposium on Business Modeling and Software Design
246
conducted various psychological experiments by
focusing our attention on the LLE. In order to assess
what kind of information can be obtained from LLE,
we created a mathematical model and conducted an
experiment using general anesthesia. As a result, we
were able to verify that LLE contains information of
the central nervous system.
Figure 3: Method of creating an attractor from pulse wave
data.
Fig. 4 shows the method for finding the largest
Lyapunov exponent by calculating the fluctuations
of the trajectories of an attractor over time.
Figure 4: Finding the largest Lyapunov exponent (LLE).
The LLE representing the instability of
trajectories of an attractor is found by calculating the
LLE from the attractor structured by 3,500 points,
delaying 200 points, calculating the LLE structured
by the next set of 3,500 points and repeating the
process until pulse wave data ends. 43 Lyapunov
exponents are calculated from one minute of
measurement data consisting of 12,000 points. One
LLE is calculated in the first 17 seconds and then
one every second thereafter. The average LLE found
from the total time of measurement and standard
deviation are used as assessment values in analysis.
2.4 Information That Can Be Acquired
from Pulse Waves
We have discussed that LLE gain be obtained from
nonlinear analysis of pulse waves. But there was
also the need to check what that information was
telling us. We conducted a simulation using a power
spectrum by synthesizing waves that incorporate
various conditions including blood pressure, heart
rate and respiration transmitted from multiple parts
obtained from the biological model shown in Fig. 5
and pulse waves. When running a simulation by
entering formulas for the central nervous system, we
found that the waveform of the mathematical model
resembles the waveform created in the measurement
test. This suggests that the mathematical model of
pulse waves contain information of the central
nervous system.
Figure 5: Mathematical model for simulating pulse waves.
The mathematical model was also verified in the
experiment which examined the state of LLE during
general anesthesia. If LLE contains information of
the central nervous system, there should be a drop in
the LLE when inducing general anesthesia. Fig. 6
shows the state of LLE during general anesthesia
from the start to the end of surgery of a patient
diagnosed with rectal cancer. Although the
fluctuation of LLE does not drop to zero since the
heart is moving, there is a gradual decrease in the
LLE at the start of general anesthesia. During
general anesthesia, LLE drops drastically. And upon
recovery, LLE starts to rise again.
Figure 6: Changes in LLE during general anesthesia.
Health Information Services using Finger Plethysmogram
247

We were able to verify from the mathematical
model and the general-anesthesia experiment that
pulse waves are affected by the central nervous
system.
3 RELATIONSHIP BETWEEN
LLE AND COGNITIVE
PSYCHOLOGY
Up to now, changes in the mental state of a human
mind was never assessed numerically using
biological information. Focusing on LLE obtained
from nonlinear analysis of pulse waves, we
conducted various experiments to study the
relationship between LLE and dementia of the
elderly, LLE and communication skills from view of
the ADL index, LLE and error rate during work,
LLE and daily variations of an employee as well as
the cumulative fatigue index, LLE and changes in
fluctuation over time between ages zero and five,
LLE and the effects of a mother’s affection on
children, etc. The results have allowed us to gain
understanding that LLE is closely associated with
the things we humans need to maintain a healthy
state of mind including external adaptation
capabilities regarding the environment and society,
flexibility of the mind, self-motivation and harmony.
LLE that defines the fluctuation of the trajectories of
an attractor can be defined as chaotic fluctuations. In
other words, a continuously low LLE, or prolonged
state without fluctuation, can be defined in everyday
life as a drop in the power to adapt to the outside
world. On the contrary, continuously high LLE and
large fluctuation suggest continuous extreme tension
or stress, preventing one from maintaining a healthy
mental state. For human beings, a healthy state is a
state with constant fluctuation. We also believe that
human emotions cause change in the fluctuation.
Let’s look at a healthy mental state in contrast to
physical immune strength. Normally, physical
immune strength is said to be vital to maintain
health. We human beings need physical immune
strength to maintain our health. Drop in the immune
strength can lead to various illnesses. In order to
prevent this drop in physical immune strength
(vitality), we eat carefully, rest, take medications
and exercise to build up tolerance. On the other
hand, what state defines the mind as healthy? Mental
strength, such as the ability to communicate actively,
motivation to live and the ability to tolerate the
drastic changes in the outside world, is something
extremely vital for the survival of mankind. If this is
mental immune strength (vitality), there was no way
to examine it using a scientific approach. Although
mental immune strength is related to the vitality of
human beings, it is basically a state of high or low
and strong or weak. The mental immune strength is
flexible and fluctuates constantly. A healthy state of
mind is the ability to flexibly adapt to external
changes with fluctuation. In other words, fluctuation
of the LLE over time is critical to maintain mental
health.
Fig. 7 shows an attractor of a mentally healthy
person and an attractor of a depressed patient. Notice
that the fluctuation of the attractor of the depressed
patient is extremely small. Fig. 8 shows an attractor
of a patient with dementia. Both attractors were
drawn using data taken from an elderly. It is clear
that the fluctuation decreases as the severity of
dementia increases.
Attractor of Attractor of
healthy subject depressed patient
Figure 7: Attractors of a healthy person and a
depressedpatient (30-second measurement).
Severity of dementia = 0 Severity of dementia = 4
Figure 8: Elderly data.
A continuously high state of LLE can also be
observed during daily life when exposed to extreme
tension or stress. A mentally healthy person can
naturally relax after continuous exposure to extreme
tension. This is because such person can lower the
LLE to restore the fluctuation to a natural state. A
person suffering from depression or an elderly with
advanced dementia, on the other hand, will show a
continuously low state of LLE. External adaptation
is impossible in such state. In such case, there is the
need for the person to examine his or her own
changes in the LLE, learn from past states of LLE
and allow the LLE to fluctuate by discovering
Third International Symposium on Business Modeling and Software Design
248

methods that are effective or communicating with
surrounding people. It is important to know yourself
before proceeding with hospitals and medical
treatment.
4 RELATIONSHIP BETWEEN
LLE AND MENTAL HEARTH
4.1 Analyzing the Severity of Dementia
and Communication Skills using
Chaos Analysis of Pulse Waves
Taken from the Elderly
Subjects: Measurements were taken from 179
patients (male: 40, female: 139) at three nursing
homes in Shiga Prefecture.
Measurement period: August – November 2003.
Measurement method: Three measurements of
three minutes each were taken using finger
plethysmogram. Measurements were taken while
maintaining the subjects in a relaxed state in a room
set at 25°C. Prior to the measurement of pulse
waves, the maximal blood pressure, minimal blood
pressure, pulse and body temperature were taken.
Index: The relationship with LLE calculated
from pulse waves was examined by utilizing data
indicating the severity of dementia in five stages
determined by a physician and ADL (3-level
assessment) data consisting of seven items created
by the care taker.
Results: Significant relationship was observed
between LLE and severity of dementia, as well as
between LLE and communication skills.
Figure 9: Relationship between LLE (vertical axis) and
communication skills (left graph), and between LLE and
severit of dementia (right graph). (Communication skills:
3 levels of a, b, and c; severity of dementia: 0 – 4).
The graph on the left shows significant drop in
the LLE as the level of communication skills
decreases. The graph on the right shows significant
drop in the LLE as the severity of dementia
progresses.
Fig. 10 shows the results of measurements taken
nine months following the first set of measurements.
Results varied from patients having higher LLE than
the first time to those with less LLE. From the
results, we were able to confirm that the value of
LLE fluctuates constantly. However, the patient that
passed prior to the second measurement had the
lowest LLE among the patients during the first
measurement. Is this an indication of something
significant? The results are deeply concerning.
Figure 10: Results of LLE measurements taken nine
months after.
4.2 Relationship between Changes in
LLE of Children and the Mother’s
Affection
Subjects: 242 children between zero and five years
of age at daycare centers in Osaka and Himeji.
Measurement period: January 2004 – March
2005.
Measurement method: Two measurements of a
minute each were taken using finger plethysmogram.
Measurements were taken while maintaining the
subjects in a relaxed state in a room set at 25°C.
Results: The LLE of children between zero and
five is lower at the age of three when compared to
the other ages. The results of verification show a
significant relationship with a probability of 0.05%.
Figure 11: Changes in LLE of children by age (242
children).
Health Information Services using Finger Plethysmogram
249
The diagram show that the LLE is at its highest
at the age of zero, followed by one and two, with
three having the lowest value among all ages. The
myth of the first three years has raised a question
about the age of three as a global theme. It is highly
significant that we were able to scientifically
observe the trend using the LLE taken from pulse
waves
4.3 Relationship between the Pulse
Waves of Company Employees
and the Fatigue Index
Depression among employees is becoming a social
problem. We conducted an experiment examining
the relationship between the LLE of company
employees during the day and the fatigue index.
From the fatigue index obtained through a series of
questions, we were able to conclude that the drop in
LLE was caused by “depressive state” and
“anxiety.” The results are shown in Table 1. Note
that “anxiety” and “depressive state” show a
negative correlation of -0.7 or higher when
compared to the LLE during work. In other words,
low LLE during work suggests a depressive state or
high anxiety.
Table 1: Relationship between LLE of employees during
the day and the fatigue index.
Dropin
willpower
Degreeof
anxiety
Depressive
state
Accumulation
offatigue
Lyapunov
exponentdu ring
theday
Dropinwillpower0.7235 0.7539 0.7496 ‐0. 63 85
Degreeofanxiety 0.7235 0.8455 0.9358 ‐0. 72 79
Depressivestate 0.7539 0.8455 0.842 ‐0.7279
Accumulationof
fatigue
0.7496 0.9358 0.842 ‐0. 63 05
Lyapunovex ponent
duringtheday
‐0.6385 ‐0.7279 ‐0.7014 ‐0.6305
4.4 Relationship between LLE and
Judgment and Operational Errors
during Monitoring Work
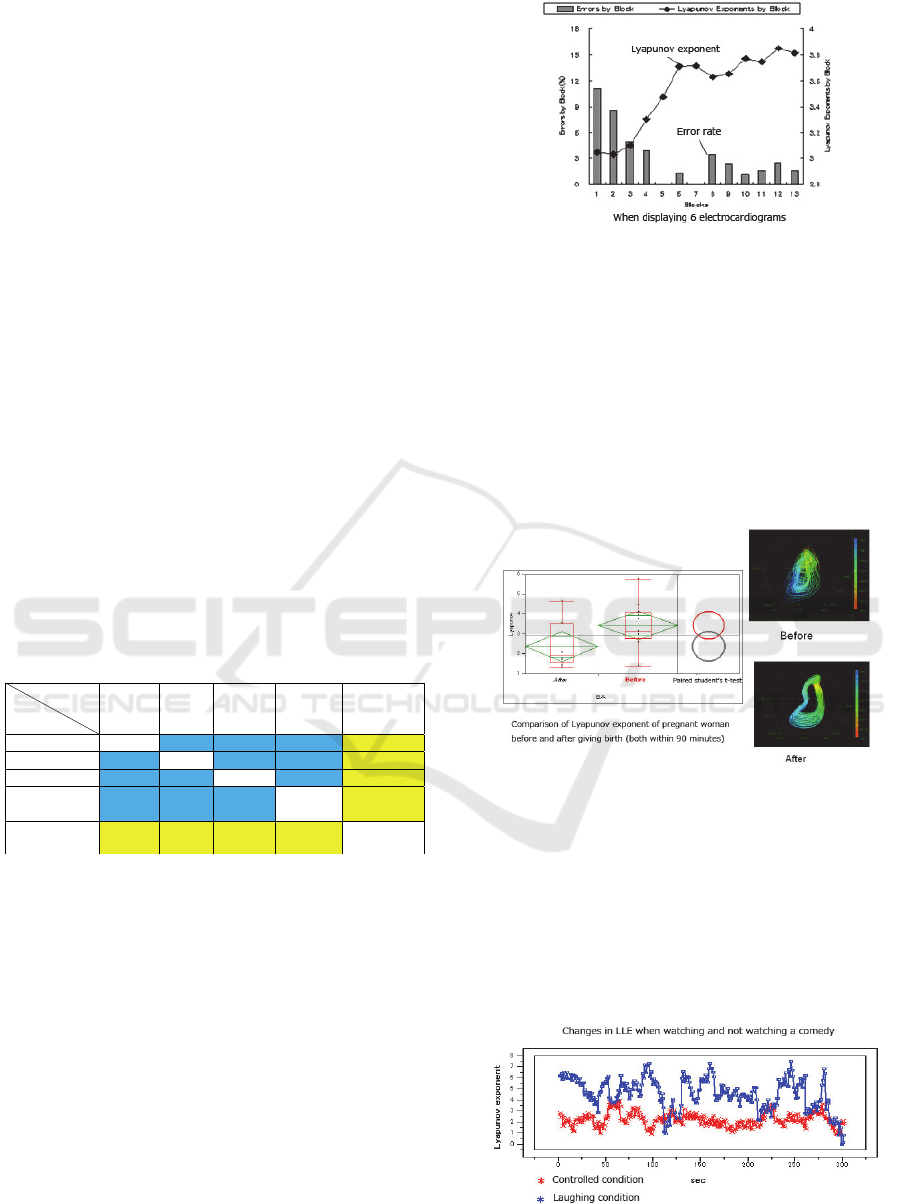
In order to conduct an experiment on human error,
we developed a device that creates a virtual
environment for performing monitoring work on a
computer. In this experiment, we examined the
relationship between LLE and the error rate. The
results showed the low LLE causes an increase in
the error rate.
Figure 12: Relationship between LLE during monitoring
work and error rate.
4.5 Changes in LLE When Giving
Birth
Fig. 13 shows the results of examining the changes
in LLE of seven pregnant women before and after
giving birth (maternity clinic in Nara-shi). The LLE
within 90 minutes of giving birth and the LLE
within 90 minutes after giving birth were compared.
The LLE prior to giving birth is significantly high
Figure 13: Comparison of LLE before and after giving
birth (both within 90 minutes).
4.6 Relationship between LLE and
Laughter
It is often said that laughter is the best medicine. The
diagram below shows the changes in LLE when
watching and not watching a comedy video for five
minutes.
Figure 14: Changes in LLE when watching and not
watching a comedy video.
Third International Symposium on Business Modeling and Software Design
250
From the various examples we have observed,
we can summarize the LLE of a mentally healthy
person as follows:
The LLE of a mentally healthy person fluctuates
constantly within a certain range. Furthermore,
the LLE changes unconsciously.
The LLE of a person suffering from depression
or dementia is continuously low.
Continuously high LLE indicates extreme
tension and stress, and at risk of losing mental
balance.
From the above, we can say that the mental state
cannot be determined with single measurement of
LLE.
5 NECESSITY OF SELF-CHECK
SYSTEM FOR MENTAL
HEALTH
5.1 Social Needs and Cautions
concerning Measurements
There are said to be more than 30,000 suicides per
year in Japan. Although depression is not the only
cause, depression is often times accompanied by an
alternating cycle between depressive state and manic
state. Severe manic state triggered by medication is
said to be a cause for suicides. We believe that
knowing your own state by measuring pulse waves
as a means of self-control can be effective in
preventing suicides.
We know that Japan is on the way to an aging
society, where one in every four persons will be 65
years old or older in 2025. Some of the issues of
aging are enormous medical costs and nursing costs
that ultimately affect the lifestyles of individuals.
What can we do to keep working energetically even
when we age, or to make sure we do not put a
burden on our family with dementia? These are all
issues that we must take seriously. Currently, we are
examining the effects that animal-assisted therapy,
music therapy and life review have on
communication and motor skills. We are also
conducting experiments on LLE to see which
methods are effective for rejuvenating the elderly.
However, methods for improving the LLE will differ
for each individual. But everyone is capable of
improving their LLE. We believe that it is up to the
individual to discover the best method.
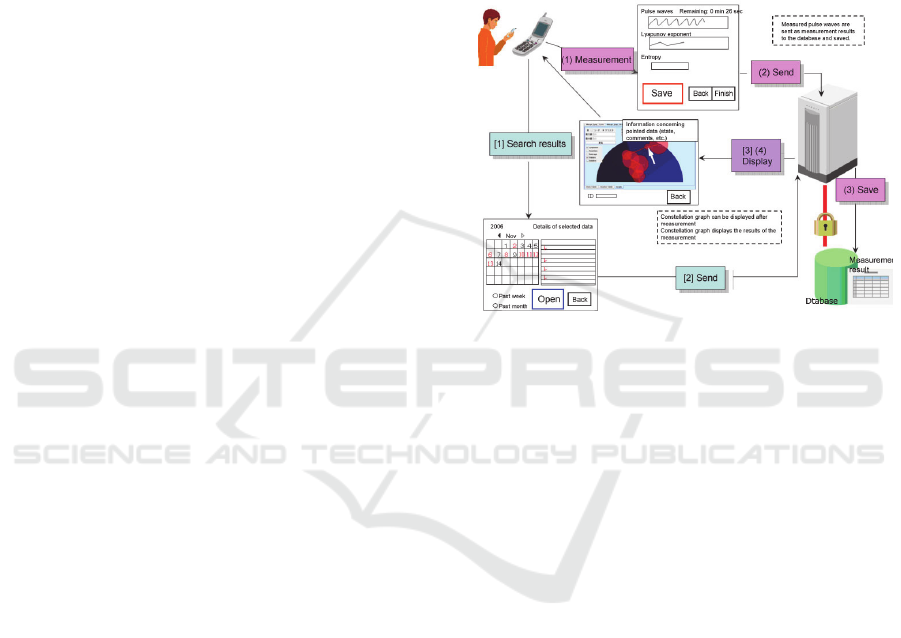
Judging from the above, we decided the need to
develop a self-check system so that anyone can
measure their LLE at any time and at any location.
We developed a software program called Lyspect
that measures not only the LLE from the pulse
waves measured at the fingertip, but the state of
sympathetic nerves, parasympathetic nerves and
autonomic nerves, and the health of blood vessels.
But in order to check past measurement records and
to check your mental state based on the feedback of
such information, there is the need for a database
and the use of the Internet.
Figure 15: Image of performing finger plethysmogram
using a cell phone or smartphone, performing nonlinear
analysis to calculate biological information such as the
LLE, and saving the data in database and loading past
records.
6 INTRODUCTION OF LYSPECT
We developed a software program capable of
calculating and displaying the following by
measuring pulse waves. Lyspect is capable of
analyzing and display the three types of values with
pulse waves as input data.
Chaos analysis (calculation of LLE), vascular
balance analysis, autonomic nerve balance analysis.
The program is also capable of displaying LLE and
HF/LF in real time by connecting a sensor.
There are two types of Lyspect: the original
Lyspect that can be used for research and
Lyspecting, a simple version of the original.
Fig. 16 shows the results of five measurements
taken from a single person using Lyspecting, the
simpler of the two.
Health Information Services using Finger Plethysmogram
251
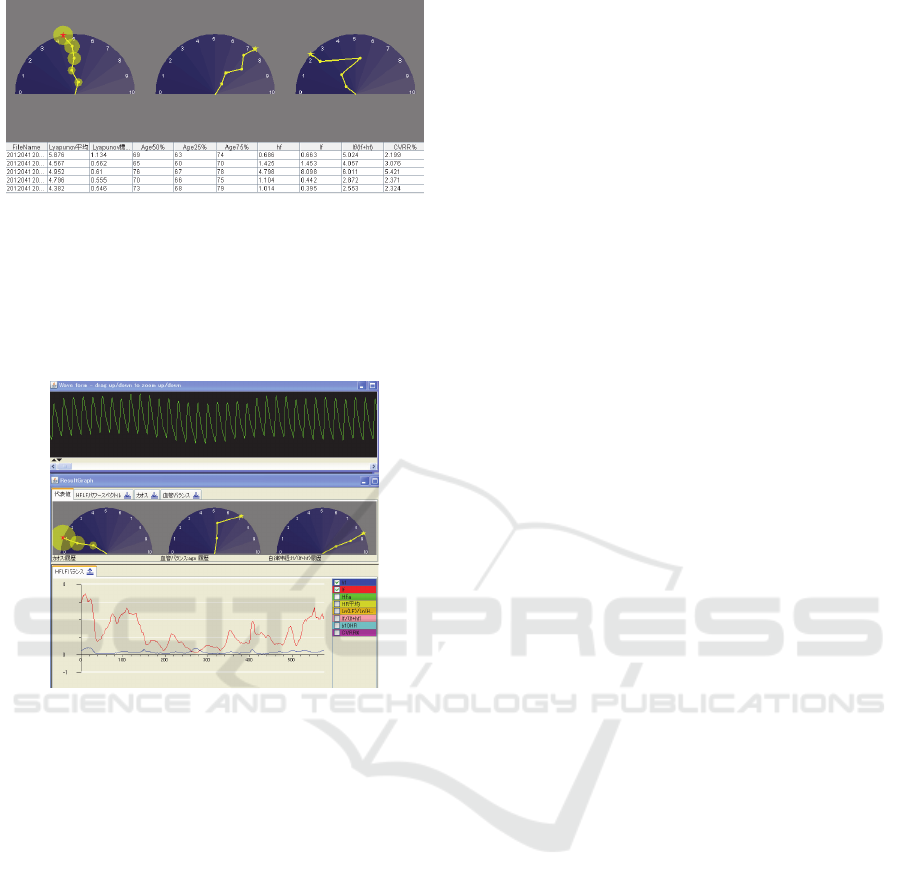
Figure 16: Results displayed by Lespecting (5
measurements).
Fig. 17 shows the results of three measurements
taken from a depressive patient. The LLE is
constantly low and the autonomic nerve balance
indicates that the sympathetic nerves are superior.
Figure 17: Results of depressive patient displayed by
Lyspect.
We have also developed a software program that
can be operated on android smartphones.
7 INTRODUCTION OF LYSPECT
We verified the deep relationship between human
emotions and LLE calculated based on nonlinear
analysis of the micro-fluctuations in pulse waves
that contain chaotic properties by creating
mathematical models and conducting experiments
using general anesthesia. We have also developed a
software program for analysis. Our challenge for the
future is to develop a pulse wave sensor that any can
easily use and afford. In order obtain data using a
cell phone or smartphone, there is the need for the
sensor to be small and light. Although we have
succeeded in realizing a wireless and USB
connection, we are requesting others to develop a
sensor that is compact and user friendly.
There is also the need to address security issues
as biological information is handled. We believe we
can resolve this issue by selecting the appropriate
database management method and communication
method.
REFERENCES
Moore, R., Lopes, J., 1999. Paper templates. In
TEMPLATE’06, 1st International Conference on
Template Production. SciTePress.
Smith, J., 1998. The book, The publishing company.
London, 2
nd
edition.
Tsuda I., Tahara T., Iwanaga I., 1992. Chaotic pulsation in
capillary vessels and its dependence on mental and
physical conditions. Int J Bifurcation and Chaos 2:
313-324.
Sumida T., Arimitu Y., Tahara T., Iwanaga H., 2000.
Mental conditions reflected by the chaos of pulsation
in capillary vessels. Int J Bifurcation and Chaos 10:
2245-2255.
Sano M., Sawada Y., 1985. Measurement of the Lyapunov
spectrum from a chaotic time series. Phys. Rev. Lett.
55: 1082.
Abarbanel HDI., Brown R., Sidorowich JJ., Tsimring LS.,
The analysis of observed chaotic data in physical
systems. Rev Mod Phys 1993., 65: 1331-1392.
Tokihiko Niwa, Kenji Fujikawa, Yoshikazu,Tanaka,
Mayumi Oyama, 2001. Visual Data Mining Using a
Constellation Graph, ECML/PKDD-2001, Springer-
Verlag. (Academic Journal, 2001.) Working Notes/29-
44.
Oyama-Higa M., Miao T., Mizuno-Matsumoto Y., 2006.,
Analysis of dementia in aged subjects through chaos
analysis of fingertip pulsewaves. 2006 IEEE
Conference on Systems, Man, and Cybernetics,
Taipei, Taiwan, 2863–2867.
Takens F., In: Braaksma B. L. J., Broer H. W., Takens F.,
eds. 1985. Dynamical Systems and Bifurcations,
Lecture Notes in Math. Vol. 1125. Springer,
Heidelberg.
Miao T., Shimoyama O., Oyama-Higa M., 2006.
Modelling plethysmogram dynamics based on
baroreflex under higher cerebral influences. 2006
IEEE Conference on Systems, Man, and Cybernetics,
Taipei, Taiwan, 2868–2873.
Oyama-Higa M., Miao T., 2006. Discovery and
application of new index for cognitive psychology.
2006 IEEE Conference on Systems, Man, and
Cybernetics, Taipei, Taiwan, 2040–2044.
Imanishi A., Oyama-Higa M., 2006. The relation between
observers’ psychophysiological conditions and human
errors during monitoring task. 2006 IEEE Conference
on Systems, Man, and Cybernetics, Taipei, Taiwan,
2035–2039.
Third International Symposium on Business Modeling and Software Design
252
