
Forecasting Price Movement of SOFIX Index on the Bulgarian Stock
Exchange – Sofia using an Artificial Neural Network Model
Veselin L. Shahpazov, Vladimir B. Velev and Lyubka A. Doukovska
Institute of Information and Communication Technologies, Bulgarian Academy of Sciences,
Acad. G. Bonchev str., bl. 2, 1113 Sofia, Bulgaria
veselin_georgiev@abv.bg, vladimir.velev@allianz.bg, doukovska@iit.bas.bg
Keywords: Forecasting, SOFIX Index, Artificial Neural Network, Business, Predicting Stock Prices, Supervised
Learning.
Abstract: The Bulgarian capital market is characterized by its relatively short history and its low liquidity, SOFIX is
the first index of BSE-Sofia based on the market capitalization of the included issues of common shares,
adjusted with the free-float of each of them. The authors intend to use a model implying an Artificial Neural
Network to predict the future price of the index. A neural network has the ability to extract useful
information from large sets of data, which often is required for a satisfying description of a financial time
series. Capital markets are known for their complexity and unpredictability and are best described as chaotic
systems. Artificial Neural Networks can be used to find relationship in large sets of data which have some
unknown relationship between input and output. Once that relationship is found, the neural network can be
used to compute the output for similar (but usually different) input.
1 INTRODUCTION
The Bulgarian capital market is characterized by its
relatively short history and its low liquidity,
especially in recent years. Yet the companies listed
represent different economic segments from the
heavy production industry to pharmaceuticals and
local banking. SOFIX is the best known and the first
index of BSE-Sofia, which calculation started on
October 20, 2000. SOFIX is based on the market
capitalization of the included issues of common
shares, adjusted with the free-float of each of them.
SOFIX is the most successful index calculated by
BSE-Sofia and is the first one on which structured
products are based on. The index covers the 15
issues of shares complying with the general
requirements for selection of constituent issues that
have the greatest market value of the free-float.
Artificial Neural Networks are flexible
computing frameworks and universal approximators
that can be applied to a wide range of time series
forecasting problems with a high degree of accuracy,
(Atsalakis, 2009). They are an artificial intelligence
method for modeling complex target functions. For
certain types of problems, such as learning to
interpret complex realworld sensor data, Artificial
Neural Networks are among the most effective
learning methods currently know. During the last
decade they have been widely applied to the domain
of financial time series prediction and their
importance in this field is
growing. The ability of neural networks to
closely approximate unknown functions to any
degree of desired accuracy has generated
considerable demand for Neural Network research in
Business. The attractiveness of neural network
research stems from researchers need to approximate
models within the business environment without
having a priori knowledge about the true underlying
function, (Sexton, 1998). However, despite all
advantages cited for artificial neural networks, their
performance for some real time series is not
satisfactory.
Predicting stock prices with traditional time
series analysis has proven to be difficult. An
artificial neural network may be more suitable for
the task. Primarily because no assumption about a
suitable mathematical model has to be made prior to
forecasting. Furthermore, a neural network has the
ability to extract useful information from large sets
of data, which often is required for a satisfying
description of a financial time series, (Nygren,
2004). In recent years, neural networks have
received an increasing amount of attention as a very
298
L. Shahpazov V., B. Velev V. and Doukovska L.
Forecasting Price Movement of SOFIX Index on the Bulgarian Stock Exchange â
˘
A ¸S Sofia using an Artificial Neural Network Model.
DOI: 10.5220/0004776802980302
In Proceedings of the Third International Symposium on Business Modeling and Software Design (BMSD 2013), pages 298-302
ISBN: 978-989-8565-56-3
Copyright
c
2013 by SCITEPRESS – Science and Technology Publications, Lda. All rights reserved

popular forecasting and data mining tool. Their
origin stems from the attempt to model the human
thought process as an algorithm which can be
efficiently run on a computer. Software is developed
to mimic this thought process. A neural network can
be used to find relationship in large sets of data
which have some unknown relationship between
input and output. Once that relationship is found, the
neural network can be used to compute the output
for similar (but usually different) input, (Choong,
2009). One of the advantages include automatic
learning of dependencies only from measured data
without any need to add further information (such as
type of dependency like with the regression). The
neural network is trained from the historical data
with the hope that it will discover hidden
dependencies and that it will be able to use them for
predicting into future.
Many authors propose the use of the Artificial
Neural Networks (ANN), a machine learning
method, to improve trading performance,
(Lawrence, 1997, Tilakaratne, 2008, Alhaj, 2011,
Khan, 2010, Montana, 1989, Skabar 2002, Tan,
2006, Maciel, 2008).
2 PROBLEM FORMULATION
The neural network that the authors intend to use for
predicting the price of Sofix index will be trained
with supervised learning. The network that will be
used will be a feed forward, multi-layer perceptron
network with very fast learning and an advanced
mechanism to prevent overfitting.
The Multi-layer
perceptron (MLP) networks trained using
backpropagation (BP) algorithm are the most
popular choice in neural network applications in
finance, (Atsalakis, 2009 and Atanasova, 2006). The
MLP networks are feed forward neural networks
with one or more hidden layers which is capable to
approximate any continuous function up to certain
accuracy just with one hidden layer (Cybenko,
1989).
The MLP consists of three types of layers. The
first layer is the input layer and corresponds to the
problem input variables with one node for each input
variable. The second layer is the hidden layer used
to capture non-linear relationships among variables.
The third layer is the output layer used to provide
predicted values.
The data used for the study is from the Bulgarian
stock exchange official website, and consists of the
following: last price, open, high, low and volume
traded, as well as five of the most commonly used
technical indicators (according to study conducted
by bigtrends.com): the 30 day moving average, 60
day moving average, 200 day moving average, the
14 day relative strength index and the 30 day relative
strength index. The training data covers a period of
two years and two months or from 04.01.2011 until
08.03.2013. We find the period appropriate because
it consists of an uptrend and a downtrend in the first
couple of months than the price of SOFIX
consolidates and in the last months of the observed
period enters into an uptrend. This we believe will
permit us to train the network in a better way and
produce results with a minimal error.
The training data is split into three parts, with the
major part of 50% of the data is treated as actual
training data, and the rest are treated as a testing data
(25%) and validation data (25%).
The software used during this study is
STATISTICA 7.0. The preferred Neural Network
structure was a three layer perceptron.
The software operates using back-propagation
and conjugate gradient descent algorithms for
training the network. The Artificial Neural Networks
implements the on-line version of back propagation;
i.e. it calculates the local gradient of each weight
with respect to each case during training. Weights
are updated once per training case.
The update formula is:
)1()(
tt
ijijij
(1)
where:
η - the learning rate;
δ- the local error gradient;
α- the momentum coefficient;
o
i
- the output of the i'th unit.
Thresholds are treated as weights with o
i
= -1. The
local error gradient calculation depends on whether
the unit into which the weights feed is in the output
layer or the hidden layers. Local gradients in output
layers are the product of the derivatives of the
network's error function and the units' activation
functions. Local gradients in hidden layers are the
weighted sum of the unit's outgoing weights and the
local gradients of the units to which these weights
connect.
The Conjugate gradient descent (Bishop, 1995;
Shepherd, 1997) is an advanced method of training
multilayer perceptron’s. It usually performs
significantly better than back propagation, and can
be used wherever back propagation can be. It is the
recommended technique for any network with a
large number of weights (more than a few hundred)
Forecasting Price Movement of SOFIX Index on the Bulgarian Stock Exchange – Sofia using an Artificial Neural Network
Model
299

and/or multiple output units. Conjugate gradient
descent is a batch update algorithm: whereas back
propagation adjusts the network weights after each
case, conjugate gradient descent works out the
average gradient of the error surface across all cases
before updating the weights once at the end of the
epoch.
The most widely used activation function for the
output layer are the sigmoid and hyperbolic
functions. In this paper, the sigmoid transfer
function is employed and is given by:
t
e
tE
1
1
)(
(2)
The criteria which will evaluate the Neural
Networks performance will be the error of the
network on the subsets used during training (Root
Mean Square-RMS).
n
RMS
n
i
ii
1
2
)
ˆ
(
(3)
This is less interpretable than the performance
measure, but is the figure actually optimized by the
training algorithm (at least, for the training subset).
This is the RMS of the network errors on the
individual cases, where the individual errors are
generated by the network error function, which is
either a function of the observed and expected
output neuron activation levels (usually sum-squared
or a cross-entropy measure); or Sum-squared. The
error is the sum of the squared differences between
the target and actual output values on each output
unit. This is the standard error function used in
regression problems.
The weights and biases of the network are
automatically initialized to small random numbers
by the software.
3 STUDY RESULTS
In order to achieve better results with training the
Neural Network the authors decided to transform the
input data from values to change. Since the period of
time that the input data represents is limited to
nearly two years the index fluctuates between a
minimum value of 286.03 and a maximum value of
455.75.
The initial results showed that the networks that
utilized all eight input parameters ( last price, open,
high, low and volume traded 30 day moving
average, 60 day moving average, 200 day moving
average, the 14 day relative strength index and the
30 day relative strength index) performed
consistently much worse than the ones that isolated
some of the input parameters. The networks that
based their prognoses solely on the last price showed
the best results in terms of test error.
The tests were conducted with different network
architecture but the best result was obtained with a
three layer perceptron, consisting of 1 input (43 time
lagged steps) 7 nodes in the hidden layer and 1
output, training consisted of 100 epochs using back-
propagation and 23 epochs using the conjugate
gradient descent algorithm, the test error amounted
to 0.119279. It is important to outline that the
software stops the learning process when the
minimum error is reached, that way it prevents the
network from over-fitting.
After taking into consideration the specifics of
the Bulgarian stock market (the extremely low
traded volume, a problem that exposes the index to
manipulation which will lead to distortion of the
network results) the authors have found appropriate
to conduct moving average smoothing to the input
data commencing with 3 days smoothing
(calculating the average value of the last three days).
As seen from the results shown in Table 1 this
data manipulation managed to bring down the test
error considerably. The table shows the effects of
increasing the period that has been smoothed, the
Table 1: Results, produced with 3 to 9 days smoothing of last price data and respective network structures learning samples
and test error (RMS).
Network structure
Input-hidden-output
Learning samples
BP/CGD
Test error
RMS
3 days smoothing 1(12)-5-1 BP-100; CGD-115 0.076298
4 days smoothing 1(12)-11-1 BP-100; CGD-58 0.089827
5 days smoothing 1(25)-15-1 BP-100; CGD-48 0.067025
6 days smoothing 1(10)-5-1 BP-100; CGD-76 0.075116
7 days smoothing 1(20)-13-1 BP-100; CGD-34 0.057099
8 days smoothing 1(15)-14-1 BP-100;CGD-68 0.057903
9 days smoothing 1(15)-5-1 BP-100; CGD-67 0.064887
Third International Symposium on Business Modeling and Software Design
300
different network structures, learning samples and
most importantly the resulted test error. The error
reaches its minimum with 7 day smoothing and a
structure of the network with 1 input (20 time lagged
steps) 13 nodes in the hidden layer and 1 output,
training consisted of 100 epochs using back-
propagation and 34 epochs using the conjugate
gradient descent algorithm, the test error amounted
to 0. 057903.
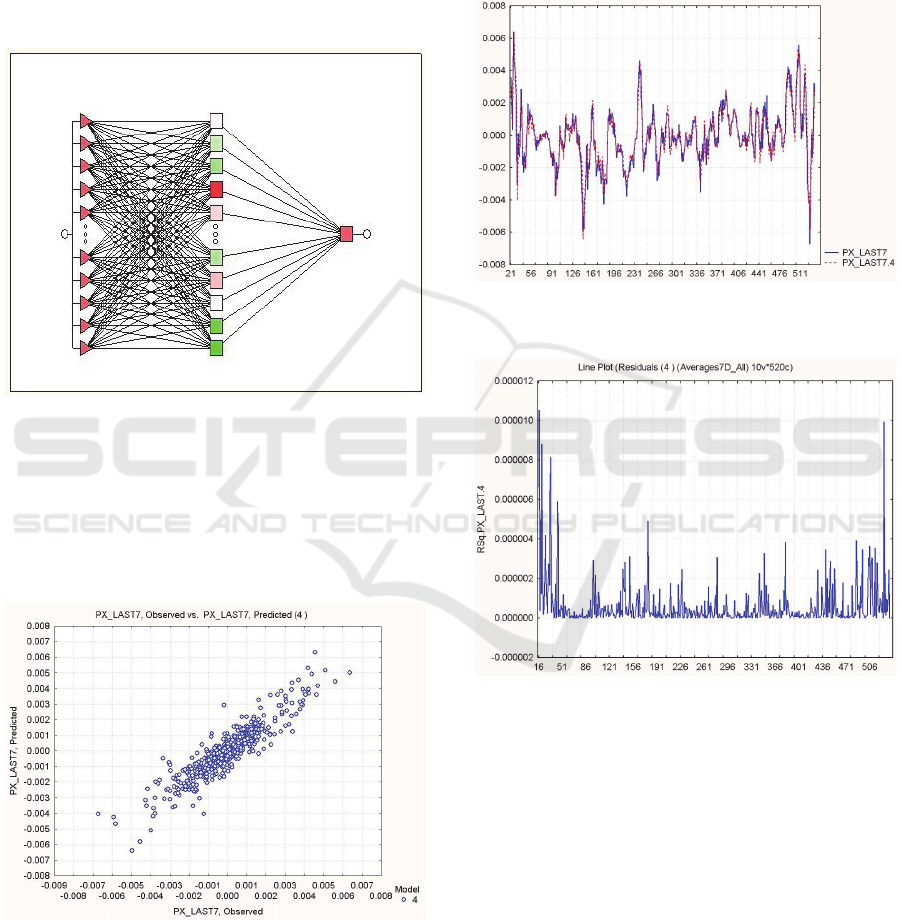
Figure 1: Structure of Neural Network with 1 input (20
time lagged steps) 13 nodes in the hidden layer and 1
output.
Figures 1, 2, 3 and 4 show structure, predicted
values versus observed plot, graphic of the
predictions over the analysed period and the residual
error diagram respectively.
Figure 2: Predicted values versus observed values plot.
As we can see from Figure 4, the error tends to
increase in in the beginning and the end of the
analysed period of time. This can be explained from
an economic perspective with the fact that during
both periods the Bulgarian stock market is in a trend
situation usually characterized with higher volatility
in the prices of stocks, especially in downtrends.
This leads the authors to believe that predictive
abilities of a neural network are better suited for
markets that find themselves in a period of
consolidation.
Figure 3: Predicted change (dotted line) versus observed
change.
Figure 4: The residual error.
The Networks that were fed with the same pre-
processed data but trained with all 10 input
parameters showed worse results. In the case with
the best results (7 days smoothing) in terms of test
error, the value of RMS 0.068935, the network
structure produced by the software was 9 input (15
time lagged steps) 21 nodes in the hidden layer and
1 output, training consisted of 100 epochs using
back-propagation and 81 epochs using the conjugate
gradient descent algorithm.
Forecasting Price Movement of SOFIX Index on the Bulgarian Stock Exchange – Sofia using an Artificial Neural Network
Model
301

4 CONCLUSIONS
In this paper, the problem of predicting the price of
Bulgarian Stock Exchange’s Sofix index using
neural networks is considered. The analyzed period
is of two years and two months or from 04.01.2011
until 08.03.2013. Data used for the case consists of
the daily values of last price, open, high, low and
volume traded 30 day moving average, 60 day
moving average, 200 day moving average, the 14
day relative strength index and the 30 day relative
strength index.
The criteria which was used to evaluate the
Neural Networks performance was the error of the
network on the subsets used during training (Root
Mean Square)
The input data was preprocessed and transformed
from values into daily changes. Initial readings
showed that better results would be achieved if the
input is one compared to using all or fragments of
the initial data set.
Smoothing ranging from 3 to 9 days was
performed in order to eliminate the effects of the low
liquidity and higher volatility in the market.
Results showed that this data manipulation
managed to bring down the test error considerably.
The produced neural network was structured by 1
input (20 time lagged steps) 13 nodes in the hidden
layer and 1 output, training consisted of 100 epochs
using back-propagation and 34 epochs using the
conjugate gradient descent algorithm, the test error
amounted to 0.057903. In comparison the best
performing network using all or partial input data
managed an error of 0.068935.
The obtained result was found good but the
authors see further room for improvement of the
predicting capabilities of the model. The error
margin is still considered big and attempts to bring it
further down will be made, especially improving the
predictive capabilities for trends. The low liquidity
and high volatility environment of the Bulgarian
stock market is a challenge that could be addressed
more efficiently with similar neural networks that
have different structure and learning algorithms.
Future work will involve different input data and
data pre-processing, possibly other types of neural
networks and algorithms.
ACKNOWLEDGEMENTS
The research work reported in the paper is partly
supported by the project AComIn “Advanced
Computing for Innovation”, grant 316087, funded
by the FP7 Capacity Programme (Research Potential
of Convergence Regions) and partially supported by
the European Social Fund and Republic of Bulgaria,
Operational Programme “Development of Human
Resources” 2007-2013, Grant № BG051PO001-
3.3.06-0048.
REFERENCES
Lawrence R., Using Neural Networks to Forecast Stock
Market Prices, Department of Computer Science
University of Manitoba, December 12, 1997.
Tilakaratne C. D., S. A. Morris, M. A. Mammadov, C. P.
Hurst, Predicting Stock Market Index Trading Signals
Using Neural Networks, Centre for Informatics and
Applied Optimization School of Information
Technology and Mathematical Sciences University of
Ballarat, Ballarat, Victoria, Australia. 2008.
Alhaj Ali S. M., A. A. Abu Hammadb, M. S. Samhouria,
A. Al-Ghandoora, Modelling Stock Market Exchange
Prices Using Artificial Neural Network: A Study of
Amman Stock Exchange, Industrial Engineering,
Department, Faculty of Engineering, Hashemite
University, Jordan. JJMIE Volume 5, Number 5, 2011.
Nygren K., Stock Prediction – A Neural Network
Approach, Master Thesis Royal Institute of
Technology KTH, Supervisor: Prof. Kenneth
Holmstrom, 2004.
Khan Z. H., T. S. Alin, M. A. Hussain, Price prediction of
share market using Artificial Neural Network,
Department of CSE, SUST Sylhet, Bangladesh.
International Conference on Computer Information
Systems and Industrial Management Applications
(CISIM), 2010.
Montana D. J., L. Davis, Training Feed-forward Neural
Networks Using Genetic Algorithms, BBN Systems
and Technologies Corp., IJCAI'89 Proceedings of the
11th international joint conference on Artificial
intelligence - Volume 1 Pages 762-767, 1989.
Skabar A., I. Cloete, Neural Networks, Financial Trading
and the Efficient Markets Hypothesis, School of
Information Technology International University in
Germany, Twenty-Fifth Australasian Computer
Science Conference (ACSC2002), 2002.
Tan Clarence N. W., An Artificial Neural Networks
Primer with Financial Applications Examples in
Financial Distress Predictions and Foreign Exchange
Hybrid Trading System, PhD Thesis’s School of
Information Technology, Bond University, Gold
Coast, Australia, 2006.
Maciel L. S., R. Balliani, Design a Neural Network for
time series financial forecasting: accuracy and
robustness analysis, Instituto de Economia (IE),
Universidade Estadual de Campinas (UNICAMP) São
Paulo – Brasil, 2008.
Sexton R. S., B. Alidaee, R. E. Dorsey, J. D. Johnson,
Global Optimization for Artificial Neural Networks: A
Tabu Search Application, European Journal of
Third International Symposium on Business Modeling and Software Design
302

Operational Research, Volume 106, Issues 2–3, Pages
570–584 April 1998.
Atsalakis G. S., Valavanis K. P., Surveying Stock Market
Forecasting Techniques – Part II: Soft Computing
Methods, Expert Systems with Applications, Journal
Expert Systems with Applications: An International
Journal Volume 36 Issue 3, Pages 5932-5941 April,
2009.
Cybenko G., Approximations by Superpositions of a
Sigmoidal Function, Mathematics of Control, Signals,
and Systems, Pages 303-314, 1989.
Atanasova T. Simeonova V., Prediction of stock market
index using neural networks and genetic algorithms,
University of Economics – Varna, Bulgaria, 2006.
Choong J., Build Neural Network with MS Excel,
Published by XLPert Enterprise by XLPert Enterprise,
2009.
Forecasting Price Movement of SOFIX Index on the Bulgarian Stock Exchange – Sofia using an Artificial Neural Network
Model
303
