
NON-UNIFORM SAMPLING FOR SPECTRAL ANALYSIS OF
MULTI-BAND SIGNALS
Samba Traorè, Babar Aziz, Daniel Le Guennec and Jacques Palicot
IETR / SUPELEC, Campus de Rennes Avenue de la Boulaie - CS 47601, F-35576 Cesson-Sevigne cedex, Francey
fsamba.traore, babar.aziz, daniel.leguennec, jacques.palicotg@supelec.fr
Keywords: Non-Uniform Periodic Sampling, Non-Uniform Spectral Analysis, Cognitive radio.
Abstract: Recently, sub-Nyquist sampling of wideband signals has gained much attention in wireless
communications. One of the main reasons for this popularity is the reduction in energy consumption in the
ADCs. In this paper, we present an overview of the best known non-uniform sub-Nyquist sampling
techniques and the associated spectral analysis. Spectral analysis using sub-Nyquist samples can be done in
two ways. We can reconstruct the original Nyquist samples from the sub-Nyquist samples and then by using
Fourier transform we can obtain the estimated power spectral density using classical methods like Welch
method. We can also obtain the power spectral estimate directly from the sub-Nyquist samples without
reconstructing the Nyquist samples. Both approaches can be used based on the application.
1 INTRODUCTION
In recent years, spectral estimation has attracted
more and more interest due to its importance in the
field of cognitive radio, where secondary users
(unlicensed) can opportunistically use the frequency
spectrum unused (holes) by primary users (licensed).
For this purpose, the secondary user is forced to scan
the radio environment of broadband in order to
detect the holes. In [Zhang, 2010] authors use Filters
Banks in order to share the wide band spectrum in
many narrow bands and to comput in each
narrowband in parallel the PSD. In [Tian and
Giannakis, 2006] author apply wavelet transform in
order to detect transitions between different subband
of the wide band signal. But this type of wideband
analysis involves a very high sampling rate and
consequently a large energy consumption. This
situation encouraged the researchers to examine the
exploitable characteristics of the spectrum for a
reduction of the requirements of the ADCs. A lot of
papers propose to use the spectrum sparsity property
to reduce the sampling rate [Bourdoux A. and der
Perre L., 2011] [Miar et al., 2012]. Multi- Coset
sampling studied in [Rashidi Avendi, 2010]
[Venkataramani and Bresler, 2000] [Venkataramani
and Bresler, 2001] is an effective way to reduce the
frequency sampling for multi-band signals whose
frequency support is a finite union of intervals.
Similarly, [Mishali and Eldar, 2010] evaluates the
subnyquist sampling for multi-band analog signals
using a sparse ModulatedWideband Converter
(MWC), consisting of several branches, each of
which uses a different mixing function followed by a
low-pass filtering and a low rate uniform sampling.
Both the above approaches can be combined with
compressive sampling. The reconstruction process
can be carried out using methods such as sparse
recovery algorithm LASSO (Least Absolute
Shrinkage and Selection Operator) [Tibshirani,
1996] or even using traditional methods such as
MUSIC (MUltiple Signal Classification) [Bresler,
2008]. The methods described in [Mishali and Eldar,
2010] [Rashidi Avendi, 2010] are known as blind
spectral sampling methods, whose objective is to
sample the signal at a minimum rate and reconstruct
the unknown spectrum from these samples, while
considering the spectrum is sparse. It was found in
this work that for most signals, the minimum
sampling frequency is given by the average lower
limit of Landau (as studied in [Feng and
Bresler,1996] [Landau, 1967] ), which is equal to
the Nyquist frequency divided by the spectrum occu-
pancy. But for optimal reconstruction, all these meth
126
TraorÃ
´
l S., Aziz B., Le Guennec D. and Palicot J.
NON-UNIFORM SAMPLING FOR SPECTRAL ANALYSIS OF MULTI-BAND SIGNALS.
DOI: 10.5220/0004786201260134
In Proceedings of the Second International Conference on Telecommunications and Remote Sensing (ICTRS 2013), pages 126-134
ISBN: 978-989-8565-57-0
Copyright
c
2013 by SCITEPRESS – Science and Technology Publications, Lda. All rights reserved

ods assume that the number of bands and the maxi-
mum bandwidth, a band can have, is known.
The methods presented before, assume that the
signal to be analyzed is sparce in the frequency do-
main. There are other non-uniform sampling meth-
ods which do not make this assumption like Additive
Random Sampling (ARS), Jittered Random Sampling
(JRS). These methods are alias-free therefore we can
sample at sub-nyquist rates. But we will show later
that their performance is not good in terms of spec-
tral analysis. In [Traor
´
e et al., 2013], we proposed
a new sampler based on Multi-Coset (MC) sampling
scheme, which adjusts its sampling rate according to
the changes in the frequency spectrum of the input
signal. That is, if the signal is sparse in the frequency
domain, it samples at sub-nyquist rate, else it samples
at nyquist rate.
In this paper, we present an overview of the best
known techniques of non-uniform sampling and the
associated spectral analysis. This article is organized
as follows. In Section 2, we present two non-uniform
sampling techniques (Jittered Random Sampling and
Additive Ransom Sampling) and the associated spec-
tral estimation. In Section 3, we present a well known
non-uniform sampling technique (Multi-Coset Sam-
pling) and its limitations. In Section 4, we present an
adaptative Multi-Coset Sampling technique. Numeri-
cal results are presented in Section 5 followed by the
conclusion in Section 6.
2 NON-UNIFORM SAMPLING
Uniform Sampling (US) consists in representing a
signal x(t) with the values x(k) at time instants which
are integer multiples of T , called sampling period. In
the case of non-uniform sampling, all {t
k
}
k∈Z
, sam-
pling instants, must be different from the set of in-
stants {kT }
k∈Z
, for a sampling period T . The non-
uniformly sampled digital signal obtained is given by:
x
s
(t) =
+∞
∑
k=−∞
x(t)δ(t − t
k
) (1)
The estimate of the Fourier transform of the sig-
nal randomly sampled at the instants {t
k
}
k∈Z
consists
only of the Fourier transform of continuous time x(t)
denoted X( f ) such that :
ˆ
X
s
( f ) = E
"
+∞
∑
k=−∞
x(t
k
)e
− j2π f t
k
#
=
1
T
X( f ) (2)
Next we presente an overview of the well know
non-uniform sampling techniques.
2.1 Jittered Random Sampling
In JRS Sampling, at the uniformly distributed sam-
pling instants, a deliberate error obeying a sta-
tistical law of distribution defined on an interval
[−0.5T, 0.5T] is added. The n sampling instants
by JRS mode are described by [Wojtiuk, 2000]
[Ben Romdhane, 2009]:
t
k
= kT + τ
k
, 1 ≤ k ≤ n (3)
with E[t
k
] = kT , Var[t
k
] = σ
2
and T is the av-
erage sampling period. For n ≥ 1, {τ
k
}
n
k=1
is a set
of random variables independent and identically dis-
tributed with probability distribution p
1
(τ), with zero
mean and variance σ
2
. The probability density of the
k
th
sampling instant is given by:
p
k
(t) = p
1
(t − kT ), 2 ≤ k ≤ n (4)
The digital signal obtained is given by :
x
s
(t) =
+∞
∑
k=−∞
x(t)δ(t − kT − τ
k
) (5)
There are several formulations of the Power Spec-
tral Density (PSD) for random sampling using JRS
mode [Wojtiuk, 2000] [Shapiro and Silverman, 1960].
However, the most exhaustive formulation which is
based on justified hypotheses is that of Wojtiuk [Wo-
jtiuk, 2000]. Wojtiuk demonstrated that in the case of
JRS mode, the PSD of a randomly sampled signal is
given by (6) :
P
xJRS
( f ) = P
x
( f ) ⊗{
1
T
2
+∞
∑
n=−∞
|Φ
1
(
n
T
)|
2
δ( f −
n
T
)
+
1
T
1 − |Φ
1
( f )|
2
} (6)
where P
x
( f ) is the PSD of the signal x(t), ⊗ is the
convolution operation,
1
T
is the mean sampling rate
and Φ
1
( f ) is the characteristic function of the distri-
bution p
1
(τ). The discrete term in (6) represents the
aliasing operation and the continous term represents a
wide band noise (Fig. 3). It was also verified that, for
a uniform distribution, we improve the elimination of
aliasing when we increase the average sampling rate
and the standard deviation of the distribution (Fig. 4).
For the Gaussian distribution we have a very
strong reduction for
σ
T
= 0.2887. The complete elim-
ination of spectral aliasing achieved for uniform and
poisson distribution (Fig. 5).
2.2 Additive Random Sampling
When the time interval between two successive sam-
pling instants follow a statistical law of distribu-
tion defined on an interval [0.5T, 1.5T ], the sampling
Non-Uniform Sampling for Spectral Analysis of Multi-Band Signals
127
is said random cumulative (ARS, Additive Random
Sampling). The n sampling instants by ARS mode are
described by [Wojtiuk, 2000] [Ben Romdhane, 2009]:
t
k
= t
k−1
+ τ
k
= t
0
+
+∞
∑
i=1
τ
i
, 1 ≤ k ≤ n (7)
where E[t
k
] = kT and Var[t
k
] = kσ
2
For n ≥ 1, {τ
k
}
n
k=1
is a set of random variables
independent and identically distributed of probability
distribution p
1
(τ), with zero mean and variance σ
2
.
For k = 0, p
0
(t) = δ(t). The probability density of
the k
th
sampling instant is given by:
p
k
(t) = ⊗
k
i=1
p
1
(t) (8)
The digital signal obtained is given by :
x
s
(t) =
+∞
∑
k=−∞
x(kT + τ
k
)δ(t − kT − τ
k
) (9)
The estimate of the Fourier transform of the ran-
domly sampled signal is given by [Wojtiuk, 2000]
(10):
P
xARS
( f ) = P
x
( f ) ⊗ {
1
T
2
δ( f ) +
1
T
ℜ[
1 + Φ
1
( f )
1 − Φ
1
( f )
]}
(10)
From (10), the PSD of a randomly sampled signal
according to the ARS mode is different from that of
the JRS mode, because there is no sum of discrete
components. Furthermore, the elimination of aliasing
is better when we increase the ratio
σ
T
(Fig. 6). For
example, for gaussian distribution with
σ
T
= 0.2887,
aliasing is completely eliminated (Fig. 7).
3 MULTI-COSET SAMPLING
In this section, we give an overview of the sampler
based on Multi-Coset (MC) sampling [Mishali and
Eldar, 2010, Rashidi Avendi, 2010] and discuss its
limitations. MC sampling is a periodic non-uniform
sampling technique which samples the signal x(t) at
a rate lower than the Nyquist rate, thereby capturing
only the amount of information required for an accu-
rate reconstruction of the signal. MC sampling starts
by first choosing an appropriate sampling period T ,
less than or equal to the Nyquist period associated to
x(t). Two parameters L and p are selected such that
L ≥ p > 0. Then the input signal x(t) is non-uniformly
sampled at t
i
(n) = (nL + c
i
)T , where 1 ≤ i ≤ p and
n ∈ Z [Mishali and Eldar, 2010] . The set C = {c
i
}
contains p distinct integers from L = {0, 1, , L − 1}
and is termed as the sampling pattern. In short, the
process of MC sampling can be viewed as first sam-
pling the input signal at a uniform rate with period T
and then selecting only p non-uniform samples from
L equidistant uniform samples. The process is re-
peated for consecutive segments of L uniform sam-
ples such that the p selected samples have a sam-
pling period L. The set C specifies the p samples
that are retained in each segment of length L such that
0 ≤ c
1
< c
2
< ... < c
p
≤ L − 1.
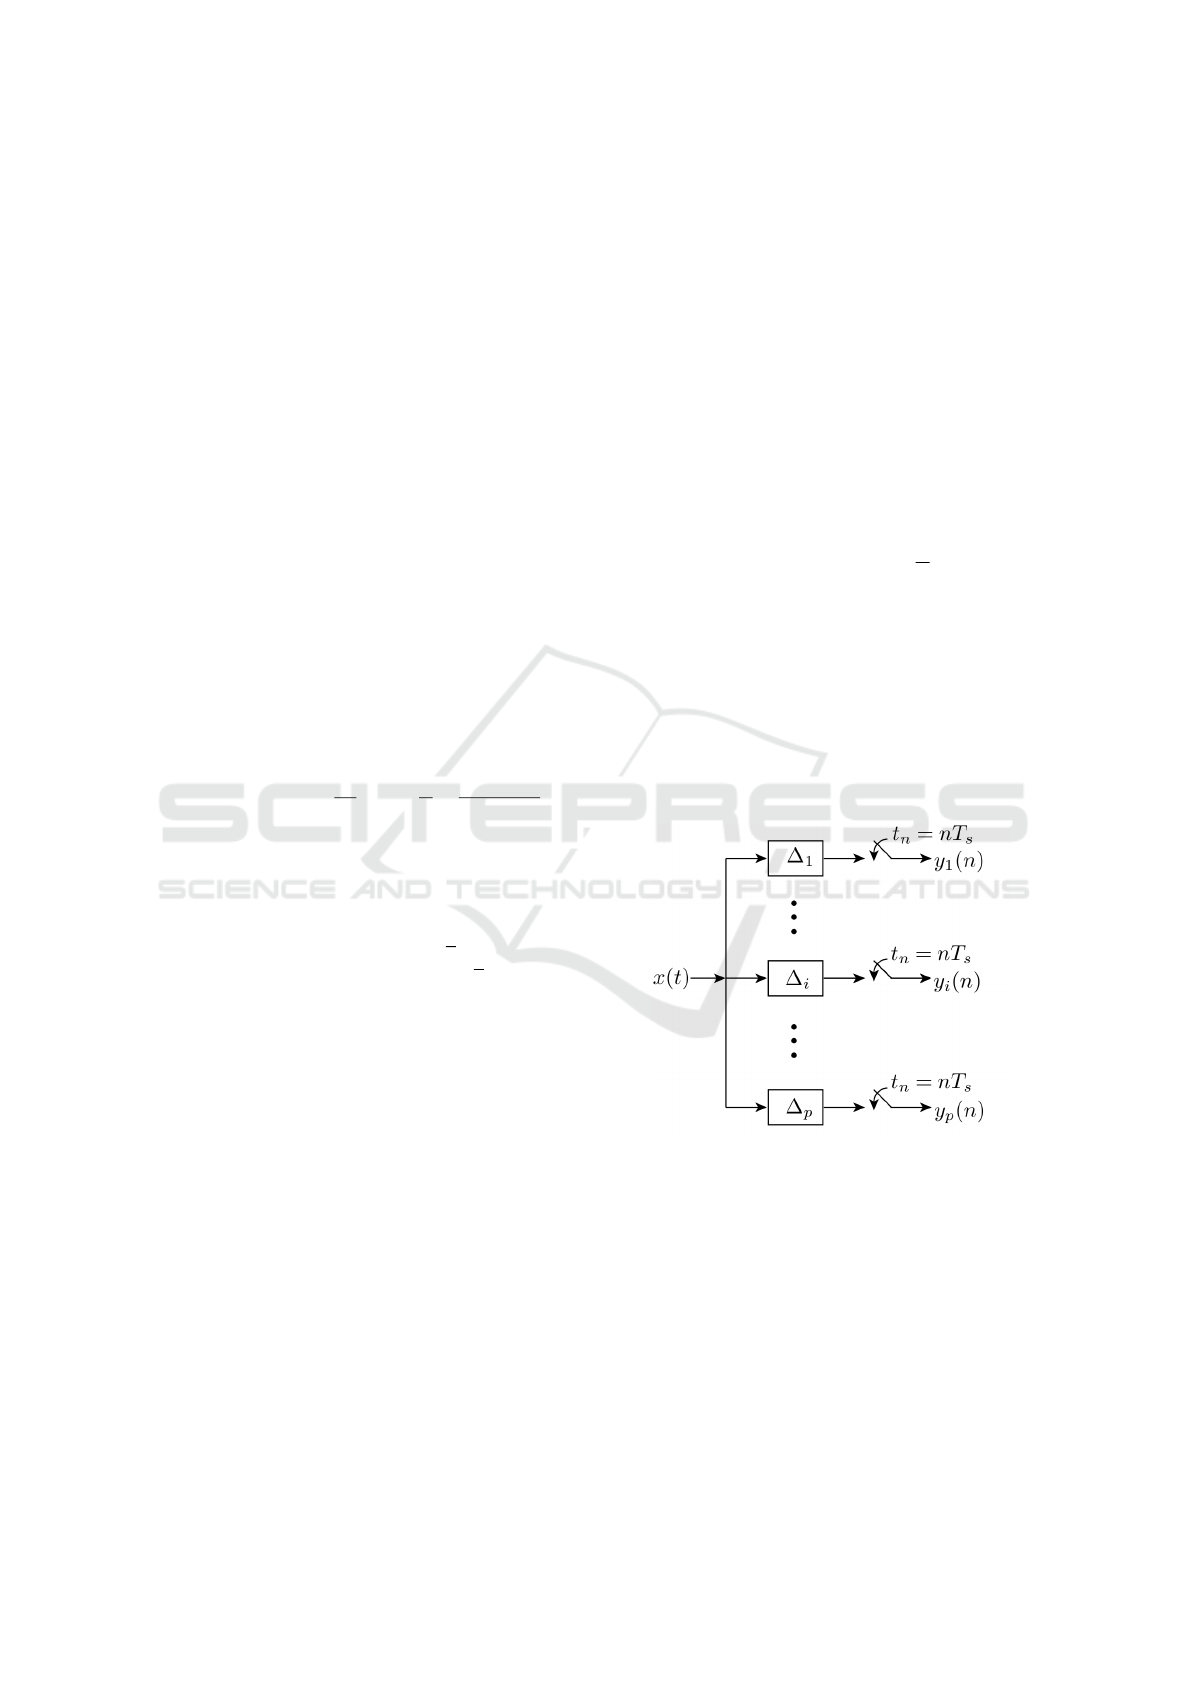
MC sampler is usually implemented by placing p
ADCs in parallel as shown in Fig.1. Each ADC oper-
ates uniformly at a period T
s
= LT . The ∆
i
= c
i
T rep-
resent the time shifts in sampling instants introduced
in each branch. Thus we have
t
i
(n) = (nL + c
i
)T = (n +
c
i
L
)T
s
where 1 ≤ i ≤ p. It should be noted that MC sampling
is highly sensitive to even small errors [Mishali and
Eldar, 2010]. Because of this sensitivity, an appar-
ently possible perfect reconstruction is not achievable
and the signal easily becomes corrupted and unrecog-
nizable in certain practical conditions. A good choice
of the sampling pattern C reduces the margin of error
due to spectral aliasing and sensitivity to noise in the
reconstruction process [Rashidi Avendi, 2010]. It is
Figure 1: Multi-Coset (MC) sampler implemented as a
multi-channel system.
quite evident from Fig.1 that once the sampling pa-
rameters (such as p) are selected, architecture of the
MC sampler will remain unchanged irrespective of
the input signal characteristics modifications. In other
words, once designed, the sampler in Fig.1 cannot be
changed because of hardware limitations. If the in-
put signal changes, the MC sampler does not adapt,
which results in sub-optimal sampling of the signal.
This motivated the author of [Traor
´
e et al., 2013]
to look for an optimal system which conforms with
Second International Conference on Telecommunications and Remote Sensing
128
the spectrum of the input signal. In the next sec-
tion, we explain the functioning of this new sampling
scheme and show that it is more flexible compared to
the MC sampler in Fig.1.
4 DYNAMIC SINGLE BRANCH
MULTI-COSET SAMPLER
With the exponential growth in the means of commu-
nications, modifying radio devices easily and cost-
effectively has become business critical. Software
radio (SW) technology brings the flexibility, cost
efficiency and power to drive communications for-
ward, with wide-reaching benefits realized by ser-
vice providers and product developers through to end
users [Palicot and al, 2010]. One of the main objec-
tives of SW is to propose new technologies to de-
sign radio terminals and wireless infrastructure able
to support hardware-independent, multi-service oper-
ations and are remotely reconfigurable. Furthermore,
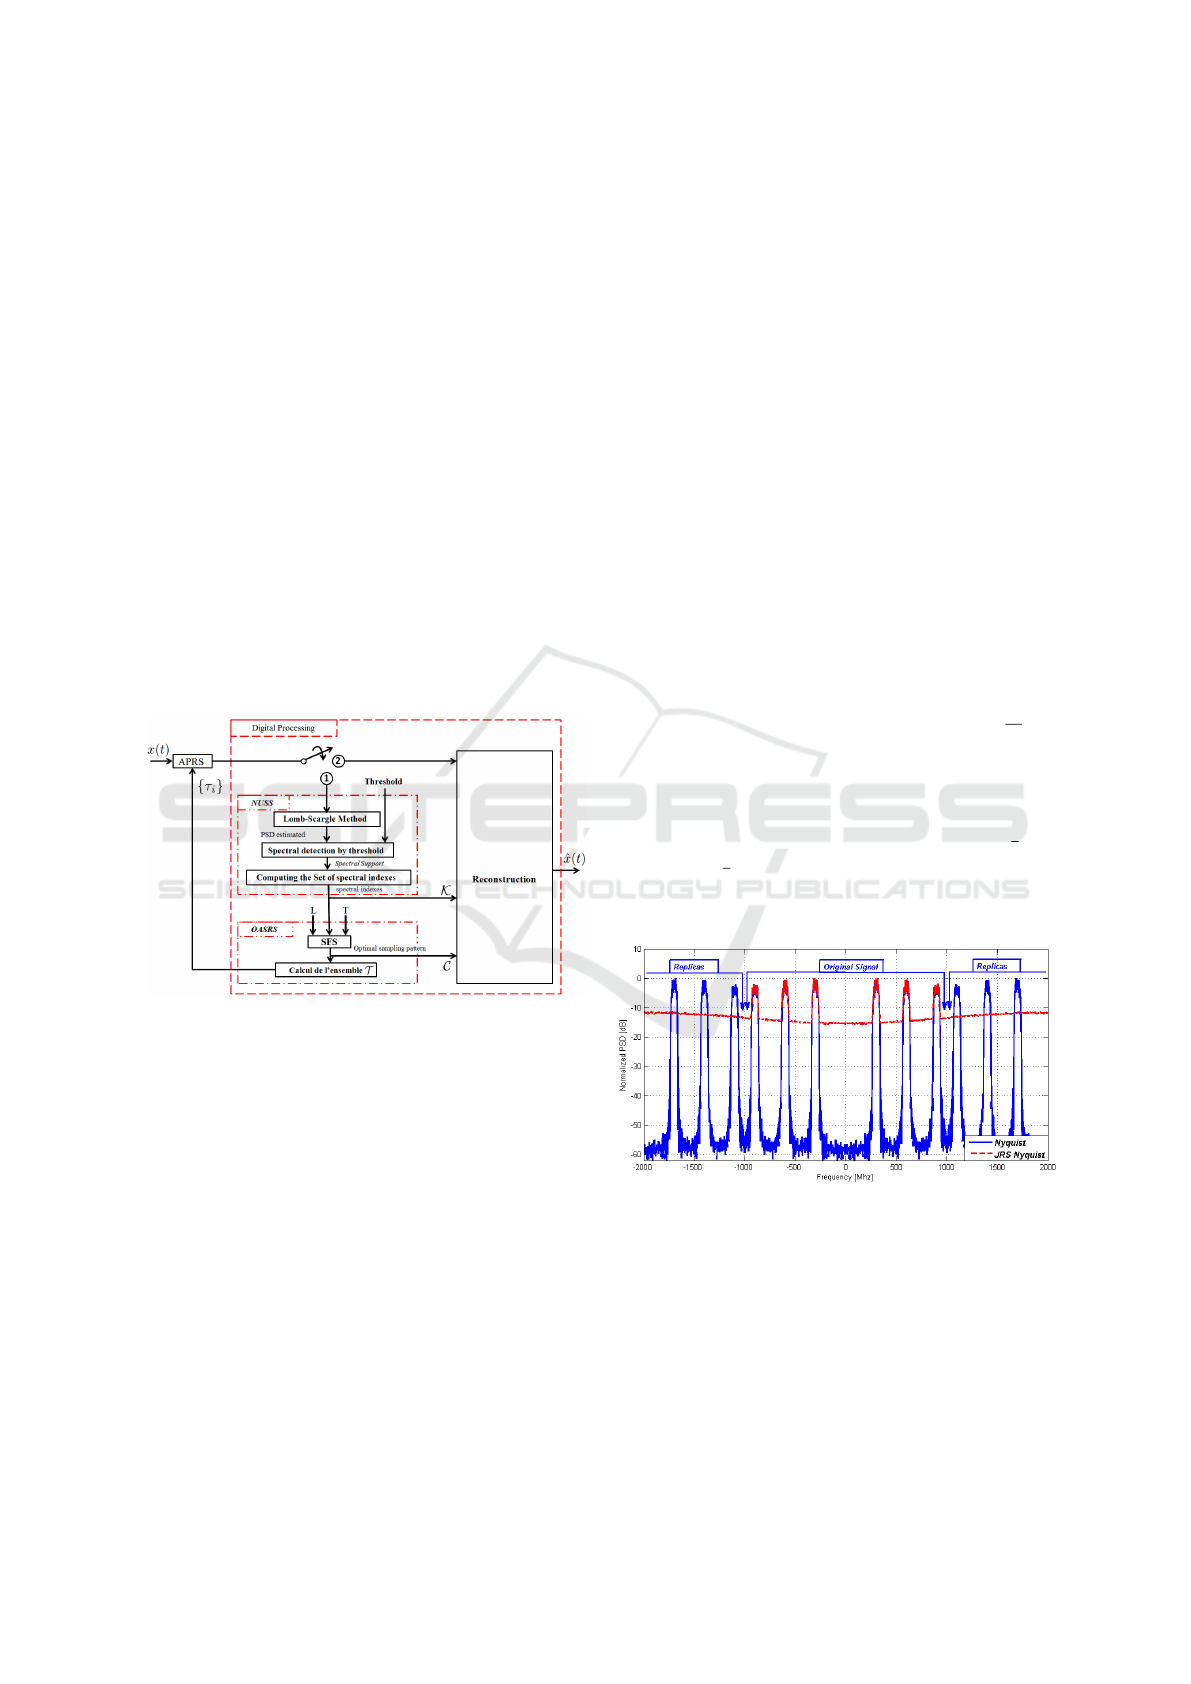
Figure 2: Dynamic Single Branch Non-Uniform Sampler
Cognitive radio continues to gain popularity as it
adapts intelligently to the radio environment, there
by dynamically managing the spectrum [Palicot and
al, 2010]. As a result, the spectrum changes conti-
nously and rarely remains constant. Keeping the as-
pects of Software radio and Cognitive radio in mind,
authors in [Traor
´
e et al., 2013] present a sampler, that
not only adapts to the changes in the input signal but
is also remotely reconfigurable and is, therefore, not
constrained by the inflexibility of hardwired circuitry.
[Traor
´
e et al., 2013] proposed non-uniform sampler
is shown in Fig. 2. They call it the Dynamic Single
Branch Non-Uniform Sampler (DSB-NUS) or simply
the DSB sampler. It operates in blind mode, without
any knowledge of the input signal’s spectral support
and the number of bands. The DSB-NUS works in
two phases:
1. Adaptation phase: When the switch is in position
1, the system has no information about x(t) (num-
ber of bands N, bands location, set K of spetral
indices, maximum bandwidth B
max
. It performs
a spectral analysis using block NUSS (Non Uni-
form Spectrum Sensing) (estimate the Spectral
support of the signal and K , using Lomb-Scargle
Method Fig. 8). In the Optimal Average Sampling
Rate Search block (OASRS), according to (L, T,
K ), used the Sequential Forward Selection (SFS)
algorithm to find the optimal sampling pattern C
and then the optimal set of sampling instants {τ
i
}.
2. Reconstruction Phase: When the switch is in po-
sition 2, the DSB-NUS sampler performs multi-
coset reconstruction.
5 NUMERICAL RESULTS
For simulations, we consider a multi-band signal with
6 bands, each with a maximum bandwidth of 80MHz.
16 − QAM modulation symbols are used that are cor-
rupted by the additive white Gaussian noise with
E
b
N
0
=
50dB. The wideband of interest is in the range of
B = [−1.0, 1.0]GHz i.e. f
nyq
= 2GHz.
Figures 3-4-5 show the PSD of the non-uniform
samples obtained using JRS method, for different val-
ues of the average sampling rate i.e. at Nyquist,
4
5
of
Nyquist and
3
5
of Nyquist. Spectral analysis was per-
formed using Welch method with 50% overlap. Miss-
ing samples were all replaced with zeros.
Figure 3: JRS presented free-aliasing property
We clearly see in Figure 3 that the curves obtained
from JRS non-uniform samples are alias free. The
curve obtained from uniform Nyquist samples present
spectral replicas at multiples of the Nyquist rate.
In Figure 4, we show that the quality of the es-
timated PSD increases with increase in the average
sampling rate of JRS technique. It can be seen that the
wideband noise level increases and decreases in di-
rect relation with the average sampling rate of the JRS
Non-Uniform Sampling for Spectral Analysis of Multi-Band Signals
129
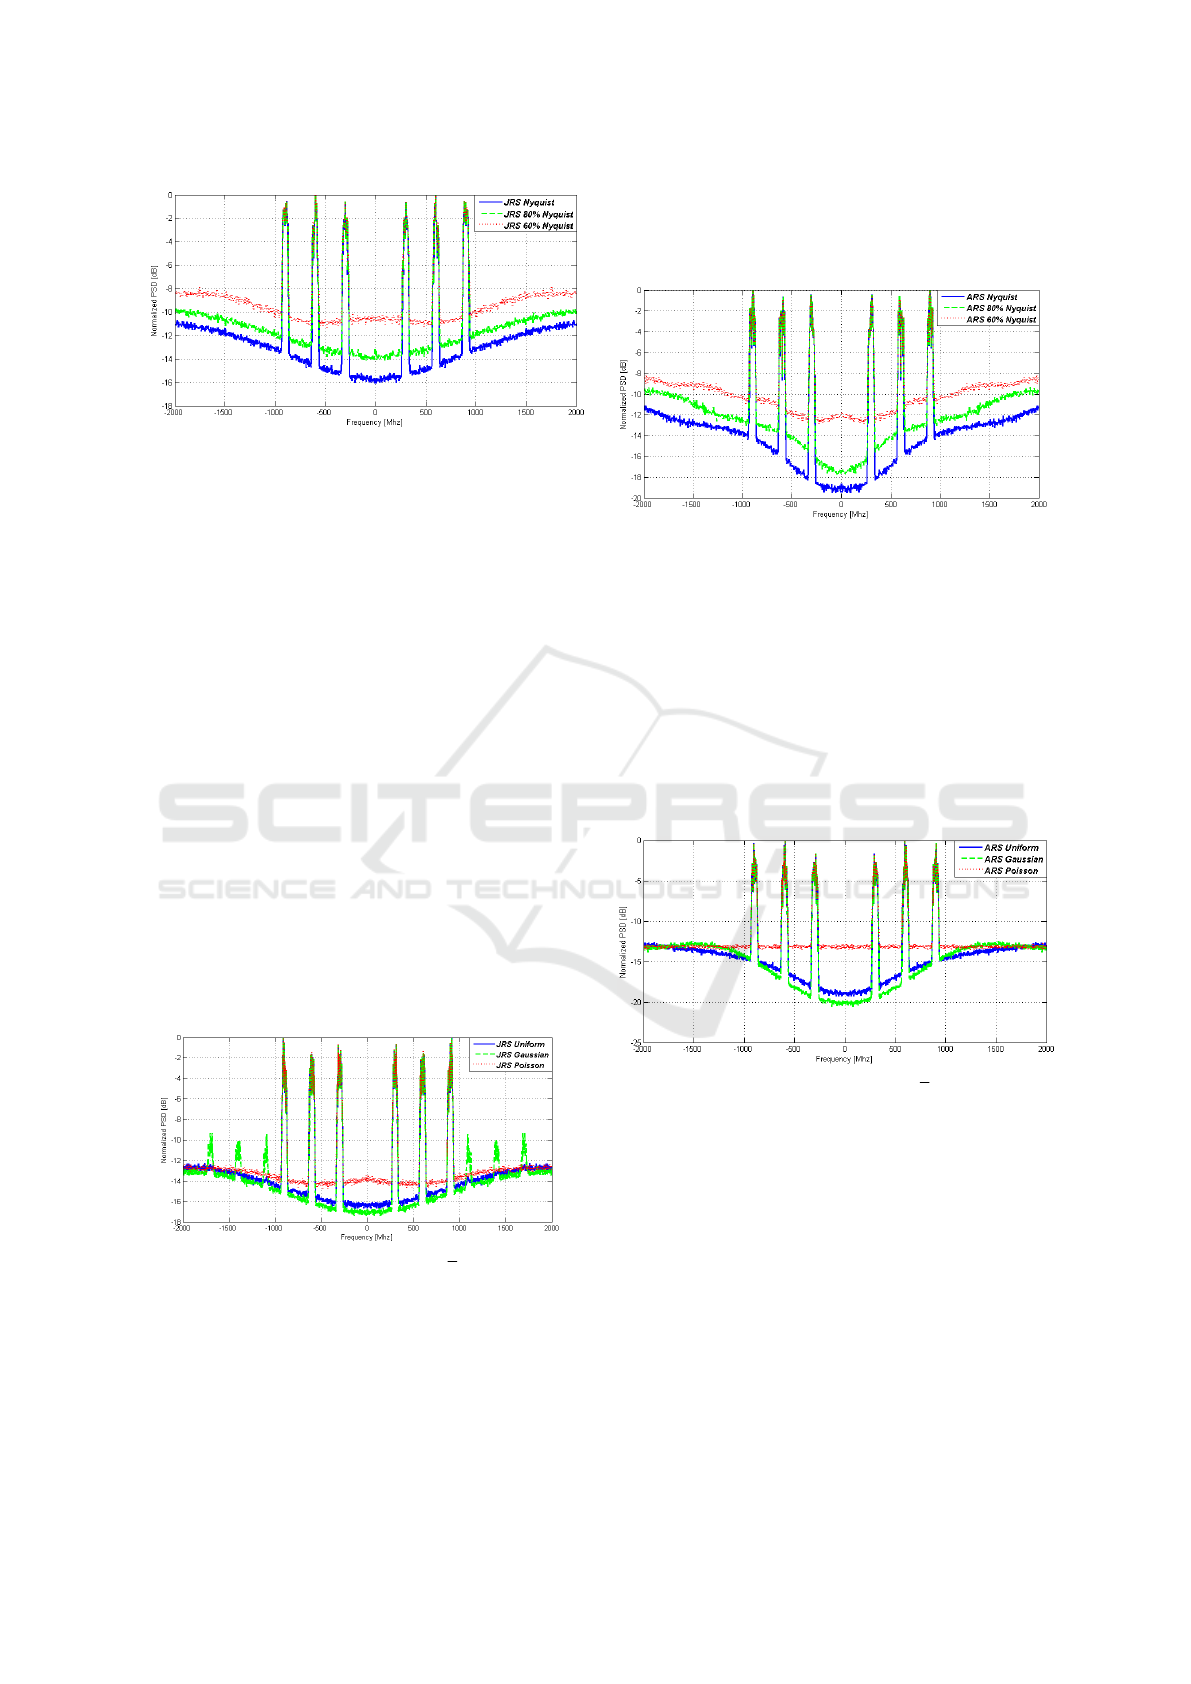
Figure 4: JRS with Uniform distribution and different aver-
age sampling rates
mode. For average sampling rate of 60% of Nyquist
rate, the noise level is very high compared to the av-
erage sampling rate of 80% of Nyquist rate. How-
ever, this improvement in quality of the estimated
PSD comes at the expense of more samples. More-
over, it should be noted that the results presented in
Figure 4 are averaged over 100 iterations.
Next, in Figure 5, we present the effect of dis-
tributions of sampling instances, used for JRS sam-
pling, on the estimated PSD. We compare three dis-
tributions, namely, Gaussian, Poisson and Uniform.
We can see that when Gaussian distribution is used,
spectral replicas appear, however, there amplitude is
small. When Poisson distribution is used, no spec-
tral replicas are observed, however the noise level has
increased compared to the Gaussian distribution. Fi-
nally we present the estimated PSD obtained using
uniform distribution and it can be seen that there are
no spectral replicas. Furthermore, with unifrom dis-
tribution the noise level remains approximately the
same as obtained with Gaussian distribution.
Figure 5: JRS with Uniform, Gaussian(
σ
T
= 0.2887) and
poisson distribution
The results presented in Figures6-7, are for ARS
sampling. In Figure 6, the effect of the average sam-
pling frequency of ARS is shown on the estimated
PSD. It can be seen clearly, just as was observed in the
case of JRS sampling that with increase in sampling
rate the PSD estimates improve. Another important
point to note is that the noise in the estimated PSD for
ARS sampling is less than that of JRS sampling.
Figure 6: ARS with Uniform distribution and different av-
erage sampling rates
In Figure 7, the estimated PSD obtained with ARS
sampling is plotted for three different distributions of
the sampling instances. Again results are presented
for Gaussian, Poisson and Uniform distributions. For
Poisson distribution we have a high noise level. An
interesting result to note is that, contrary to the JRS
case, no spectral replicas are observed for the Gaus-
sian distribution and furthermore, its performance is
better compared to the uniform distribution.
Figure 7: ARS with Uniform, Gaussian(
σ
T
= 0.2887) and
poisson distribution
Next in Figure 8, the estimated PSD obtained from
DSB samples, is presented. The results are compared
with the Welch method which uses uniform Nyquist
samples. It must be noted that for the DSB sam-
pler, no prior knowledge of the spectral support of
the signal is available. The spectral support is com-
puted in the adaptation phase using Lomb-Scargle
method []. Note that while operating in adaptation
phase L = 128, p = 90. The interesting aspect of the
DSB sampler is that it will adjust p for the reconstruc-
tion phase, based on the information obtained in the
adaptation phase. Therefore, the DSB sampler adjusts
the sampling rate based on the spectral support of the
Second International Conference on Telecommunications and Remote Sensing
130
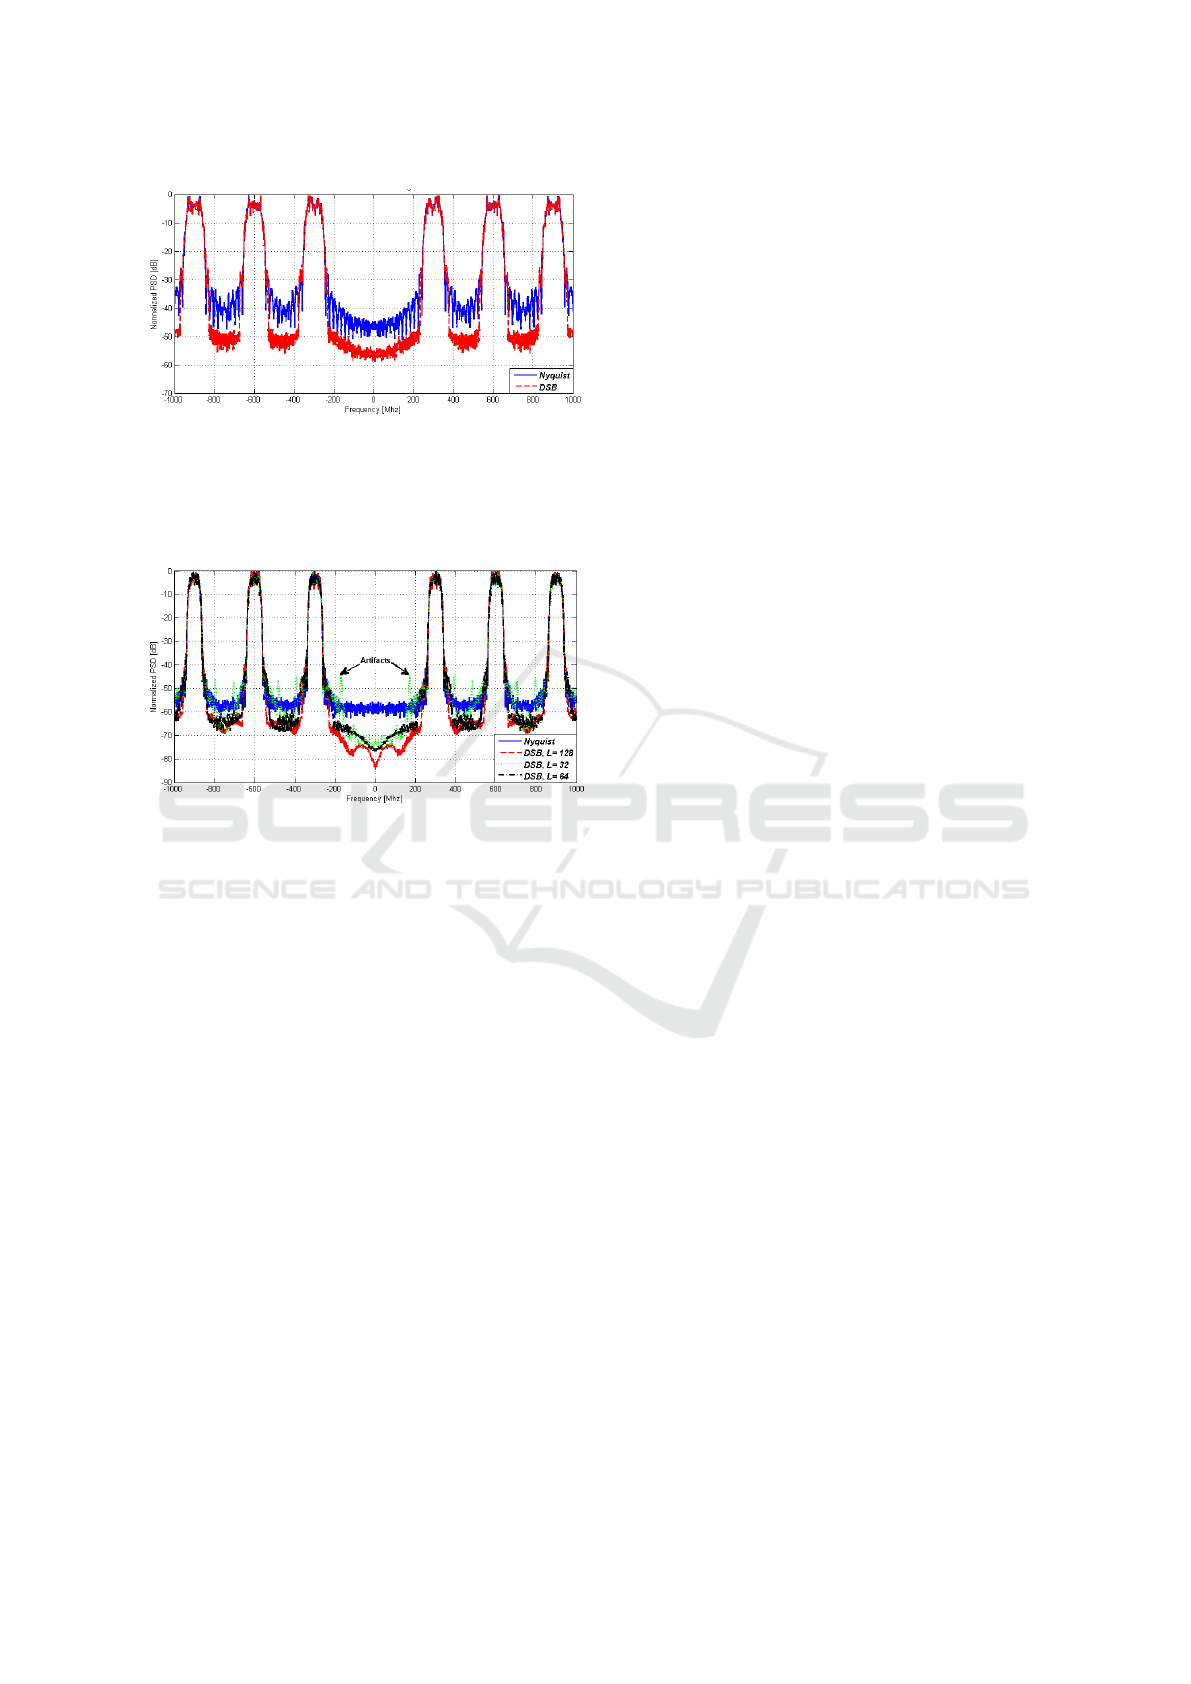
Figure 8: PSD with Lomb-Scargle method
input signal. From Figure 8, it can be seen that the
results obtained using DSB sampler are quite good.
Figure 9: Influence of the parameter L in the variation of the
PSD after DSB
Figure 9 shows the effect of the parameter L on
the estimated PSD from DSB samples. For L = 32,
spectral artifacts are observed in the estimated PSD,
as shown in Figure 9. But as L is increased these ar-
tifacts are eliminated. Therefore, it is clear that the
reconstructed spectrum is better when L increases.
6 CONCLUSIONS
In this paper we have presented some best known non-
uniform sampling techniques. JRS and ARS mode
gives approximately the same PSD without spectral
replicas but with a much smaller dynamic than Uni-
form samples PSD. These two techniques can be used
for spectrum sensing, condition not having a large dif-
ference in power between the bands. We dissassed
about a new sampler based on Multi-Coset sampling
scheme, which adjusts its sampling rate according to
the changes in the frequency spectrum of the input
signal. That is, if the signal is sparse in the frequency
domain, it samples at sub-nyquist rate, else it samples
at nyquist rate. We also saw the effect of the parame-
ter L on the estimated PSD from DSB samples.
ACKNOWLEDGEMENTS
This work is supported by the French “Region Bretagne”
for the projects “FUI AMBRUN” and “PME SoftRF”.
REFERENCES
Ben Romdhane, M. (2009). chantillonnage non uniforme
appliqu la numrisation des signaux radio multistan-
dard. PhD thesis.
Bourdoux A., Pollin S., D. A. and der Perre L., V. (2011).
Sparse signal sensing with non-uniform undersam-
pling and frequency excision. pages 246–250.
Bresler, Y. (2008). Spectrum-blind sampling and compres-
sive sensing for continuous-index signals. Informa-
tion Theory and Applications Workshop, 2008, page
547554.
Feng, P. and Bresler, Y. (1996). Spectrum-blind minimum-
rate sampling and reconstruction of multiband signals.
ICASSP, 3:16881691.
Landau, H. (1967). Necessary density conditions for sam-
pling and interpolation of certain entire functions.
Acta Mathematica, 117(1):37–52.
Miar, Y., D’Amours, C., and Aboulnasr, T. (2012). A
novel reduced power compressive sensing technique
for wideband cognitive radio. EURASIP J. Wireless
Comm. and Networking, page 281.
Mishali, M. and Eldar, Y. C. (2010). From theory to prac-
tice: Sub-nyquist sampling of sparse wideband analog
signals. Selected Topics in Signal Processing, IEEE
Journal of, 4(2):375–391.
Palicot, J. and al (June 2010). Radio Engineering: from
Software Radio to Cognitive Radio. John Wiley and
Sons.
Rashidi Avendi, M. (2010). Non-uniform sampling and re-
construction of multi-band signals and its application
in wideband spectrum sensing of cognitive radio.
Shapiro, H. S. and Silverman, R. A. (1960). Alias-free sam-
pling of random noise. Journal of the Society for In-
dustrial & Applied Mathematics, 8(2):225–248.
Tian, Z. and Giannakis, G. (2006). A wavelet approach to
wideband spectrum sensing for cognitive radios.
Tibshirani, R. (1996). Regression shrinkage and selection
via the lasso. Journal of the Royal Statistical Society.
Series B (Methodological), page 267288.
Traor
´
e, S., Aziz, B., and Guennec, D. L. (2013). Dynamic
single branch non-uniform sampler. DSP, Santoriri,
Greece, International Conference on Digital Signal
Processing.
Venkataramani, R. and Bresler, Y. (2000). Perfect recon-
struction formulas and bounds on aliasing error in
sub-nyquist nonuniform sampling of multiband sig-
nals. Information Theory, IEEE Transactions on,
46(6):21732183.
Venkataramani, R. and Bresler, Y. (2001). Optimal sub-
nyquist nonuniform sampling and reconstruction for
multiband signals. Signal Processing, IEEE Transac-
tions on, 49(10):23012313.
Wojtiuk, J. J. (2000). Randomised sampling for radio de-
sign. PhD thesis, Citeseer.
Zhang, H. (2010). Filter bank multicarrier (fbmc) for cogni-
tive radio systems. These de doctorat, Conservatoire
National des Arts et Metiers et Wuhan Universite.
Non-Uniform Sampling for Spectral Analysis of Multi-Band Signals
131
