
Bayesian Prognostic Model for Genomic Discovery in Bipolar
Disorder
Swetha S. Bobba
1,2,3
, Amin Zollanvari
2,3,4,6
and Gil Alterovitz
2,3,4,5
1
Vignana Bharathi Institute of Technology, Hyderabad, AP 501301, India
2
Center for Biomedical Informatics, Harvard Medical School, Boston, MA 02115, U.S.A.
3
Children’s Hospital Informatics Program at Harvard-MIT, Division of Health Science, Boston, MA 02115, U.S.A.
4
Partners Healthcare Center for Personalized Genetic Medicine, Boston, MA 02115, U.S.A.
5
Department of Electrical Engineering and Computer Science, MIT, Cambridge, MA 02139, U.S.A.
6
Department of Electrical and Electronics Engineering, Istanbul Kemerburgaz University, Istanbul, Turkey
Keywords: Bayesian Theory, Gene Expression, Bipolar Disorder, External Cross-Validation.
Abstract: Integrative approaches that incorporate multiple experiments have shown a potential application in the
discovery of disease-related attributes. This study presents a unique, data-driven, integrative, Bayesian
approach to merge gene expression data from various experiments into prognostic models and evaluate
them for the discovery of bipolar-related attributes. Two prognostic models were constructed: a singly-
structuredBayesian and a Bayesian multi-net model, which differentiated Bipolar disease state at a higher
level of abstraction. These prognostic models were evaluated to find the most common attributes
responsible for the disease and their AUROC, using external crossvalidation.
The multi-net model achieved an AUROC of 0.907 significantly outperforming the single-structured model
with an AUROC of 0.631. The study found six new genes and five chromosomal regions associated with
the bipolar state. Enrichment analysis performed in this study revealed biological concepts and proteins
responsible for the disease. We anticipate this method and results will be used in the future to integrate
information from multiple experiments for the same or related phenotypes of variousdiseases and also to
predict the disease state earlier.
1 INTRODUCTION
Over the past ten years, the emergence of high-
throughput genetic data has presented a new
opportunity for the development of diagnostic and
prognostic tools for disease and the discovery of
new disease-related genes (Clark et al., 2001),
(Collins et al., 2003). Previous studies have shown
an improvement in discovering disease-related
attributes by integrating the phenotypic content of
many experiments (Aerts et al., 2006), (Calvo et al.,
2006), (Freudenberg et al., 2002), (English et al.,
2007). Traditionally, however, these approaches
have been verified through comparison to gold
standard gene lists, which are themselves the
products of previous experiments. This is an
arbitrary method of validation, and even more
ominously, shifts the focus of bioinformatics
research away from discovery.
In the present study, we use a completely data-
driven Bayesian approach to discover bipolar
disorder attributes and validate them without
resorting to a priori information knowledge bases.
The topic of bipolar disorder warrants further
study for proper prevention and cure, as Bipolar
disorder (Beynon et al., 2009), (Schiffer, 2007),
(Benazzi, 2007), (Morriss et al., 2007), (Sachs et al.,
2007) affects approximately 5.7 million adult
Americans, or about 2.6% of the U.S. population age
18 and older every year and results in 9.2 years
reduction in expected life span, and as many as one
in five patients with bipolar disorder completes
suicide as per the National Institute of Mental
Health. Bipolar disorder causes a condition in which
people go back and forth between periods of a very
good or irritable mood and depression. The "mood
swings" between mania and depression can be very
quick.
Current diagnostic techniques like medication,
talk therapy depict Success rates of 70 to 85% with
lithium for the acute phase treatment of mania.
However, lithium response rates of only 40 to 50%
are now commonplace. The diagnosis is also
Bobba S., Zollanvari A. and Alterovitz G..
Bayesian Prognostic Model for Genomic Discovery in Bipolar Disorder.
DOI: 10.5220/0004642100910098
In Proceedings of the International Conference on Bioinformatics Models, Methods and Algorithms (BIOINFORMATICS-2014), pages 91-98
ISBN: 978-989-758-012-3
Copyright
c
2014 SCITEPRESS (Science and Technology Publications, Lda.)

sometimes misdiagnosed with depression in women
and schizophrenia in men. But the studyof high
throughput gene expression data shows potential in
developing more accurate prognostic and diagnostic
methods for fast prevention and cure of the disease.
The main goal of the present study is to create
unifying predictive models across multiple
experiments and to enable accurate prognosis and
diagnosis of Bipolar disorder. The statistical
modelling in this study is based on Bayesian
networks. Bayesian networks are directed acyclic
graph structures that extend Bayesian analysis
(Pearl, 1988), and are a set of multivariate
probabilistic models that have increased the power
in learning and classification due to their compact
factorization of data (Alterovitz, 2007), (Sebastiani
et al., 2005). Bayesian networks are powerful in
their ability to learn conditional relationships from
large datasets and to use this probability distribution
to classify other instances based on their feature
values. When they are used to represent biological
systems (Table S - 1), Bayesian networks create
models of simultaneous genetic associations and
dependencies, as well as genetic interplay with
clinical and environmental variables (Sebastiani et
al., 2005). These models are capable of capturing
weak epistatic dependencies between genes, and
previous studies have used Bayesian networks to
analyze many types of genome-scale data, including
genotype data (Sebastiani et al., 2005), gene
expression date (Friedman, 2004), and protein-
protein interactions.
Furthermore, the presented approach identifies
genes, biological functions, and pathways related to
disease that can serve as the basis for future studies.
Many construction approaches exist for Bayesian
networks. The NaiveBayes classifier, which requires
only a small amount of training data to estimate the
parameters (Mean and Variance of the variables)
necessary for classification is used in this model to
perform external cross-validation. Depending on the
precise nature of the probability model, naive Bayes
classifiers are trained very efficiently in a supervised
learning setting. This prognostic model can be used
to improve the accuracy of classification for a single
phenotype across multiple classes of patients as well
as different but related phenotypes.
In this project, Naïve Bayes classifier (Harry,
2004), (Caruana and Niculescu-Mizil, 2006),
(George and Pat Langley) is used to integrate several
bipolar disorder phenotypes in a predictive setting.
Table S-1: Classification of samples collected from
Bipolar disorder patients – Actual class Vs Predicted class
(Control, GDS2190 and GDS2191).
Predicted Class
Control
GDS2190 GDS2191
Class
Control 38
4 0
GDS2190 10 20 0
A
ctu
al
GDS2191 1
0 9
2 MATERIALS AND METHODS
2.1 Data Mining and Collection
Two Gene Expression Omnibus (GEO) datasets
from NCBI were used in this study and are stored
in GDS2190 and GDS2191 in various forms of the
Affymetrix microarray platform (Dalma-
Weiszhausz et al., 2006). These two GDS datasets
correspond to previous genome-scale experiments
that relate to bipolar disorder related phenotypes:
(1) GDS2190 (Ryan et al., 2006) contains 61
samples of GPL96, taken from homo-sapiens;
(2) GDS2191 (Ryan et al., 2006) contains 21
samples of platform GPL96, taken from
Homo-Sapiens
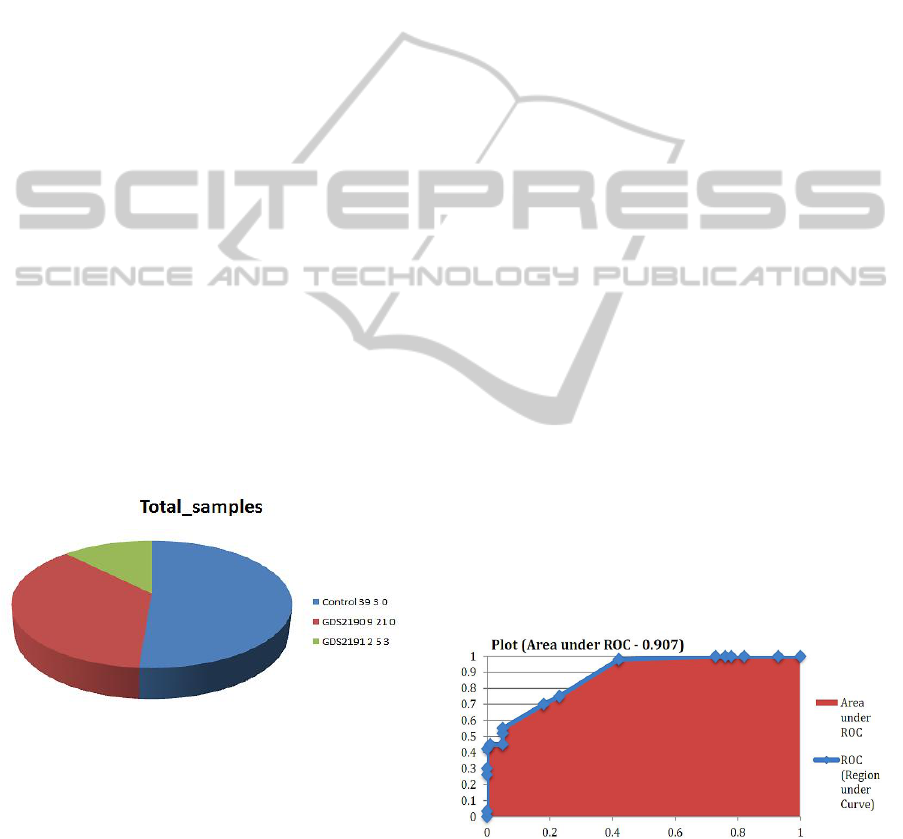
Total number of samples that correspond to
Control, GDS2190 and GDS2191 are shown in
Table(S-1) and plotted in Figure 1. For each GDS,
genes corresponding to multiple Affymetrix Probe
IDs were collapsed down to the maximum value.
The gene expression datawere normalized through
the reasonable assumption that the total gene
product in each individual is approximately equal.
The normalization was done by setting all means
and variances equal to the reference mean and
variance of data in GDS2190, such thatµ =
µGDS2190 and σ = σGDS2191. This second
normalization step was done in order to merge the
controls from all experiments.
2.2 Finding Differentially Expressed
Genes
Differentially expressed genes were found using
the Bioconductor package (Gentleman et al., 2005).
Moderated t-statistics (R Documentation,
http://rss.acs.unt.edu/) with Benjamini-Hochberg
multiple hypothesis correction(Benjamini and
Hochberg, 1995) ranked the top differentially
expressed genes of bipolar disorder infected
patients versus controls for each experiment by p-
value. Analyses were done to construct two
prognostic models of significant genes. The gene
obtained from Variance filtering of each
experimental gene list was compiled, and the genes
in common across these lists were considered the
shared-feature set.
2.2.1 Algorithm in R (to Generate Prognostic
Models)
1. Determine the Gene ID’s for Bipolar disorder
2. Find ALL Common Genes across all Gene ID’s
3. Separate the samples according to Control Vs
non-Control
4. Find Common Top differentially expressed
genes for each experiment
5. Create "interesting reduced experiments" (IREs),
which are essentially data tables that represent
each of the interesting experiments and their
expression data from each GSM sample. They
are "reduced" because only the data from the
common genes is included in each data table.
6. Normalize IREs by using a reference IRE,
finding its median, and subtracting the difference
between the reference median and the IRE's
median from each value in the IRE
7. Binarize the expValues for 1’s and 0’s
8. Create ARFF files stored as .txt file with the data
from these genes
Figure 1: Classification of samples collected from the
Bipolar disorder patients through GDS2190 and GDS2191
datasets, taken from NCBI.
2.3 Construction of Classifier
and Evaluation using External
Crossvalidation
For the present study, Weka GUI was used to find
the ‘best set of features’, build a classifier and
implement External Cross validation on the top
differentially expressed binarized genes to calculate
their AUROC. Linear forward selection search
method was used to filter the best attributes from a
given larger set. The evaluator evaluated the
attributes using an independent feature model called
Naïve Bayes classifier which assumes that the
presence (or absence) of a particular feature of a
class is unrelated to the presence (or absence) of any
other feature. While the search method is Extension
of BestFirst. It takes a restricted number of k
attributes into account. Fixed-set selects a fixed
number k of attributes, whereas k is increased in
each step when fixed-width is selected. The search
uses either the initial ordering to select the top k
attributes, or performs a ranking (with the same
evaluator the search uses later on). The search
direction can be forward or floating forward
selection (with optional backward search steps).
In external crossvalidation, thesamples were
divided into 10 subsets of approximately equal size.
In each iteration, nine subsets were used to find a
common-feature set and train the model. The final
subset is used to test the model. This procedure is
essential to correct the bias induced through feature
selection step. The Area Under Receiver Operating
Characteristic (AUROC) curve in Figure 2 was
estimated by averaging the AUROCs across the ten
folds.
2.3.1 Algorithm in Weka (to Perform
External Crossvalidaton)
1. Convert the .txt file obtained from R pipeline
into weka supported .arff file.
2. Extract the Best set of features using
AttributeSelectionClassifier in Weka GUI
3. Use Training Set to evaluate the Results of
External Cross-validation and calculate the
AUROC
Figure 2: Threshold curve with an AUROC of 0.907.
2.4 Biological Enrichment
We employed our newly developed prediction-based
Bayesian network analysis to find molecular
processes and pathways that are significant predictor

of phenotype. To determine molecular processes and
pathways we used Gene Ontology (GO) and Kyoto
Encyclopaedia of Genes and Genomes (KEGG). See
Table 2.
3 RESULTS
GEO DataSets (GDS) on the Affymetrix platform
17
related to Bipolar Disorder (Table S-1) were merged
to form a set of 40 infected patients and 42 control
patients. This set of samples was then used to
construct Bayesian prognostic model and perform
external cross validation on the results, for
predicting bipolar disorder disease genes.
Our unique contribution lies in validating the
multi-net prognostic model through a data-driven
approach by calculating the Area Under Receiver
Operating Characteristic (Bewick et al., 2004)
(AUROC) through External cross-validation(Braga-
Neto and Dougherty, 2005), (Ambrosie and
McLachlan, 2002) process that corrects the bias
induced through the feature selection
procedure(Ambrosie and McLachlan, 2002) (see
Materials and Methods for more detail). Prediction
based enrichment analysis (Harris et al., 2004) was
then used for the shared-feature gene set to reveal
pathways significant to Bipolar Disorder
outcomes(Kanehisa and Goto, 2000), (Watford et
al., 2004). The computed significant common-
feature genes for bipolar-disorder (Beynon et al.,
2009), (Schiffer, 2007), (Benazzi, 2007), (Morriss et
al., 2007), (Sachs, 2007) related, from the results of
external cross validation are shown in Table 1.
Enrichment analysis is shown in Table 2.
Figure 3: The prognostic accuracies of computed
significant common-feature genes with average AUROC -
0.907.
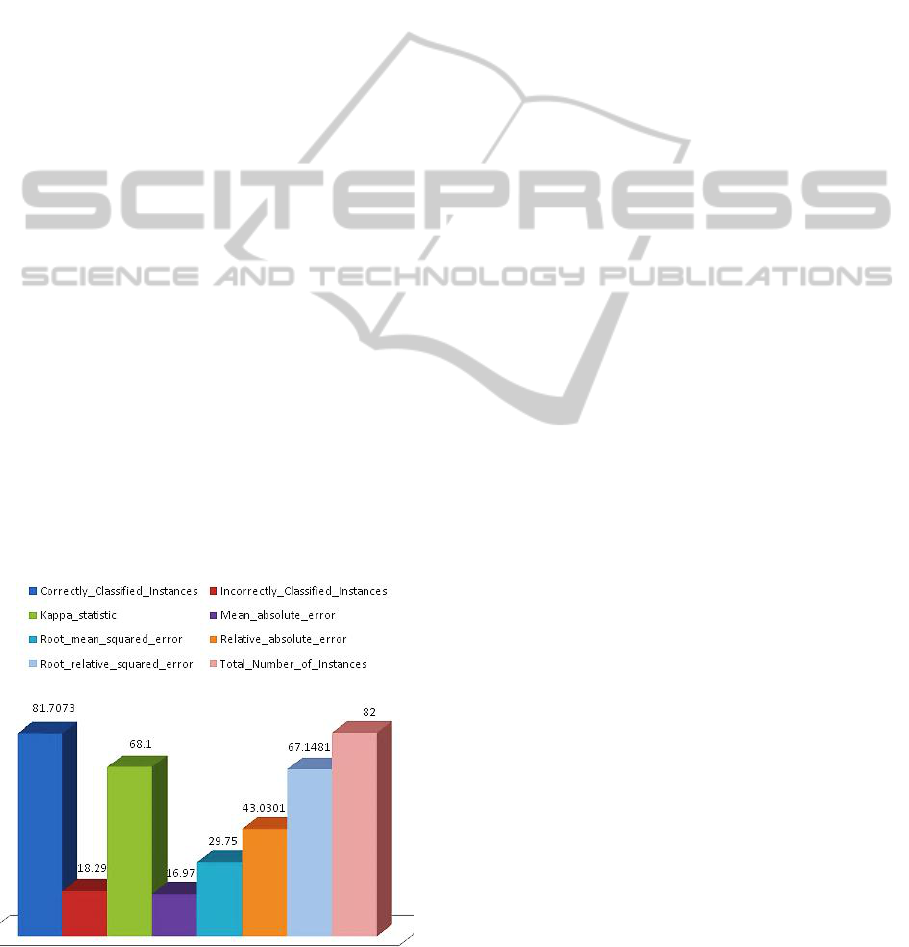
3.1 Result Analysis
The probability of correctly classified Instances and
errors after external cross validation showed that the
model outperformed well in predicting the disease
state genes from fewer samples by integrating
common controls via the multi-nets, with an
AUROC of 0.907 (as plotted in Figure 4).
The six genes found responsible for bipolar
disorder are:
3.1.1 ADH5
Alcohol dehydrogenase class-3 is an enzyme that in
humans is encoded by the ADH5 gene. This gene
encodes glutathione-dependent formaldehyde
dehydrogenase or class III alcohol dehydrogenase
chi subunit, which is a member of the alcohol
dehydrogenase family. Members of this family
metabolize a wide variety of substrates, including
ethanol, retinol, other aliphatic alcohols,
hydroxysteroids, and lipid peroxidation products.
This enzyme is an important component of cellular
metabolism for the elimination of formaldehyde, a
potent irritant and sensitizing agent that causes
lacrymation, rhinitis, pharyngitis, and contact
dermatitis. This gene has shown its influence on
Brain and Brain GAMG Cancer. Hence, studies are
further focussed on these relations for validation
through medical test.
3.1.2 MCL1
MCL1 (myeloid cell leukemia sequence 1 (BCL2-
related)) is a protein-coding gene. This gene encodes
an anti-apoptotic protein. Alternative splicing results
in multiple transcript variants. The longest gene
product (isoform 1) enhances cell survival by
inhibiting apoptosis while the alternatively spliced
shorter gene products (isoform 2 and isoform 3)
promote apoptosis and are death-inducing. Diseases
associated with
MCL1 include cholangiocarcinoma
,
and t-cell
leukemia, and among
i
ts relate
d
super-
pathways are Apoptosis and Immune response IL-22
signaling pathway. GO annotations related to this
gene include protein channel activity and protein
heterodimerization activity which reveal abnormal
behaviour in bipolar patients.
3.1.3 PDE1A
Cyclic nucleotide phosphodiesterases (PDEs) play a
role in signal transduction by regulating intracellular
cyclic nucleotide concentrations through hydrolysis
of cAMP and/or cGMP to their respective
nucleoside 5-prime monophosphates. Members of
the PDE1 family, such asPDE1A, are
Ca(2+)/calmodulin (see CALM1; MIM 114180)-
dependent PDEs (CaM-PDEs) that are activated by
calmodulin in the presence of Ca(2+). While the
PDE1A protein expression data from MOPED
reveals the interrelation of this gene with brain and
thus with bipolar, PDE1A is further validated
through medical test for thorough confirmation of its
presence in bipolar disorder patients.
3.1.4 ASPH
ASPH (aspartate beta-hydroxylase) is a protein-coding
gene. Diseases associated with ASPH include Brain
GAMG
Cancer, regular astigmatism,
and catecholaminergic
polymorphic ventricular
tachycardia. GO annotations related to this gene
include electron carrier activity and calcium ion
binding. An important paralog of this gene is
ASPHD2. This gene is thought to play an important
role in calcium homeostasis. The gene is expressed
from two promoters and undergoes extensive
alternative splicing.
3.1.5 NTM
NTM (neurotrimin) is a protein-coding gene in
brain. Diseases associated with NTM include
crimean-congo haemorrhagic fever, and
olivopontocerebellar atrophy. GO annotations
related to this gene include protein binding shown in
Table 2.
Figure 4: The plot of correctly classified instances and
incorrectly classified instances Vs Total Number of
Instances and errors after External Cross validation.
3.1.6 C8ORF44
C8ORF44 is chromosome 8 open reading frame 44
related to brain and hence also found to be
associated with bipolar disorder with an AUROC of
0.907
4 DISCUSSION
AUROC provides an objective metric for
quantifying predictor performance. An AUROC of
0.7 to 0.8 is considered “fair,” from 0.8 to 0.9 is
considered “good”, and from 0.9 to 1.0 is considered
“excellent” (Caruana and Niculescu-Mizil, 2006).
The multi-net classifier for Bipolar disorder across
classes of patients achieved ‘excellent’ performance.
However, the singly-structured model for Bipolar
disorder, whose structures were fixed across all
patients, only achieved ‘good’ performance. These
results indicate the power of this experiment-
integration framework as that:
(1) Merging controls in related experiments results
in a larger control group increasing the power of
association in learning and,
(2) The External cross validation improves the
results accuracy and determines the best genes
responsible for the disease
.
4.1 Newly Implicated Genes
and Chromosomal Loci
Using this integrative approach, new genes were
discovered by testing Bipolar disorder infected
patients from many experiments against a larger set
of merged controls. The six genes MCL1(Gene
MCL1), PDE1A(Gene PDE1A), ADH5(Gene
ADH5), ASPH(Gene ASPH), C8ORF44(Gene
C8ORF44) and NTM(Gene NTM) (Table 1, Figure
5) should be studied in the future context of Bipolar
disorder as these studies can shed some light on
these relationships and the functions of these genes
and gene products.
Analysis of these genes showed that five
significant chromosomal regions - Chromosomes 1,
2, 4, 8 and 11 (Figure 6) were significant in Bipolar
disorder. Because gene expression in nearby
chromosomal loci is strongly related, these
significant regions are of medical interest (Takizawa
et al., 2008).

Figure 5: Common-feature genes responsible for Bipolar
disorder resulted from External Cross validation with an
accuracy of 90.7%
Figure 6: Analysis of genes from all the multi-net models
showed that five significant chromosomal regions on
Chromosomes 1, 2, 4, 8 and 11 were significant in Bipolar
disorder due to the presence of the Genes MCL1, PDE1A,
ADH5, ASPH, CRO8F44 and NTM in them.
4.2 Enrichment Analysis and Features
in Bipolar Disorder Genes
Enrichment analysis of the shared-feature set (in
Table 1) reveal GO and KEGG biological concepts
related to bipolar disorder disease. Many of the
biological pathways with p-value <=0.05 have
shown to be associated with Bipolar Disorder genes.
Peptidyl-amino acid modification is the alteration of
an amino acid residue in a peptide which lowers in
bipolar disorder infected patients. Electron carrier
activity is a molecular entity that serves as an
electron acceptor and electron donor in an electron
transport system, present in ADH5 and ASPH.
Furthermore, Bipolar disorder was also found to be
associated with neoplasia (in Table 2) which needs a
further study.
The proteins with certain p-value in Table 3
specify the bipolar disease state in six genes –
MCL1, PDE1A, ADH5, C8ORF44, NTM, ASPH.
Table 1: The computed significant common-feature genes
for bipolar disorder related, from the results of external
cross-validation.
Gene Gene
Symbol ID Organism Gene Name
m
y
eloid cell leukemia
Homo sequence 1 (BCL2-
MCL1 4170 sapiens related)
Homo
p
hos
p
hodiesterase 1A,
PDE1A 5136 sapiens calmodulin-dependen
t
alcohol
dehydrogenase 5
(class III), chi
polypeptide,
pseudogene 4; alcohol
dehydrogenase 5
Homo (class III), chi
ADH5 128 sapiens polypeptide
Homo chromosome 8 o
p
en
C8ORF44 56260 sapiens reading frame 44
Homo as
p
artate beta-
ASPH 444 sapiens hydroxylase
Homo
NTM 50863 sapiens Neurotrimin
Table 2: Enrichment analyses of the shared-feature set
reveal GO and KEGG biological concepts related to
Bipolar Disorder.
Biological Concept
p-
value
GO:0018193~peptidyl-amino acid 0.0451
modification(ADH5, ASPH)
GO:0009055~electron carrier activity 0.0502
(ADH5, ASPH)
21275:lung_normal_3
r
d
(ADH5, NTM)
0.0234
519:pancrea_neoplasia_3
r
d
(ADH5, ASPH)
0.0277
38125:esophagu_neoplasia_3
rd
(ADH5,
0.0473
ASPH)
26751: lymph node_neoplasia_3
rd (
ADH5,
0.0485
ASPH)
BM-CD105+Endothelial_3
r
d
(MCL1,
0.0229
PDE1A, ASPH, C8ORF44, NTM)
Adrenal Cortex_3
rd
(MCL1, PDE1A,
0.0366
ADH5, ASPH)

Table 3: Proteins in Bipolar genes that specify the disease.
Proteins Genes p-Value
HFH3 MCL1, PDE1A, 0.0044
ADH5, ASPH,
C8ORF44, NTM
SRY MCL1, PDE1A, 0.0051
ADH5, ASPH,
C8ORF44, NTM
FREAC7 MCL1, PDE1A, 0.0110
ADH5, ASPH,
C8ORF44, NTM
LUN1 MCL1, PDE1A, 0.0129
ADH5, ASPH,
C8ORF44, NTM
FOXD3 PDE1A, ADH5, 0.0244
ASPH, C8ORF44,
NTM
4.3 Unique Contribution and Future
Work
This study presents a completely data-driven
approach to integrate phenotypic content from
multiple experiments, to discover significant bipolar
disorder-related genes and biological pathways, and
to verify their importance without resorting to a
priori information bases. External cross validation is
utilized as an integrative tool to construct the best
classifier for disease analysis and evaluate it using
best evaluation method. The multi-net model, used
for the first time in disease analysis with external
cross validation, showed huge improvements over
singly-structured models in predicting Bipolar
disorder state from gene expression. The results
demonstrate the involvement of six new genes and
five chromosomal regions in bipolar disorder that
should be targeted in future clinical studies. In the
future, we anticipate that this novel, data-driven and
prediction-based integrative approach will enable the
discovery of the genetic basis of many diseases.
5 CONCLUSIONS
Using this integrative approach, 6 Genes - MCL1,
PDE1A, ADH5, ASPH, C80RF44 and NTM were
identified as responsible for Bipolar disorder in
humans. Future studies can shed some light on these
relationships and the functions of these genes and
gene products. Results indicated that the Multi-
netmodel with external cross validation
‘outperformed’ singly-connected ones in predicting
Bipolar disorder disease state genes from gene
expression with an ‘excellent’ AUROC of 0.907.
We are also further working on implementing
this design on other pathologies for advanced
prevention and cure of diseases like Cancer, AIDS
etc.
ACKNOWLEDGEMENTS
We thank Vinnie Ramesh for his contribution in
writing the Binarization code for GDS Files. This
work was supported by grants 5R21DA025168-02
(G. Alterovitz), 1R01HG004836-01(G. Alterovitz),
and 4R00LM009826-03 (G. Alterovitz).
REFERENCES
Clark, P. A., te Poele, R., Wooster, R., and Workman, P.
(2001) “Gene Expression Microarray Analysis in
cancer biology, pharmacology, and drug development:
progress and potential”. In Biochem. Pharmacol., 62,
1311–1336.
Collins, F. S., Morgan,M., and Patrinos, A. (2003) “The
Human Genome Project: Lessons from Large-Scale
Biology”. In Science, 300, 286–290.
Aerts, S., Lambrechts, D., Maity, S., Van Loo, P.,
Coessens, B., De Smet, F., Tranchevent, L. C., De
Moor, B., Marynen,P., Hassan,B., et al. (2006) “Gene
prioritization through genomic data fusion”. In Nat.
Biotechnol., 24, 537-544.
Calvo, S., Jain, M., Xie, X., Sheth, S. A., Chang, B.,
Goldberger, O . A., Spinazzola, A., Zeviani, M., Carr,
S. A., Mootha,V. K. (2006) “Systematic identification
of human mitochondrial disease genes through
integrative genomics”. In Nat. Genet., 38, 576-582.
Freudenberg, J. and Propping, P. (2002) “A similarity-
based method for genome-wide prediction of disease
relevant human genes. Bioinformatics”, In 18 Suppl 2,
110-115.
English, S. B. and Butte, A. J. (2007) “Evaluation and
integration of 49 genome-wide experiments and the
prediction of previously unknown obesity-related
genes”. In Bioinformatics, 23, 2910-2917.
Pearl, J. (1988) “Probabilistic reasoning in intelligent
systems: networks of plausible inference”. Morgan
Kaufmann, New York.
Alterovitz, G., Liu, J., Afkhami, E., and Ramoni, M. F.
(2007) “Bayesian methods for proteomics”. In
Proteomics, 7, 2843–2855.
Sebastiani, P., Ramoni, M. F., Nolan, V., Baldwin, C. T.,
and Steinberg, M. H. (2005) “Genetic dissection and
prognostic modeling of overt stroke in sickle cell
anemia”. In Nat. Genet., 37, 435–440.
Friedman, N. (2004) “Inferring cellular networks using
probabilistic graphical models”. In Science, 303, 799–805.
Jansen, R., Yu, H., Greenbaum, D., Kluger,Y., Krogan, N.
J., Chung, S., Emili, A., Snyder, M., Greenblatt, J. F.,

Gerstein, M. (2003) “A Bayesian networks approach
for predicting protein-protein interactions from
genomic data”. In Science, 302, 449–453.
Friedman, N., Geiger, D., and Goldszmidt, M. (1997)
“Bayesian network classifiers”. In Machine Learning,
29, 131–163.
Beynon S, Soares-Weiser K, Woolacott N, Duffy S,
Geddes JR. “Pharmacological interventions for the
prevention of relapse in bipolar disorder: a systematic
review of controlled trials”. J Psychopharmacol. 2009;
23(5):574-591.
Schiffer R. B. “Psychiatric disorders in medical practice”.
In: Goldman L., Ausiello D., eds. Cecil Medicine.
23rd ed. Philadelphia, Pa:Saunders Elsevier;
2007:chap 420.
Benazzi F. “Bipolar disorder -- focus on bipolar II disorder
and mixed depression”. In Lancet. 2007;369:935- 945.
Morriss R. K, Faizal M. A, Jones A. P, Williamson P. R.,
Bolton C., McCarthy JP. “Interventions for helping
people recognise early signs of recurrence in bipolar
disorder”. In Cochrane Database Syst Rev.
2007;24;(1):CD004854.
Sachs G. S, Nierenberg A. A, Calabrese J. R, et al.
“Effectiveness of adjunctive antidepressant treatment
for bipolar depression”. In N Engl J Med.
2007;356:1711-1722.
Barrett, T., Troup, D. B., Wilhite, S. E., Ledoux, P.,
Rudnev, D., Evangelista, C., Kim, I.F., Soboleva, A.,
Tomashevsky, M., and Edgar, R. (2007) “NCBI GEO:
mining tens of millions of expression profiles –
database and tools update”. Nucleic Acids Res., 35,
D760–765.
Harry Zhang "The Optimality of Naive Bayes". In
FLAIRS2004 conference. (available online: PDF)
Caruana, R. and Niculescu-Mizil, A.: "An empirical
comparison of supervised learning algorithms". In
Proceedings of the 23rd international conference on
Machine learning, 2006. (available online PDF)
George H. John and Pat Langley (1995). “Estimating
Continuous Distributions in Bayesian Classifiers.
Proceedings of the Eleventh Conference on
Uncertainty in Artificial Intelligence”. pp. 338-345.
Morgan Kaufmann, San Mateo.
Dudley, J. T., Tibshirani,R., Deshpande,T., and Butte, A.
J. (2009) “Disease Signatures are Robust across
tissues and experiments”, Mol. Syst. Biol., 5, 307.
Dalma-Weiszhausz, D. D., Warrington,J., Tanimoto, E.
Y., and Miyada, C. G. (2006) “The Affymetrix Gene
Chip Platform: An Overview”. Methods Enzymol.,
410, 3–28.
Gentleman, R., Carey, V., Huber, W., Irizarry, R., and
Dudoit,S. (2005) “Bioinformatics and Computational
Biology Solutions Using R and Bioconductor”.
Springer, Heidelberg.
R. Documentation. “Empirical Bayes Statistics for
Differential Expression”. Available at http://
rss.acs.unt.edu/Rdoc/library/limma/html/ebayes.html
Benjamini, Y. and Hochberg, Y. (1995) “Controlling the
False Discovery Rate: A Practical and Powerful
Approach to Multiple Testing”. J. R. Stat. Soc. Series
B, 57, 289–300.
Boukaert, R. R. (2004) “Bayesian Network Classifiers in
Weka”. Available at http://mayor.dia.fi.upm.es/
~concha/SPAM/boukaert.pdf.
Chow, C. K. and Liu, C. N. (1968) “Approximating
Discrete Probability Distributions with Dependence
Trees”. IEEE Trans. Inf. Theory, 14, 462–467.
Bewick, V., Cheek, L., and Ball, J. (2004) “Statistics
review 13: receiver operating characteristic curves”.
Crit. Care, 8, 508–512.
Braga-Neto, U. and Dougherty, E. (2005)“Exact
performance of error estimators for discrete
classifiers”. Pattern Recognit., 38, 1799–1814.
Ambrosie, C. and McLachlan, G. J. (2002) “Selection bias
in gene extraction on the basis of microarray gene-
expression data”. Proc. Natl. Acad. Sci. U.S.A., 99,
6562– 6566.
Pines, J. M. and Everett, W. W. (2008) “Evidence-Based
Emergency Care: Diagnostic Testing and Clinical
Decision Rules”. In Blackwell.
Zollanvari, A., Huynh, K., Thomas, J., Wu, A., Deng, M.,
and Alterovitz, G. (2011) “Quantitative Prediction
Based Enrichment for Context-Based Analysis”.
Harris, M. A., Clark, J., Ireland,A., Lomax,J., Ashburner,
M., Foulger,R., Eilbeck, K., Lewis,S., Marshall, B.,
Mungall, C., et al. (2004) “The Gene Ontology (GO)
database and informatics resource”. Nucleic Acids
Res., 32, D258–261.
Kanehisa, M. and Goto, S.(2000) “KEGG: Kyoto
Encyclopedia of Genes and Genomes”. Nucleic Acid
Res., 28, 27–30.
Watford, W. T., Hissong, B. D., Bream, J. H., Kanno,Y.,
Muul, L., and O’Shea, J. J. (2004) “Signaling by IL-12
and IL-23 and the immunoregulatory roles of STAT4”.
In Immunol. Rev., 202, 139–156.9.
Takizawa, T., Meaburn, K. J., and Misteli, T. (2008) “The
Meaning of Gene Positioning”. In Cell, 135, 1313–
323.
Gene MCL1 (NCBI): http://www.ncbi.nlm.nih.gov/gene/
4170
Gene PDE1A (NCBI): http://www.ncbi.nlm.nih.gov/gene/
5136
Gene ADH5 (NCBI): http://www.ncbi.nlm.nih.gov/gene/
128
Gene ASPH (NCBI): http://www.ncbi.nlm.nih.gov/gene/
444
Gene C8ORF44 (NCBI): http://www.ncbi.nlm.nih.gov/ge
ne/56260
Gene NTM (NCBI): http://www.ncbi.nlm.nih.gov/ge
ne/50863
Ryan M. M., Lockstone H. E., Huffaker S. J., Wayland M.
T. et al. “Gene Expression Analysis of Bipolar
Disorder Reveals down regulation of the ubiquitin
cycle and alterations in synaptic genes”. In Mol
Psychiatry 2006 Oct;11(10):965- 78. MIDD:
16894394
