
Fine-Grained Provenance of Users’ Interpretations in a Collaborative
Visualization Architecture
Aqeel Al-Naser
1
, Masroor Rasheed
2
, Duncan Irving
2
and John Brooke
1
1
School of Computer Science, The University of Manchester, Manchester, U.K.
2
Teradata Corp., London, U.K.
Keywords:
Geospatial Visualization, Data Acquisition and Management, Provenance, Data Exploration, Query-Driven
Visualization.
Abstract:
In this paper, we address the interpretation of seismic imaging datasets from the oil and gas industry—a pro-
cess that requires expert knowledge to identify features of interest. This is a subjective process as it is based
on human expertise and thus it often results in multiple views and interpretations of a feature in a collabora-
tive environment. Managing multi-user and multi-version interpretations, combined with version tracking, is
challenging; this is supported by a recent survey that we present in this paper. We address this challenge via
a data-centric visualization architecture, which combines the storage of the raw data with the storage of the
interpretations produced by the visualization of features by multiple user sessions. Our architecture features a
fine-grained data-oriented provenance, which is not available in current methods for visual analysis of seismic
data. We present case studies that present the use of our system by geoscientists to illustrate its ability to
reproduce users’ inputs and amendments to the interpretations of others and the ability to retrace the history
of changes to a visual feature.
1 INTRODUCTION
One of the most powerful benefits that visualization
brings to data analysis is the ability to harness the
intuition of the user in the process of understanding
the data. Human visual abilities are particularly tuned
to respond to features embedded in three dimensional
space. In this paper, we consider seismic imaging data
which has a natural representation in the three dimen-
sions of physical space composed of subsurface layers
and is rich of geological features such as horizons and
faults.
In many cases, human intuition is supported by
algorithms that help to identify and highlight features
of the data. However, it can often be the case that
the algorithms cannot completely identify the features
of interest. Human intuition must complete the pro-
cess, and given the nature of intuition this can be a
source of differing interpretations depending on the
human expert. This may particularly occur in data
that is noisy or visually complex. Examples of such
data are found in medical imaging and in the field that
is the topic of this paper, interpretation of geophysi-
cal seismic imaging data (Robein, 2010). Thus we do
not have a single feature, but multiple interpretations
of a feature. At some stage, collaborative visualiza-
tion may be required for experts to discuss and rec-
oncile these different interpretations. We also need
to track the provenance of such interpretations; some-
times earlier interpretations may need to be revisited.
The process can be envisaged as being similar to the
source trees created by different programmers work-
ing on a large software project and the version con-
trol systems that have arisen to manage the process of
collaboration and integration. Conventionally, users’
interpretations are stored as geometric objects sepa-
rately from the data and possibly on different local
machines; therefore keeping track of these interpreta-
tions becomes very complex and error prone.
In this paper we propose a novel method of cre-
ating the objects that underlie such visual interpreta-
tions, in such a way that the information contained in
the interpretation is directly stored as metadata along-
side the original data. In addition to the ability of
users to experiment with local views of data, this pro-
vides support for the considered results of such ex-
periments to be stored, shared and re-used. In our
proposed architecture, users’ interpretations can flow
in the reverse direction from the usual pipeline, back
from the user’s interaction with the visual presenta-
305
Al-Naser A., Rasheed M., Irving D. and Brooke J..
Fine-Grained Provenance of Users’ Interpretations in a Collaborative Visualization Architecture.
DOI: 10.5220/0004650503050317
In Proceedings of the 5th International Conference on Information Visualization Theory and Applications (IVAPP-2014), pages 305-317
ISBN: 978-989-758-005-5
Copyright
c
2014 SCITEPRESS (Science and Technology Publications, Lda.)

tion of the objects to the original data source of the
pipeline. This pipeline features a fine-grained data-
oriented provenance, which is not available in cur-
rent methods for visual analysis of seismic data. We
utilize the increased capabilities of highly parallel
databases that allow flexible indexing and optimized
retrieval in response to data queries. Such databases
have been created to solve problems of “big data”
from the commercial world such as customer relation-
ship management and inventory and asset control.
In this paper, we apply our methods to the prob-
lems of the interpretation of data from geoseismic sur-
veys. This is a field that has received a great deal
of attention in terms of research (e.g. (Plate et al.,
2002; Castanie et al., 2005; Lin and Hall, 2007; Plate
et al., 2007; Patel et al., 2009; Patel et al., 2010; H
¨
ollt
et al., 2011)) as well as software development such
as Avizo Earth (Visualization Sciences Group, 2013),
GeoProbe (Halliburton-Landmark, 2013), and Petrel
(Schlumberger, 2013). The data in this field is noisy
and the features to be extracted have a very com-
plex spatial structure owing to processes of buckling,
folding and fracturing (Robein, 2010). This makes a
purely automated approach to feature extraction very
difficult to achieve. The expert interpretation is very
central to the definition of the features and the con-
siderations outlined above are of critical importance
(Bacon et al., 2003).
This paper presents a continuation of a work that
we have previously published (Al-Naser et al., 2013a;
Al-Naser et al., 2013b); here we present further anal-
ysis and evaluation. The contributions of this paper
are as follows:
1. A visualization architecture which allows captur-
ing multi-user understanding (interpretation) of
spatial datasets with a fine-grained data prove-
nance.
2. An evaluation of the proposed architecture by
geoscientists.
The structure of the paper is as follows. In Sec-
tion 2 we review related work. In Section 3 we show
the abstract principles of our fine-grained data-centric
visualization architecture. In Section 4 we describe
how we implement these principles in the field of geo-
science. In Section 5 we present the results of our case
studies, some performance measure, and a survey we
have conducted. Section 6 presents conclusions and
plans for future work.
2 BACKGROUND AND RELATED
WORK
2.1 The Visualization Pipeline
The visualization pipeline builds the visual objects
presented to the user in the form of a data process-
ing workflow that starts from the original data right
to the rendering on the display device. This basic
formulation has proved very durable and has under-
gone extensive elaboration since its formulation for
over twenty years (Moreland, 2013). A basic visual-
ization pipeline features the following modules in the
order of execution: reader → geometry generator →
renderer. Improvements and elaborations have been
proposed to address variety of issues such as visual-
izing multiple datasets, visualizing large datasets, and
enhancing performance and efficiency.
A fuller description of data by metadata enhanced
the power of visualization by allowing a more full-
featured view of the data, taking into account its spe-
cial properties and allowing users flexibility in cre-
ating visual objects. Using metadata, users can se-
lect a region or multiple regions to process, for ex-
ample this allowed Ahrens et al. to visualize large-
scale datasets using parallel data streaming (Ahrens
et al., 2001). In addition to regional information, a
time dimension can be added to metadata, adding time
control to the visualization pipeline (Biddiscombe
et al., 2007). The usefulness of metadata was fur-
ther developed with the introduction of query-driven
visualization (Stockinger et al., 2005; Gosink et al.,
2008). Query-driven pipelines require the following
technologies: file indexing, a query language and a
metadata processing mechanism to pass queries. For
fast retrieval, indexing technologies are used, such
as FastBit (Wu, 2005; Wu et al., 2009) (based on
compressed bitmap indexing) and hashing functions.
To handle massive datasets efficiently, the visualiza-
tion pipeline can be executed in parallel over multiple
nodes. This data parallelism can be implemented with
a variety of parallel methods, for example by MapRe-
duce (Vo et al., 2011). Database management sys-
tems (DBMS) are also capable of parallel execution
of analysis but were not widely used for the purpose
of visualization. A comparison between MapReduce
and DBMS was presented by Pavlo et al. (Pavlo et al.,
2009); the authors suggest that DBMS has a perfor-
mance advantage over MapReduce while the latter is
easier to setup and to use.
2.2 Data Provenance and Management
Provenance, or lineage, is metadata that allows re-
trieval of the history of the data and how it was de-
IVAPP2014-InternationalConferenceonInformationVisualizationTheoryandApplications
306

rived. Simmhan et al. (Simmhan et al., 2005) and
Ikeda et al. (Ikeda and Widom, 2009) in their sur-
veys categorize provenance techniques in different
characteristics, two of which are (1) subject, or type,
of provenance and (2) granularity. Data provenance
can be of two types: (1) data-oriented, or where-
lineage, which is a provenance applied on the data
explicitly answering the question of which dataset(s)
contributed to produce the output, and (2) process-
oriented, or how-lineage, which is a provenance ap-
plied on the process answering the question of how
the resulting output was produced from the input data.
Each of the two types can be applied on one of two
granularity levels: (1) coarse-grained (schema level)
and (2) fine-grained (instance-level). The latter deals
with individual data items separately.
The first software to bring the concept of prove-
nance into visualization was VisTrails (Bavoil et al.,
2005; Scheidegger et al., 2007). In VisTrails, the
changes to the pipeline and parameter values are cap-
tured, allowing to review and compare previous ver-
sions. Thus, following the taxonomy of provenance
by Simmhan et al. (Simmhan et al., 2005), VisTrails
can be classified as a process-oriented model. We
share a similar aim in respect to maintaining data
provenance, but our method differs in the type of
metadata that is being captured from the user’s vi-
sual exploration. We adopt a data-oriented prove-
nance model by explicitly storing metadata of the
data points of the interpreted features. This is due
to the nature of the data we deal with in this paper;
a process-oriented model is not sufficient in our case
as interpreted features are mainly a result of users’ vi-
sual understanding. This was highlighted in a recent
study on the value of data management in the oil and
gas industry (Hawtin and Lecore, 2011). The study
showed that human expertise contributed by 32.7%
towards understanding the subsurface data for the pur-
pose of interpretation; the other elements were data
which contributed by 38%, tools which contributed
by 15.1%, and process which contributed by 13.7%.
This means that human expertise is essential to inter-
pret the data, with a minor help from some tools (al-
gorithms). Despite such impressive development, the
evolution of the visualization pipeline has not (to our
knowledge) developed a reverse direction to directly
link the users’ understanding of the data back into the
dataset.
Data management is of a concern for systems with
an integrated visualization. MIDAS (Jomier et al.,
2009), a digital archiving system for medical images,
adopts a “data-centric” solution for massive dataset
storage and computing to solve issues like moving
data across networks for sharing and visualization.
The visualization of MIDAS was originally provided
through its web interface. Later, Jomier et al. (Jomier
et al., 2011) integrated ParaViewWeb, a remote ren-
dering service based on ParaView, with MIDAS to di-
rectly visualize the centrally located large datasets. In
the oil and gas industry, Schlumberger’s Studio E&P
(Alvarez et al., 2013), an extension to its commercial
software Petrel (Schlumberger, 2013), allows a multi-
user collaboration via a central data repository. Users
import a dataset to visualize and interpret from Studio
E&P to their local Petrel, then commit their changes
back to the central Studio E&P. These two recent ex-
amples, from the fields of medical imaging and oil
and gas, show us a trend toward centralizing users’
data to allow an efficient collaboration and ease data
management. These solutions offer a provenance of a
coarse-grained granularity, which deals with individ-
ual files as the smallest provenance unit. In this pa-
per, we continue with this direction of a data-centric
architecture via further integration into the visualiza-
tion architecture, based on a fine-grained granularity,
applying provenance to tuples in the database.
2.3 Seismic Imaging Data—The Oil and
Gas Industry
In this paper, we apply our method to seismic imaging
data from the oil and gas industry. To acquire seis-
mic data, acoustic waves are artificially generated on
the earth’s surface and reflect from subsurface geo-
logical layers and structures. Due to the variation of
material properties, these waves are reflected back to
the surface and their amplitudes and travel time are
recorded via receivers (Ma and Rokne, 2004). This
data is then processed to generate a 2D or 3D image
illustrating the subsurface layers. A 2D seismic pro-
file consists of multiple vertical traces. Each trace
holds the recorded amplitudes sampled at, typically,
every four milliseconds. Seismic imaging is then in-
terpreted by a geoscientist to extract geological fea-
tures such as horizons and faults. This interpretation
potentially identifies hydrocarbon traps: oil or gas. In
2011, the consumption of fossil fuels (oil and gas) ac-
counted for 56% of the world’s primary energy as cal-
culated by BP (BP, 2012b). By 2030, it is projected
that the demand of fossil fuels will continue to grow
(BP, 2012a). Thus, this industry requires to manage
and visualize its massive datasets more efficiently.
The SEG-Y format has been used by the indus-
try to store seismic data since mid 1970s. SEG-Y
structure consists of a textual file header, a binary file
header, and multiple trace records. Each trace record
consists of a binary trace header and trace data con-
taining multiple sample values; more details can be
Fine-GrainedProvenanceofUsers'InterpretationsinaCollaborativeVisualizationArchitecture
307
found in the SEG-Y Data Exchange Format (revision
1) (Society of Exploration Geophysicists, 2002).
Data in a SEG-Y file is stored sequentially and
therefore retrieval of seismic data for a 3D visualiza-
tion could negatively affect interactivity. For this rea-
son, seismic visualization and interpretation applica-
tions, such as Petrel (Schlumberger, 2013), offer an
internal format which stores seismic data in multi-
resolution bricks for fast access; this is based on the
Octreemizer technique by Plate et al. (Plate et al.,
2002). This has been a successful approach in visual-
izing very large seismic data. However, data manage-
ment is still a challenge, mainly in managing multi-
user interpretations and moving data between users
and applications; this was confirmed to us through
discussions with geoscientists from the oil and gas in-
dustry and through a survey which we present in Sec-
tion 5.3. Current seismic applications often use pro-
prietary internal formats and also represent and store
interpreted surfaces such as horizons and faults in ob-
jects stored separately from the seismic data.
2.4 Other Related Work
In order to maintain users’ data provenance coher-
ently with the data, we need to create data structures
that contain both; thus the original data becomes pro-
gressively enhanced as the users visualize it. An ar-
chitecture needs to be developed that can incorporate
this enhancement in a scalable manner. Al-Naser et al.
(Al-Naser et al., 2011) were first to introduce the con-
cept of feature-aware parallel queries to a database in
order to create a volume in real time ready for direct
volume rendering. In this approach, features—which
are classically represented by meshes—are stored as
points tagged into the database; thus queries are
“feature-aware.” Their work was inspired by Brooke
et al. (Brooke et al., 2007) who discussed the impor-
tance of data locality in visualizing large datasets and
exploited the (then) recently available programmable
GPUs for direct rendering without the creation of ge-
ometric objects based on meshing. This definition of
“feature-aware” differs from that used by Zhang and
Zhao (Zhang and Zhao, 2010) in which an approxima-
tion is applied for time-varying mesh-based surfaces
to generate multi-resolution animation models while
preserving objects’ features.
With the rapid advances in the capabilities of
GPUs, direct volume rendering techniques such as
3D texture slicing (Mcreynolds and Hui, 1997) and
GPU-based ray casting (Hadwiger et al., 2009) have
become more efficient for interactive visualization on
a large uniform grid. The latter was inspired by the
introduction of shading languages such as OpenGL
Shading Language (GLSL). We exploit such standard
techniques in our architecture to support the primary
claim in this paper; we plan to utilize other advanced
techniques in future to deal with different data struc-
tures, e.g. unstructured spatial data.
3 DATA-CENTRIC
VISUALIZATION
ARCHITECTURE
In this section, we present our solution at an abstract
level; in the next section (4) we discuss its implemen-
tation in the field of geoscience for the oil and gas
industry in particular. Using standard technologies,
we propose a data-centric visualization architecture
which stores users’ interpretations back to the cen-
tral database for reusability and knowledge sharing.
We choose to build our data structure in a parallel re-
lational database management system (RDBMS); we
call this spatially registered data structure (SRDS)
(Section 3.1). Since our data structure is stored in a
relational database rather than in raw image files and
geometric objects, we require an intermediate stage
which builds in real time a volume in a format which
can be directly rendered on the GPU. We call this
a feature-embedded spatial volume (FESVo) (Section
3.2).
SRDS
on MPP Database
FESVo 1 Renderer 1
FESVo 2 Renderer 2
User 1
User 2
User's Interpretation
User's Interpretation
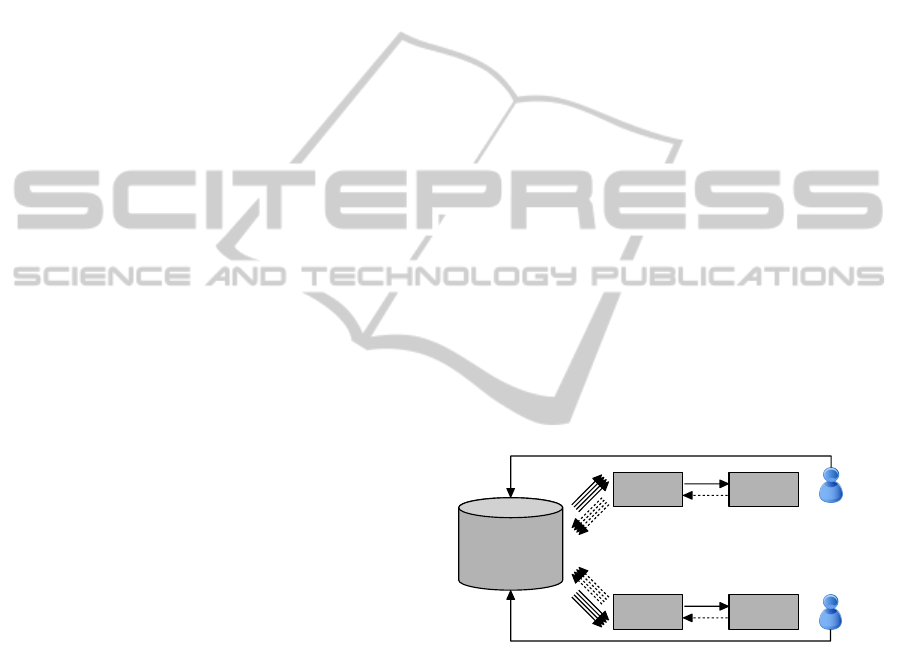
Figure 1: This is a conceptual diagram of a data-centric
visual analysis architecture which consists of three loosely
coupled components. The (1) spatially registered data struc-
ture (SRDS) in a centrally located database is linked to mul-
tiple on-the-fly created (2) feature-embedded spatial vol-
umes (FESVo) through parallel connections. FESVo is
linked to (3) a renderer engine. Users’ interpretations are di-
rectly fed back to SRDS; FESVo is then refreshed. Dashed
arrows indicate SQL queries from FESVo to SRDS (0.2–
0.7KB each) or requests for a texture buffer from a ren-
derer to FESVo. Full arrows indicate data units transfer
from the database to FESVo (around 4KB each), a texture
buffer from FESVo to a renderer (multiple Mbytes) or up-
dates from users to SRDS.
As illustrated in Figure 1, the architecture links
the SRDS on a database to one or more on-the-fly cre-
ated FESVo through parallel feature-aware and global
IVAPP2014-InternationalConferenceonInformationVisualizationTheoryandApplications
308

spatially-referenced queries which results in a par-
allel streaming of data units. FESVo, on the other
side, is linked to a rendering engine. Users’ inter-
pretations are stored back to SRDS. In our current
work, we directly store interpretations to SRDS and
rebuild the intermediate local volume (FESVo) with
the newly added data; in future work we can optimize
this by caching users’ interpretations in FESVo then
later store it into SRDS.
3.1 Spatially Registered Data Structure
(SRDS)
We follow the direction of a data-centric architecture
as in MIDAS (Jomier et al., 2009) (discussed in Sec-
tion 2.2) to maximize data access by multiple users
and thus provide efficient sharing. Our data structure
is fine-grained so that each voxel-equivalent data unit
is stored as a tuple, a row in a database. To support
querying of tuple-based provenance (Karvounarakis
et al., 2010), we restructure our data into a relational
form. As a result, our visual analysis method shifts
from the classic static raw file system into a central
data structure built on a relational database. This
also caters for the highly-structured relational mod-
elling required by the integrated analytics paradigm
of enterprise-scale business computing.
This structure principally features:
1. global (geographical) spatial reference on all data
tuples,
2. interpretation tagging which accumulate users’ in-
terpretations into the database,
3. concurrent access allowing parallel multi-
threading queries from multiple users.
Figure 2 illustrates an abstract database schema of
fundamental requirements of SRDS, with no field im-
plementation. Table SRDS holds raw spatial datasets
and users’ spatial interpretations in a fine-grained
structure where each point in a 3D space is stored as
a tuple (row). The data is indexed on the combination
of (x,y) coordinate and source ID (src id). A source
ID groups data units of one source under a unified
identification (ID). The property ID (prop id) field de-
scribes the type of the property value (prop val) exists
at an (x,y) location. For example, a property ID of 1
describes a seismic trace type data, a property ID of 2
describes a horizon geological feature, and a property
ID of 3 describes a fault geological feature. The verti-
cal distance (z) adds a third dimension and timestamp
(ts) allows versioning.
Table SRC serves as a source metadata ta-
ble. It identifies the type of a source (e.g.
raw readings, user-interpretation, etc). Table
SRDS
src_id integer
x decimal (18,5)
y decimal (18,5)
z decimal (18,5)
ts timestamp
prop_id integer
prop_val decimal (18,5)
SRC_SRC_GRPING_HIST
src_grp_id integer
src_id integer
src_grp_src_rel_type_cd integer
src_src_grp_eff_ts timestamp(0)
src_src_grp_end_ts timestamp(0)
SRC
src_id integer
src_ds varchar(9000)
src_type_id integer
1
n
1
n
Figure 2: This diagram illustrates the abstract SRDS
schema. Abbreviations used here are as follows; src id:
source identification; src ds: source description; ts: times-
tamp; prop: property; rel type cd: relation type code;
eff ts: effective timestamp; end ts: end timestamp.
SRC SRC GRPING HIST (source-to-source
grouping history) allows data provenance. The
table links related interpretations and determines the
relation type: e.g. insertion or deletion. The different
source ID for each source of an interpretation and the
timestamp field make this operation possible.
3.2 Feature-Embedded Spatial Volume
(FESVo)
Since our data is restructured into a fine-grained form
in SRDS, we need an intermediate stage to prepare
data for rendering; we call this a feature-embedded
spatial volume (FESVo). FESVo’s primary roles are
to (1) load data, (2) cache data, and (3) capture users’
interpretations.
First, FESVo uses the indexing and parallel ca-
pabilities of the data structure to perform parallel
queries, and an on-the-fly downsampling if a lower
resolution is required, resulting in an intermediate
volume which can be directly rendered on the GPU.
Conventionally, data in 3D spatial volumes is stored
in a firmed order and thus it can be read sequentially.
However, an SRDS single datum is queried against its
geographical location. Therefore, the loading mech-
anism in FESVo maps between the different coordi-
nate systems: (1) geographical coordinate in SRDS,
(2) intermediate volume coordinate in FESVo, and (3)
texture coordinate in the GPU. We use a standard ren-
dering technique to visualize this volume which is the
Fine-GrainedProvenanceofUsers'InterpretationsinaCollaborativeVisualizationArchitecture
309

data supplied by SRDS format. In Section 4.2, we
explain how we implement this process for seismic
imaging data.
Second, FESVo also acts as a data cache. The
loaded dataset is cached and thus users can fully in-
teract with and interpret it if the connection with
SRDS is lost. Third, FESVo captures users’ visual
interpretations along with provenance metadata. The
captured interpretation is mapped back from a local
(FESVo) coordinate into a fine-grained geographical
coordinate (SRDS).
4 IMPLEMENTATION FOR
GEOSCIENCE
In this section, we first discuss the extension of SRDS
and how data is initially prepared into it. Then, we
discuss the continuous loading process by FESVo
and how multiple users can contribute and track his-
tory. Finally, we briefly describe our rendering engine
which renders the data loaded by FESVo.
4.1 SRDS for Geoscience
We extend SRDS from its abstract version (Figure 2)
to deal with geological and geophysical data. We im-
plement SRDS on a Teradata database; thus we use
standard SQL for queries and data updates. We use a
hashing index in our tables; this allows an on-the-fly
indexing using a hashing algorithm for direct access
to data units and efficient update.
Figure 3 illustrates the extended database schema
of SRDS for geoscience. We add a dedicated table for
seismic traces (raw data), SRDS TRACE. The main
difference between the SRDS and SRDS TRACE ta-
bles is the type of the property value (prop val) field.
The property value field of SRDS TRACE table is
of a customized binary-based type to hold trace sam-
ples; this is equivalent to a 1D dataset. Thus, the
granularity of SRDS TRACE table, which is a 1D
dataset in a tuple, is coarser than SRDS table, which
is a single point datum in a tuple. For SRDS table,
the property value (prop val) field may either rep-
resent a single measured value (e.g. porosity, per-
meability) or an identification of a geological body
(e.g. horizon) to this tuple; we adopt the latter at this
stage. Thus, we store users’ interpretations of geo-
logical features as a cloud of points; each point is in
a row. Table SRC is extended to fully describe sub-
surface (seismic) datasets. It determines the boundary
of the dataset and range of the amplitude values in the
trace sample.
Using a hashing algorithm (Rahimi and Haug,
2010), the location of the required row can be deter-
mined through hashing functions without a construc-
tion or storage complexity; this is a feature offered
by Teradata DBMS. This allows retrieval and writing
back from and to the database at a complexity that is
proportional only to the working dataset (the size of
the dataset being retrieved or written back) and not to
the total size of the tables.
4.1.1 Data Input into SRDS
In our case, the data is initially prepared from SEG-Y
files and geometry as illustrated in Figure 4. We start
from post-stack 3D seismic conventional files (SEG-
Y format) and extract traces, which are 1D vertical
subsurface readings of amplitude values. The trace
data is loaded into the database tagged with its geo-
graphical location, which is extracted from the trace
header. Geological features, which were previously
interpreted by users, are obtained in the form of ge-
ometry. This is converted into an (x,y,z) cloud of
points and loaded into the database. Then, the on-
going users’ amendments to the features are directly
stored in the same format, as a cloud of points with
proper tagging and provenance metadata.
4.2 Data Loading
The data loading processes to render a dataset are as
follows. A rendering engine requests a ready tex-
ture buffer to be directly rendered from FESVo based
on a user request of desired datasets. Inside FESVo,
a data loader calculates FESVo’s current dimension
and performs coordinate mapping (described in Sec-
tion 4.2.1) between SRDS, FESVo and the GPU tex-
ture buffer. Upon the user’s request, the data loader
calculates the fine-grained data units (tuples) required
to build the texture buffer. For each data unit, it first
checks its internal cache. The data unit, if found, is
placed in the texture buffer at the computed (mapped)
position. If a data unit is, otherwise, not cached, the
unit is added to one of a number of queues in a load
balancing manner. Each queue is associated with a
thread. After completing the search in the internal
cache of FESVo, the threads start, each with its queue
of data units (locations) to be concurrently fetched
from the database. Each fetched data unit is loaded
to FESVo and placed in the texture buffer at the com-
puted position. As we are using a hashing algorithm
to index the dataset, data retrieval is performed at a
complexity of O(k), where k is the number of data
units being fetched from the database; this is inde-
pendent of the total size of the table (dataset).
IVAPP2014-InternationalConferenceonInformationVisualizationTheoryandApplications
310
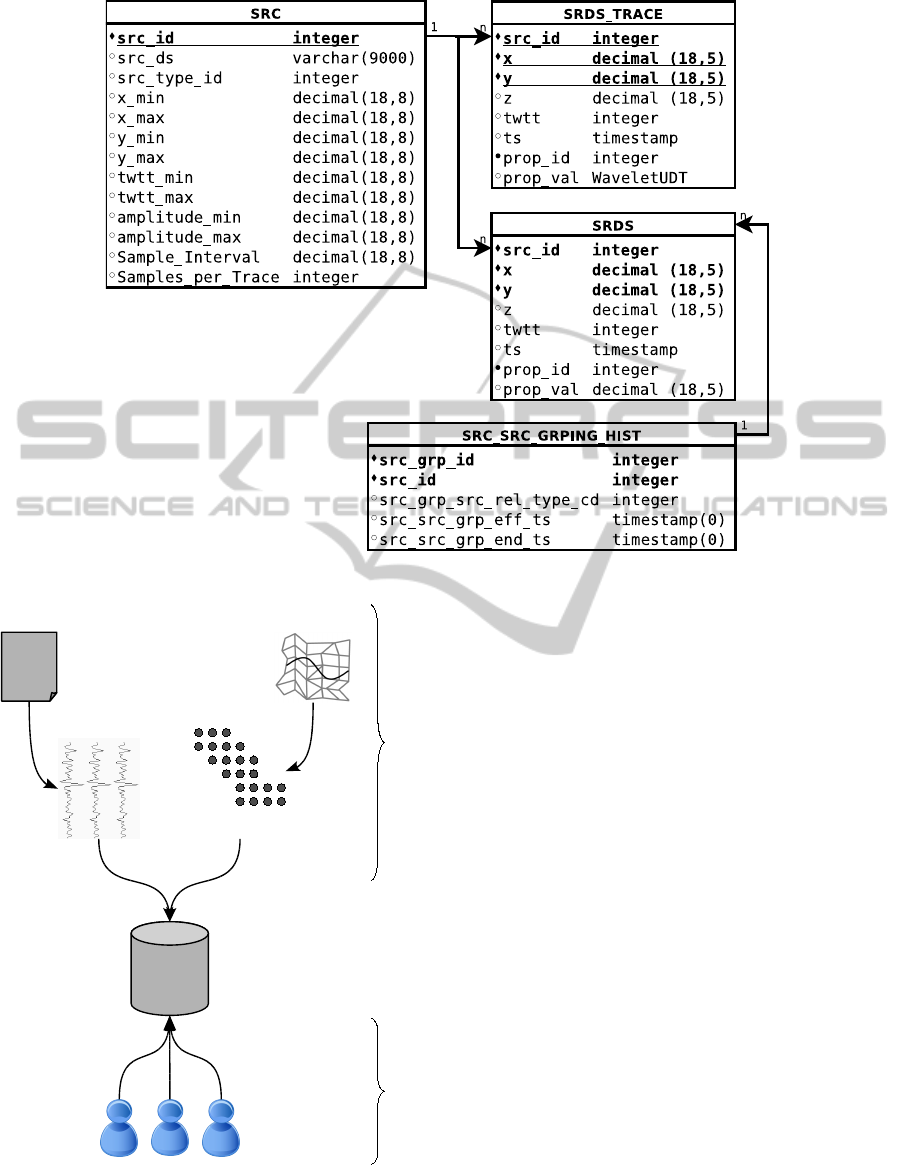
Figure 3: This diagram illustrates the extended SRDS database schema for geoscience (twtt: two-way-travel time).
Raw
File
grid
(x
1
,y
1
) (x
1
,y
2
) (x
1
,y
3
)
SRDS
Database on
MBB Platform
Geological Features
(Geometry)
(x,y,z)
points
grid
On-going users amendment
Initial Data Preparation
points + tags
Figure 4: Seismic datasets on the database is initially pre-
pared from SEG-Y files for raw data and geometry files
for geological features. Amendment to feature objects (ad-
dition/deletion) is later updated directly from users to the
database.
4.2.1 Coordinate Mapping and Levels-of-Detail
The architecture deals with three coordinate systems:
(1) texture coordinate (s, t, r)—as in OpenGL, (2)
local volume coordinate (localX, localY, localZ) per
level-of-detail, and (3) global geographical coordinate
(x, y, z).
The mapping between coordinates takes place on
the X-Y plane. At this stage of our work, no map-
ping is performed on the z-axis; a seismic trace is fully
loaded to a 1D texture location (s, t). This is because
the trace length of raw seismic data is, usually, fixed
across one dataset and relatively small, around 200 to
2000 samples per trace; each sample is a 4-byte float-
ing point.
As illustrated in Figure 5, seismic data is not per-
fectly gridded but regularly distributed. Thus, we
can divide the region into GIS cells of equal areas,
each containing one trace. Each GIS cells corre-
sponds to a 2D location in the local volume. This lo-
cal volume now becomes the highest resolution level
(LOD0). Each subsequent level halves the dimension
of its previous one; i.e. we rely on a decimation-
based technique for downsampling. Since SRDS and,
thus, the calculated GIS cells are regularly structured,
a low resolution image can be obtained through direct
downsampling; cells of higher levels-of-detail (lower
resolution) are mapped to cells at LOD0 based on a
Fine-GrainedProvenanceofUsers'InterpretationsinaCollaborativeVisualizationArchitecture
311

Mapping
& Gridding
(0,0) (1,0)
(0,1)
GIS Cell
i
(xTrue, yTrue)
i
SRDS
(Global Reference)
FESVo
(Local Reference)
Figure 5: Seismic traces (illustrated as x) are not perfectly
gridded, but the region can be divided into “GIS cells”
where each cell contains a trace. Each GIS cell can then
be mapped to a local point in FESVo.
regular decimation. Only one resolution version (the
highest) of the dataset exists and real-time mapping is
performed for lower resolution levels. The slight al-
teration as a result of the gridding (from a non-perfect
grid in the real-world to a perfect grid in the local vol-
ume) is accepted by the industry.
4.2.2 Data Lookup
A GIS cell, in our seismic case, holds a subsurface
dataset under a rectangular area (e.g. 12 × 12 me-
ter square) of the real-world. In texture world, this
is mapped to a single 1D dataset. To search inside a
GIS cell in the database, we can choose between two
modes: (1) general discovery mode and (2) specific
cached mode. We maintain both modes and perform
one depending on the task.
In the first mode, we have no knowledge in ad-
vance about the exact coordinates of the data units;
thus it is a discovery mode. To query the database
for a dataset which lies in a GIS cell, we explicitly
query every possible location (x,y) with a minimum
step (e.g. 1 meter). The reason why explicit values
of x and y are provided in the query is to perform
hash-based point-to-point queries and avoid a full ta-
ble scan by the database. Due to the massive size of
seismic datasets and because we place all raw seismic
datasets in a single table for multi-datasets access, we
always attempt to avoid a full table scan which leads
to a decrease in performance.
In the specific mode, we pre-scan the tables for the
required region and dataset source(s) and then cache
all the (x,y) coordinates, using a sorted table. Start-
ing with the texture coordinate we need to load, the
mapped geographical coordinate is calculated: (xIni-
tial, yInitial). As all valid data coordinates are cached
on the client, we can efficiently look for a point
(xTrue, yTrue) which lies on the location of the cur-
rent GIS cell. Having a valid and explicit coordi-
nate, a point-to-point query is executed per required
GIS cell. This mode overall performs at a complex-
ity of O(k), where k is the number of data units re-
turned; this is regardless of the table size and number
of datasets in the table.
4.3 Multi-user Input with History
Tracking
Using the structure explained in Section 3.1, multiple
users can interact by adding or changing others’ inter-
pretations while maintaining data provenance. For a
user to insert some interpretations as an extension to
another user’s work, we do the following. We create
a new entry in the grouping table linking the user’s
source ID to the source ID of the original interpreta-
tion to which the extension is applied. In this entry we
insert a timestamp and the relation type of this group-
ing which is insertion in this case, since the user is
inserting a new interpretation. Then, we insert the
points which form the user’s new interpretation into
the features table with his/her user ID and the earlier
timestamp inserted in the grouping table. In the case
of deleting a previously created interpretation, the re-
lation type would be deletion instead and we insert the
points which the user wants to delete in the features
table with his/her ID and the grouping timestamp. By
doing so, we accumulate users’ interpretations and do
not physically delete but tag as deleted so users can
roll back chronologically.
To retrieve a geological feature which involved
multiple users in interpretation, we query the database
such that we add points of an insertion relation type
and subtract points of deletion relation type. Such
points can be identified via the source ID and times-
tamp, linked to the grouping table.
Referring to Section 4.3, we retrieve a geologi-
cal feature, which was interpreted by multiple users,
by performing the following pseudo query, where ts
means timestamp.
SELECT p o i n t s from SRDS
WHERE s o u r c e i d = < b a s e l i n e >
UNION
SELECT p o i n t s from SRDS
JOIN g r o u p i n g t a b l e
ON s o u r c e i d
AND t s
AND r e l a t i o n t y p e = INSERTION
EXCEPT
SELECT p o i n t s from SRDS
JOIN g r o u p i n g t a b l e
ON s o u r c e i d
AND t s
AND r e l a t i o n t y p e = DELETION
In this query, the baseline is the original inter-
IVAPP2014-InternationalConferenceonInformationVisualizationTheoryandApplications
312

pretation which was first imported from an external
source. We control the history tracking by manipulat-
ing the timestamp value.
4.4 Rendering Engine
At this stage, we adopt a back-to-front textured
slice mapping rendering technique (Mcreynolds and
Hui, 1997) along with a shader program, using
OpenGL Shader Language (GLSL). Two texture ob-
jects (buffers) exist at any time: one for seismic raw
data (volumetric datasets) and the other one is for all
geological features.
5 RESULTS AND CASE STUDIES
In this section, we first present a case study performed
by geoscientists from a university geoscience depart-
ment. Then, we present some performance measures.
For these we used Teradata DBMS, running virtu-
ally on a 64-bit Windows Server 2003. Both FESVo
and the renderer engine were deployed on laptop and
desktop machines equipped with graphics cards of
256MB to 1GB of memory. Finally, we present and
discuss a survey that we recently conducted on staff
from the oil and gas industry as well as geoscientists
from academia.
5.1 Case Study on Geoscientists
Six geoscientists from a university geoscience depart-
ment participated in this case study. The participants
were divided into three sessions. At each session, the
participants were given an explication of the system
and the purpose of the case study. Then each of the
two participants in a session was given an access to
the system, and were guided to load the same dataset
at the same time from the centrally located database.
First, all participated geoscientists confirmed that
the dataset was rendered correctly; their commercial
software was considered as a guideline. We asked
them to confirm this since the data in SRDS is com-
pletely restructured and thus this confirmation verifies
our reconstruction (loading) method.
The participants were then asked to perform the
following selected tasks using our system. For them,
these cases are simple core tasks that may take part
in their interpretation work flow. We selected these
tasks only for the purpose of demonstrating the func-
tionality of our architecture, such that provenance of
users’ interpretations is maintained using a two-way
fine-grained visualization pipeline with a central re-
lational database. In the following, we define a task
then explain how it is technically achieved using our
architecture.
5.1.1 Task 1: Multi-User Horizon Time Shifting
In this task, one user was asked to adjust a horizon
by shifting its two-way-travel time (TWTT). Graph-
ically, this time is the z axis of an early-stage seis-
mic imaging data; it is later converted into real depth.
The process of time shifting a horizon can be done in
several ways in respect to selecting where the shift is
applied. In our implementation, we allow the user to
select the following:
1. the horizon to which the shift is applied
2. a seed point
3. a shift value (+/-) (e.g. 50 milliseconds)
4. a diameter value to which the shifting is applied
(e.g. 400 meters)
After setting these parameters, the time-shifting
is implemented as follows. We start a deletion type
grouping in SRDS linked to the original interpreta-
tion source ID and tagged with this user ID and a
current timestamp. Then, all points lying within the
selected diameter are inserted into the database in par-
allel threads, tagged with the user ID and the times-
tamp. Next, we end the deletion type grouping and
start an insertion type grouping in SRDS with the
same user ID but a new timestamp. Then, all points
laying within the selected diameter are inserted into
the database in parallel threads, with a new time value
calculated in respect to the original value (this calcu-
lation is performed on the database) and tagged with
the user ID and the new timestamp. Finally we end
the grouping. Thus, user amendments are saved while
the original interpretation is also maintained centrally
with the original dataset. These steps are illustrated in
Figure 6.
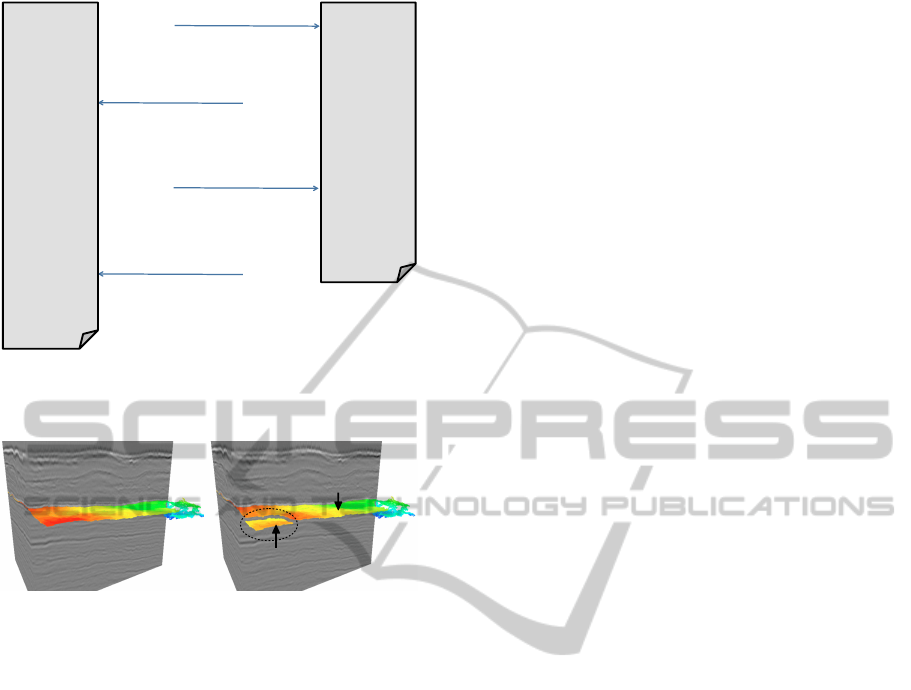
After the time-shift task was completed (took
around 2-4 seconds), the second user in this session
refreshed the application’s view and was able to im-
mediately visualize the changes on the horizon made
by the first user. Figure 7 illustrates a similar view of
this result.
In Figure 7, the original horizon, as shown in the
left screenshot, consisted of 160, 330 points (each is
stored as a row in SRDS). The process of time-shift,
as shown in the right screenshot, resulted in 1, 560
points tagged as deleted (from the original interpreta-
tion) and the same number of points (1, 560) tagged as
inserted (forms the shifted area). Thus, a total num-
ber of 163, 450 points form this horizon including its
provenance and new changes; this is a result of a fine-
grained granularity model. In comparison to a coarse-
grained (file-based) granularity, any small change to a
Fine-GrainedProvenanceofUsers'InterpretationsinaCollaborativeVisualizationArchitecture
313
1.#Dele$on'grouping'
Original#&#User’s#Source#IDs#
Timestamp#=#t1#
2.#Affected'Points'
User’s#Source#ID#
Timestamp#=#t1#
3.#Inser$on'grouping'
Original#&#User’s#Source#IDs#
Timestamp#=#t2#
4.#New'Points'
User’s#Source#ID#
Shi?ed#TWTT#
Timestamp#=#t2#
Grouping)
Table)
Features)
Table)
Figure 6: This figure shows the steps taken in interaction
with the database for a user to shift a previously interpreted
horizon.
User: A
Time: t1
User: A
Time: t1
User: B
Time: t2
User: A
Time: t1
Figure 7: The screenshot on the left shows an interpreted
horizon by user A at time t1. The screenshot on the right
shows a partially shifted horizon by user B at time t2. The
change (shift) takes place only on the affect points since we
implemented a fine-grained provenance.
feature object means a new whole object if we need to
maintain its provenance. Thus, we end up with around
double the number of original points, 320, 660 points.
5.1.2 Task 2: Deletion of an Interpreted Object
with History Tracking
In this task, we assume that two users have previously
added to an existing interpretation of a horizon from
a particular source. A senior (more expert) user later
visualized both interpretations and decided that one is
more accurate than the other and therefore wanted to
delete the less accurate interpretation.
One user of a session (acted as an expert) was
asked to select a session with a data insertion tag to
delete. Technically, this is achieved as follows. As in
Task 1, we start a deletion type grouping in SRDS
tagged with this user ID and a current timestamp.
Then, a single update query containing the user ID
and timestamp of the session to be deleted is executed.
This results in re-inserting the points of this session
but tagged with the expert user’s ID and a timestamp
of the created deletion type grouping. We then end
this grouping. We then refresh FESVo and reload
the latest version of interpretations which includes
the original (previously existed) version and the ad-
ditional interpretation by the more accurate user.
As we record a timestamp when starting a group-
ing between different interpretation sources, we can
go back in history to visualize earlier versions. In this
task, the second user of this session was able to track
the history of this horizon; this is illustrated in Figure
8.
5.2 Performance Measure
Our current aim is to achieve data provenance with
an acceptable performance. Our tests were performed
on laptop equipped with a graphics cards of 256MB
of memory. The database was running virtually on a
single-node 64-bit Windows Server 2003. The total
size of the tables, which mainly include three seis-
mic imaging datasets and several users’ interpreta-
tions, were around 35GB.
Over a local area network (LAN), we were able
to initially load the seismic traces at a level of de-
tail with a lower resolution of one seismic volume in
around 7 to 8 seconds; this level had a size of 38MB.
The feature object (horizon) was loaded in around 1 to
2 second(s); both traces and the feature object forms
the output is illustrated in Figures 7 or 8. The load-
ing process used 4 threads concurrently. Each SQL
command is a multi-statement request consists of a
maximum of 16 point-to-point queries. Each query is
a fetch request of a macro previously set up to query a
single trace or a set of feature points against a unique
geographical location (x,y).
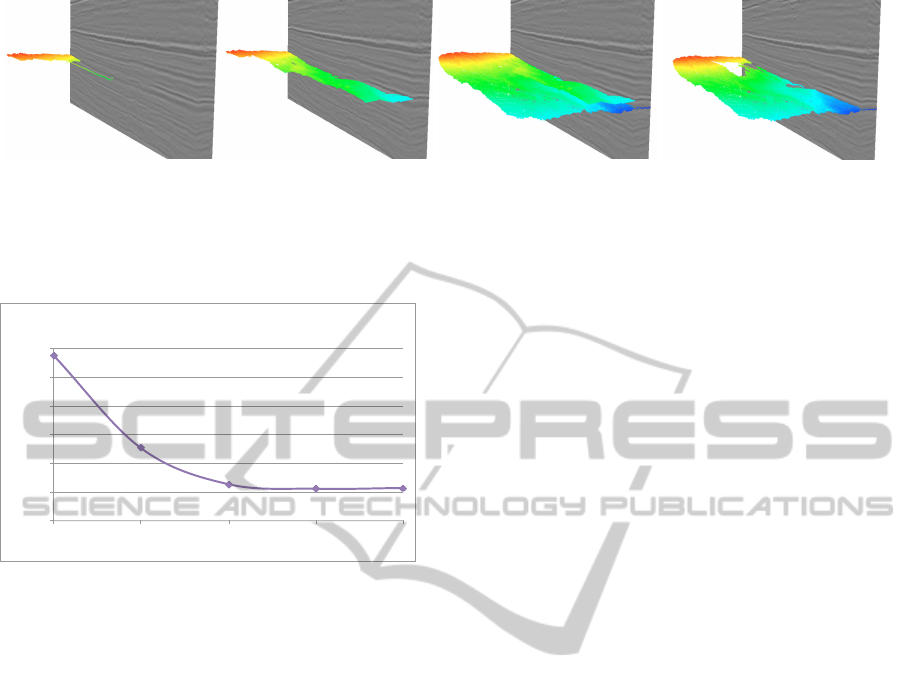
By experiment, we found that the number of
threads to run concurrently is preferred to be multiple
of the database’s parallel units, known by Teradata as
Access Module Processor (AMP) (Ballinger, 2009).
The database used in our tests has four AMPs. Thus,
as shown on the graph of Figure 9, the throughput be-
comes stable when using four threads or more. This
would only be the case when performing the queries
on a fast connection, as is the case with the test of Fig-
ure 9. When using a slower connection, more threads,
up to a limit, would boosts the overall throughput as
the number of threads overcomes the slowness in con-
nections.
5.3 Survey
We recently made a non-public survey of 18 senior
staff from oil and gas companies (5 geoscientists and
13 IT staff who explicitly support and maintain sub-
surface data, hardware, and software infrastructures)
IVAPP2014-InternationalConferenceonInformationVisualizationTheoryandApplications
314
Original Source
User: A
Time: t1
[insertion]
User: B
Time: t2
[insertion]
User: A
Time: t1
[insertion]
User: A
Time: t1
[insertion]
User: C
Time: t3
[deletion]
Figure 8: From left, the second screenshot shows some interpretation added to the original one (first one from left) by User
A at time t1. The third screenshot shows more contribution by User B at time t2. The fourth screenshot, an expert user (User
C) decided to delete the interpretation by User A due to, for example, lack of accuracy. The interpretation of User A is in fact
not deleted but tagged as deleted. Users, therefore, can go back in history and visualize previous versions of interpretations.
!77.81!!
!45.36!!
!32.75!!
!31.17!!
!31.44!!
!20!!
!30!!
!40!!
!50!!
!60!!
!70!!
!80!!
1! 2! 3! 4! 5!
Average'Time'Per'Statement'(ms)'
Number'of'Threads'
Effect'of'Threads'on'Average'Time'Per'Statement'
Figure 9: The number of threads to run concurrently is pre-
ferred to be multiple of the database’s parallel modules. Us-
ing a high speed connection and a database with 4 parallel
modules, the throughput becomes stable after 4 concurrent
threads.
and 6 geoscientists from a university (5 postgraduate
students and 1 senior staff). The purpose of the survey
was to understand the following:
1. the importance of a collaborative environment and
data provenance for seismic interpretation,
2. the differences between a seismic interpretation
environment in universities and in the industry,
3. the challenges IT staff encountered to fulfil the
need of seismic visualization and interpretation in
an efficient data management manner.
The collaboration in this context refers to the abil-
ity of users to share their results of interpretations and
work together to produce such results. Ten out of
eleven of the participated geoscientists perceived that
a collaborative visualization and interpretation envi-
ronment is “very important”. The participants from
the industry added that collaboration “raises produc-
tivity.” We observed that the need of a collaboration
was more obvious to geoscientists in industry than in
universities where the work is almost performed in-
dividually. The same ratio also perceived that it is
overall challenging to collaborate on seismic inter-
pretation using existing software. The geoscientists
from the industry highlighted this challenge on shar-
ing their interpretations with other teams; for exam-
ple between the interpreters and engineers. In such
an industry, it is often that each team uses different
software, and each software uses its proprietary inter-
nal format. All participated geoscientists perceived
that data provenance, including history tracking, is
important in seismic interpretation; most of the par-
ticipants from the industry added that history tracking
“raises efficiency.” Looking into the challenge of his-
tory tracking, geoscientists from the universities did
not find this challenging while the industry saw that
it is “manageable for recent interpretations but a bit
challenging for very old datasets;” this perhaps clari-
fies the former finding.
The response from the IT staff highlighted the
technical challenges and thus area of improvements,
where geoscientists might not perceive this in the
same way, since it is the job of the IT staff to do this
for them. Ten out of thirteen IT staff perceived that
users cannot immediately access all subsurface data
for visualization or interpretation in a high availabil-
ity fashion; but data access needs some initial prepara-
tion. They share with the geoscientists the perception
of challenging collaboration; 46% found that shar-
ing users’ results with any other staff members is a
time consuming task as it requires to export then im-
port data to be shared. The participants suggested
that to enhance the infrastructure, for a collaboration
that maximizes productivity, the industry need to in-
troduce a “more integrated data environment”, “use
cloud-based technology”, “standardize the workflow
between all users”, and “have shared databases among
all disciplines (teams).” In addition, they evaluated
the move of data between application as it negatively
affect productivity; 62% of them emphasised this as a
“high” effect and it “needs a great attention.” Eleven
out of thirteen believed that centralizing subsurface
datasets would improve data management, but this
“has been challenging up to now.” Some of their sug-
gested reasons for not centralizing datasets were; the
Fine-GrainedProvenanceofUsers'InterpretationsinaCollaborativeVisualizationArchitecture
315

proprietary internal format of multiple applications
and the lack of a well integrated environment in the
industry. The need of a “standard data repository”
was highlighted.
6 CONCLUSION AND FUTURE
WORK
In this paper we have demonstrated a proof of con-
cept of our data-centric approach to fine-grained data
provenance of users’ visual interpretations, applying
this to seismic imaging data. Our method repre-
sents and accumulates users’ interpretations of ge-
ological features as fine-grained metadata and com-
bines it with the raw seismic data into a single storage.
Currently we use a relational database; we intend to
test our method with other forms of data storage. We
link this to a renderer through a loading mechanism
and also allow users’ amendments of interpretations
to flow back as new metadata to the data storage. In
this paper, we have presented a case study on geol-
ogists testing our architecture and some performance
results. We have also presented a survey which shows
a need for an efficient data management in seismic vi-
sualization; we believe that our architecture is a step
into addressing this need.
Our plan for the future is to integrate our archi-
tecture with feature extraction techniques and algo-
rithms, such as the work presented by H
¨
ollt et. al.
(H
¨
ollt et al., 2011). Also, we plan to provide more
interactive functionalities available to users’ interpre-
tations of features. In addition, it is vital to test our
methods on massive datasets due to the nature and
demands of the oil and gas industry. We plan to scale
our implementation into massive parallel processing
databases to support massive datasets at a high per-
formance. Finally, in this paper we have considered
only seismic imaging datasets. However, our method
can potentially be extended to support other types of
spatial data, for example from oceanography, space
physics, and medical imaging.
REFERENCES
Ahrens, J., Brislawn, K., Martin, K., Geveci, B., Law, C.,
and Papka, M. (2001). Large-scale data visualization
using parallel data streaming. IEEE Computer Graph-
ics and Applications, 21(4):34–41.
Al-Naser, A., Rasheed, M., Brooke, J., and Irving, D.
(2011). Enabling Visualization of Massive Datasets
Through MPP Database Architecture. In Carr, H. and
Grimstead, I., editors, Theory and Practice of Com-
puter Graphics, pages 109–112. Eurographics Asso-
ciation.
Al-Naser, A., Rasheed, M., Irving, D., and Brooke, J.
(2013a). A Data Centric Approach to Data Prove-
nance in Seismic Imaging Data. In 75th EAGE Con-
ference & Exhibition incorporating SPE EUROPEC,
London. EAGE Publications bv.
Al-Naser, A., Rasheed, M., Irving, D., and Brooke, J.
(2013b). A Visualization Architecture for Collabora-
tive Analytical and Data Provenance Activities. In In-
formation Visualisation (IV), 2013 17th International
Conference on, pages 253–262.
Alvarez, F., Dineen, P., and Nimbalkar, M. (2013). The Stu-
dio Environment: Driving Productivity for the E&P
Workforce. White paper, Schlumberger.
Bacon, M., Simm, R., and Redshaw, T. (2003). 3-D Seismic
Interpretation. Cambridge University Press.
Ballinger, C. (2009). The Teradata Scalability Story. Tech-
nical report, Teradata Corporation.
Bavoil, L., Callahan, S., Crossno, P., Freire, J., Scheidegger,
C., Silva, C., and Vo, H. (2005). VisTrails: Enabling
Interactive Multiple-View Visualizations. In Visual-
ization, 2005. VIS 05. IEEE, pages 135–142. IEEE.
Biddiscombe, J., Geveci, B., Martin, K., Moreland, K., and
Thompson, D. (2007). Time dependent processing in
a parallel pipeline architecture. IEEE Transactions on
Visualization and Computer Graphics, 13(6):1376–
1383.
BP (2012a). BP Energy Outlook 2030. Technical report,
London.
BP (2012b). BP Statistical Review of World Energy June
2012. Technical report.
Brooke, J. M., Marsh, J., Pettifer, S., and Sastry, L. S.
(2007). The importance of locality in the visualiza-
tion of large datasets. Concurrency and Computation:
Practice and Experience, 19(2):195–205.
Castanie, L., Levy, B., and Bosquet, F. (2005). Volume-
Explorer: Roaming Large Volumes to Couple Visual-
ization and Data Processing for Oil and Gas Explo-
ration. In IEEE Visualization, volume im, pages 247–
254. Ieee.
Gosink, L. J., Anderson, J. C., Bethel, E. W., and Joy, K. I.
(2008). Query-driven visualization of time-varying
adaptive mesh refinement data. IEEE transactions
on visualization and computer graphics, 14(6):1715
–1722.
Hadwiger, M., Ljung, P., Salama, C. R., and Ropinski, T.
(2009). Advanced Illumination Techniques for GPU
Volume Raycasting. In ACM SIGGRAPH Courses
Program, pages 1–166, New York, NY, USA. ACM.
Halliburton-Landmark (2013). GeoProbe Volume Visu-
alization. https://www.landmarksoftware.com/
Pages/GeoProbe.aspx.
Hawtin, S. and Lecore, D. (2011). The business value case
for data management - a study. Technical report, CDA
& Schlumberger.
H
¨
ollt, T., Beyer, J., Gschwantner, F., Muigg, P., Doleisch,
H., Heinemann, G., and Hadwiger, M. (2011). In-
teractive seismic interpretation with piecewise global
IVAPP2014-InternationalConferenceonInformationVisualizationTheoryandApplications
316

energy minimization. In Pacific Visualization Sym-
posium (PacificVis), 2011 IEEE, pages 59–66, Hong
Kong.
Ikeda, R. and Widom, J. (2009). Data Lineage: A Survey.
Technical report, Stanford University.
Jomier, J., Aylward, S. R., Marion, C., Lee, J., and Styner,
M. (2009). A digital archiving system and distributed
server-side processing of large datasets. In Siddiqui,
K. M. and Liu, B. J., editors, Proc. SPIE 7264,
Medical Imaging 2009: Advanced PACS-based Imag-
ing Informatics and Therapeutic Applications, volume
7264, pages 726413–726413–8.
Jomier, J., Jourdain, S., and Marion, C. (2011). Remote
Visualization of Large Datasets with MIDAS and Par-
aViewWeb. In Proceedings of the 16th International
Conference on 3D Web Technology, pages 147–150,
Paris, France. ACM.
Karvounarakis, G., Ives, Z. G., and Tannen, V. (2010).
Querying data provenance. In Proceedings of the 2010
ACM SIGMOD International Conference on Manage-
ment of data, SIGMOD ’10, pages 951–962, New
York, NY, USA. ACM.
Lin, J. C.-R. and Hall, C. (2007). Multiple oil and gas vol-
umetric data visualization with GPU programming.
Proceedings of SPIE, 6495:64950U–64950U–8.
Ma, C. and Rokne, J. (2004). 3D Seismic Volume Visualiza-
tion, volume VI, chapter 13, pages 241–262. Springer
Netherlands, Norwell, MA, USA.
Mcreynolds, T. and Hui, S. (1997). Volume Visualiza-
tion with Texture, chapter 13, pages 144–153. SIG-
GRAPH.
Moreland, K. (2013). A Survey of Visualization Pipelines.
Visualization and Computer Graphics, IEEE Transac-
tions on, 19(3):367–378.
Patel, D., Bruckner, S., and Viola, I. (2010). Seismic vol-
ume visualization for horizon extraction. In Proceed-
ings of IEEE Pacific Visualization, volume Vi, pages
73–80, Taipei, Taiwan. IEEE.
Patel, D., Sture, O. y., Hauser, H., Giertsen, C., and Eduard
Gr
¨
oller, M. (2009). Knowledge-assisted visualization
of seismic data. Computers & Graphics, 33(5):585–
596.
Pavlo, A., Paulson, E., Rasin, A., Abadi, D. J., DeWitt,
D. J., Madden, S., and Stonebraker, M. (2009). A
comparison of approaches to large-scale data analy-
sis. In Proceedings of the 2009 ACM SIGMOD Inter-
national Conference on Management of data, pages
165–178. ACM.
Plate, J., Holtkaemper, T., and Froehlich, B. (2007). A
flexible multi-volume shader framework for arbi-
trarily intersecting multi-resolution datasets. IEEE
transactions on visualization and computer graphics,
13(6):1584–91.
Plate, J., Tirtasana, M., Carmona, R., and Fr
¨
ohlich, B.
(2002). Octreemizer: a hierarchical approach for in-
teractive roaming through very large volumes. In
Data Visualisation, pages 53–60. Eurographics Asso-
ciation.
Rahimi, S. K. and Haug, F. S. (2010). Query Optimization.
Wiley.
Robein, E. (2010). Seismic Imaging: A Review of the
Techniques, their Principles, Merits and Limitations.
EAGE Publications bv.
Scheidegger, C. E., Vo, H., Koop, D., Freire, J., and Silva,
C. T. (2007). Querying and creating visualizations
by analogy. IEEE transactions on Visualization and
Computer Graphics, 13(6):1560–1567.
Schlumberger (2013). Petrel Seismic to Simulation Soft-
ware. http://www.slb.com/services/software/
geo/petrel.aspx.
Simmhan, Y. L., Plale, B., and Gannon, D. (2005). A sur-
vey of data provenance in e-science. SIGMOD Rec.,
34(3):31–36.
Society of Exploration Geophysicists (2002). SEG Y rev 1
Data Exchange Format. Technical Report May.
Stockinger, K., Shalf, J., Wu, K., and Bethel, E. (2005).
Query-Driven Visualization of Large Data Sets. In
Visualization, 2005. VIS 05. IEEE, pages 167–174.
IEEE.
Visualization Sciences Group (2013). Avizo Earth. http:
//www.vsg3d.com/avizo/earth.
Vo, H., Bronson, J., Summa, B., Comba, J., Freire, J.,
Howe, B., Pascucci, V., and Silva, C. (2011). Parallel
Visualization on Large Clusters using Map Reduce. In
Large Data Analysis and Visualization (LDAV), 2011
IEEE Symposium on, pages 81–88. IEEE.
Wu, K. (2005). FastBit: an efficient indexing technol-
ogy for accelerating data-intensive science. Journal
of Physics: Conference Series, 16:556–560.
Wu, K., Ahern, S., Bethel, E. W., Chen, J., Childs,
H., Cormier-Michel, E., Geddes, C., Gu, J., Hagen,
H., Hamann, B., Koegler, W., Lauret, J., Mered-
ith, J., Messmer, P., Otoo, E., Perevoztchikov, V.,
Poskanzer, A., Prabhat, R
¨
ubel, O., Shoshani, A., Sim,
A., Stockinger, K., Weber, G., and Zhang, W.-M.
(2009). FastBit: interactively searching massive data.
Journal of Physics: Conference Series, 180:012053.
Zhang, S. and Zhao, J. (2010). Feature Aware Multiresolu-
tion Animation Models Generation. Journal of Multi-
media, 5(6):622–628.
Fine-GrainedProvenanceofUsers'InterpretationsinaCollaborativeVisualizationArchitecture
317
