
Visualizing Hierarchy Changes by Dynamic Indented Plots
Michael Burch, Tanja Blascheck, Christine Louka and Daniel Weiskopf
VISUS, University of Stuttgart, Stuttgart, Germany
Keywords:
Dynamic Hierarchies, Indented Plots.
Abstract:
Visualizing static hierarchical organizations has been a focus of information visualization for many years,
but it still remains challenging to produce visual representations of evolving, i.e. dynamic hierarchies. In
this paper we extend the concept of indented plots to also support the depiction of changing hierarchies.
We exploit the concept of static diagrams in order to support the preservation of a viewer’s mental map.
Changes between subsequent hierarchies are precomputed and visually indicated by color coded straight or
curved lines depending on the type of change. Interactive features can be used to aggregate or collapse the
dynamic hierarchy data in the supported dimensions, i.e. the vertex as well as the time dimension on different
levels of hierarchical and temporal granularity. The usefulness of our technique is illustrated by means of
a bibliography dataset where we show the changes in the yearly prefix tree acquired by extracting words
occuring most frequently in more than 2,000,000 paper titles from the digital library DBLP.
1 INTRODUCTION
There are many application examples where hierar-
chical data comes into play. Software developers typi-
cally organize their system into packages, directories,
subdirectories, files, classes, functions/methods, and
code blocks on the finest level of hierarchical granu-
larity. Biologists structure all species living on earth
into a hierarchical structure which is updated from
time to time with newly classified organisms. As a
third example occurring words in paper titles can be
hierarchically organized into a prefix tree structure.
All these hierarchies are typically changing over
time due to software development, the evolution of
life, and progress in research articles. Since such a dy-
namic prefix tree structure contains frequent and also
abrupt changes it will be used as illustrative applica-
tion scenario in our work as a stress test.
In this paper we introduce a novel approach to vi-
sually depict the evolving behavior of hierarchical or-
ganizations. To allow good comparisons we use the
concept of time-to-space mapping, i.e. a static dis-
play showing the sequence of hierarchies in a side-
by-side representation according to the small mul-
tiples approach (Tufte, 1983). This stands in con-
trast to animation that only shows one hierarchy at a
time and smoothly transforms one into the other (Card
et al., 2006). It is also different from other approaches
surveyed by Graham and Kennedy (2010) such as
coloring (Munzner et al., 2003), matrix (van Ham,
2003), agglomeration (Burch and Diehl, 2006), 3D,
or atomic representations. When using animation, a
good layout algorithm has to be applied that takes
the aesthetic appearance of all hierarchies into ac-
count and additionally targets a good dynamic stabil-
ity of the animated sequence focusing on mental map
preservation (Misue et al., 1995) and a reduction of
cognitive load. Another drawback of animation is the
fact that the viewers have to rely on their limited short
term memory in order to make comparisons between
subsequent hierarchies. Furthermore, it is very dif-
ficult to apply interactive features to an animated di-
agram. Similar perceptual and interaction drawbacks
hold for other representation styles as discussed in the
survey by Graham and Kennedy (2010).
In this work, instead, we make use of a sequence
of indented plots (Burch et al., 2010) placed next
to each other in the same orientation. Such plots
are redundant-free, compact, and scalable indented
curves depicting hierarchical structures by the con-
cept of indentation similar to the concept of pretty
printing applied by programmers. Differences be-
tween subsequent hierarchies are precomputed and
visually indicated by color coded straight or curved
links supporting viewers with mental map preserva-
tion by guiding them through the hierarchy changes
via explicit links and not by smooth animation. This
edge drawing approach has the benefit that analysts
91
Burch M., Blascheck T., Louka C. and Weiskopf D..
Visualizing Hierarchy Changes by Dynamic Indented Plots.
DOI: 10.5220/0004652400910098
In Proceedings of the 5th International Conference on Information Visualization Theory and Applications (IVAPP-2014), pages 91-98
ISBN: 978-989-758-005-5
Copyright
c
2014 SCITEPRESS (Science and Technology Publications, Lda.)

can make comparisons visually, and not mentally, by
exploiting the capabilities and strengths of their visual
system and fast pattern recognition. As another ben-
efit, interactive features are easy to apply because the
display is static.
Our visualization tool is designed in a way follow-
ing the Visual Information Seeking Mantra (Shneider-
man, 1996), i.e. first we give an overview of all the
changes, then we allow zoom and filter operations,
and finally details on demand. We allow data aggre-
gation in the vertex as well as the time dimensions
and support the analyst by further interactive features
such as finding trails of hierarchy elements.
We illustrate the usefulness of our technique by
a case study exploring bibliography data from the
digital library DBLP (Ley, 2009): we first extract
all stored paper titles, count the occurring words in
each year, generate a prefix tree of the most frequent
words in the Newick format for each year, compute
the changes of subsequent prefix trees, and finally vi-
sualize these results by our visualization tool.
2 RELATED WORK
Visualizing static hierarchical data has been a focus
of research for many years where visual and algorith-
mic scalability (McGuffin and Robert, 2010) as well
as readability and aesthetics have been taken into ac-
count as competing criteria to trade-off. Several vi-
sual metaphors exist to depict hierarchical organiza-
tions: Node-link diagrams clearly show the hierarchi-
cal structure by mapping objects of a hierarchy typi-
cally to circular shapes and by indicating parent-child
relationships as straight or orthogonal links connect-
ing the hierarchy elements (Eades, 1992; Reingold
and Tilford, 1981). A top-down layout has been eval-
uated as the best performing one for the task of lo-
cating the least common ancestor of a list of marked
leaf nodes, as found out by an eye tracking study con-
ducted by Burch et al. (2011a).
Treemaps apply the concept of nesting enclo-
sure to illustrate a hierarchy in a space-filling man-
ner (Johnson and Shneiderman, 1991; Shneiderman,
1992). Many variations exist such as squarified (Bruls
et al., 2000), cushion (van Wijk and van de Wetering,
1999), or Voronoi Treemaps (Balzer et al., 2005; No-
caj and Brandes, 2012) to enhance the layout and to
make the hierarchy representations more readable and
understandable. Though treemaps use the given dis-
play space efficiently, it is difficult to visually explore
the hierarchical structure in a better way than in node-
link diagrams and to use them for dynamic hierarchy
visualizations (Tu and Shen, 2007).
The metaphor of layered icicles (Kruskal and
Landwehr, 1983) applies the concept of stacking to
build a visual depiction of a hierarchical organization
which allows a small multiples visualization and edge
drawing approach but on the negative side inner ver-
tices are represented as bars being as long as the sum
of the bars of all the child nodes’ bars. A small multi-
ples icicle representation would hence produce more
crossings and overlaps.
All these approaches have one problem in com-
mon. There is no single representative element for
each vertex — inner vertex as well as leaf vertex
— on a one-dimensional line. Indented Pixel Tree
Plots (Burch et al., 2010) instead use indentation om-
nipresent in graphical file browsers or pretty printing
of source code. These plots allow the mapping of all
vertices to a unique representative one-dimensional
position and can hence be laid out in a side-by-side
manner allowing good comparisons between subse-
quent hierarchies. As another benefit, these plots al-
low the attachment of additional information to each
vertex in an aligned way (Burch et al., 2012) and scale
to very huge and deep hierarchies still sufficiently rep-
resenting the hierarchical structure. This mapping al-
lows us to enrich the diagram by color coded links
showing the differences and changes over time with
a reduced overlap of links with the sequence of hier-
archy visualizations — denoted as edge drawing ap-
proach in the survey by Graham and Kennedy (2010).
Generally, in graph visualization there also exist
two major concepts to represent the dynamic behavior
of a graph. Either animation can be used that shows
each timestep in a single frame and then smoothly
animates this toward the subsequent one by keeping
a high degree of dynamic stability (Diehl and G
¨
org,
2002; Frishman and Tal, 2007). This requires quite
complex layout algorithms that follow aesthetic graph
drawing criteria (Purchase, 1997) for each static graph
in the sequence. Orthogonally to that, aesthetic cri-
teria for the dynamics (Beck et al., 2009) have to
be followed in order to preserve a viewer’s men-
tal map. This concept is referred to as time-to-time
mapping whereas a time-to-space mapping stands for
a representation of the inherent time dimension to
space (Burch and Diehl, 2008; Burch et al., 2011b).
For dynamic hierarchy visualization we could fol-
low a similar concept: We use a time-to-space map-
ping by exploiting the visual metaphor of indentation
by vertically aligning the hierarchies on parallel axes.
To achieve a compact and connected layout we do not
leave gaps for the alignment but use connected in-
dented plots and show the changes over time in the
dynamic hierarchies by colored straight and curved
lines similar to the concept used in CodeFlows (Telea
IVAPP2014-InternationalConferenceonInformationVisualizationTheoryandApplications
92

Figure 1: Hierarchy of depth 2 consisting of 10 vertices: 1
designated root vertex F, 2 inner vertices A and E, and 7 leaf
vertices M,N,P,B,C,D, and Q.
(a) (b)
(c) (d)
Figure 2: Node changes: (a) Deletion of node D from orig-
inal hierarchy (Figure 1). (b) Addition of node O. (c) Ex-
change of positions of sibling nodes M and P. (d) Modified
position of node M.
and Auber, 2008). This approach is most related to
our technique but it is restricted to showing source
code (indented metaphor) and not hierarchies in gen-
eral. Moreover, the code representation is mirrored at
the vertical axes and the depth is not indicated by pure
indentation but differently long bars for each line of
code. Also collapsing and expanding features in the
time and vertex dimension are not supported. This
mapping allows juxtaposition of subsequent hierar-
chies as also applied by (Holten and van Wijk, 2008)
and (Munzner et al., 2003). However, in those papers
only the changes among leaf vertices are displayable.
In contrast, our approach is extended to show changes
among any kind of vertex — inner as well as leaf ver-
tices.
3 DATA MODEL
We model a hierarchy as an acyclic directed graph
H = (V, E)
where V denotes the set of vertices and E ⊂ V × V
the set of directed edges, i.e. parent-child relation-
ships. One vertex is the designated root vertex and
the complete hierarchy is always directed from this
root vertex to the leaf vertices.
A dynamic hierarchy H of length n ∈ N is modeled
as a sequence of subsequent hierarchies
H := H
1
, . . . , H
n
where H
i
= (V
i
, E
i
), V
i
is the i-th vertex set, and
E
i
⊂ V
i
×V
i
is the i-th edge set, i.e. the parent-child
relations of the i-th hierarchy in the sequence.
3.1 Newick Format
Our visualization tool uses the Newick data format for
storing hierarchy data and for representing hierarchies
in computer-interpretable form. The correspondence
between a hierarchy and the nesting of parentheses
is exploited in this concept. A sequence of hierar-
chies is given by a set of files containing one hierarchy
each. Our Java-based visualization tool first extracts
all hierarchies from the given files and stores them
in the corresponding internal data structures. The
Newick format can easily be extended to allow addi-
tional information attached to the vertices and also to
the edges such as distance functions as commonly ex-
isting in the field of bioinformatics for modeling phy-
logenetic trees. The tool is able to handle additional
data attachments by just introducing the correspond-
ing parsing interfaces.
3.2 Hierarchy Comparison
For the hierarchy comparison two successive H
i
and
H
i+1
of H are first transformed by depth-first traversal
into two vertex lists L
i
and L
i+1
. Since all hierarchy
elements are given a unique identifier a simple algo-
rithm can be used to compute changed nodes between
two compared hierarchies. Both representative lists
are processed and three new lists are generated for
added, removed, exchanged, and modified hierarchy
elements (see Figure 1 and Figures 2 (a) - (d)). The
contextual information is important for this visualiza-
tion, which means that we additionally store where
in the list vertices have been added or deleted. Fur-
thermore, for a changed position we need to store the
position of the vertex in list L
i
and also the new po-
sition in list L
i+1
. If there are several vertices with
the same textual description we additionally take the
depth and contextual information into account for a
good comparison.
4 VISUALIZATION TECHNIQUE
The approach of mapping static hierarchical data to
one-dimensional indented curves is extended to visu-
ally encode time-varying hierarchies in a static dia-
gram giving a good overview of both dimensions in
the data: vertices and time. Parent-child relationships
are visually expressed by the idea of indentation. In
VisualizingHierarchyChangesbyDynamicIndentedPlots
93
(a) (b)
Figure 3: A hierarchical dataset presented in two visual
metaphors: (a) Node-link diagram in top-down traditional
layout. (b) Indented plot using color coding for visually en-
coding depth information.
this section we first introduce the general idea of in-
dented plots, show how this approach can be extended
to the dynamic case, explain how changes and differ-
ences are visualized, and finally propose several in-
teractive features to manipulate and navigate through
the data.
4.1 Static and Dynamic Indented Plots
Since our visualization technique allows changes in
all nodes — inner nodes as well as leaf nodes — we
apply the concept of indented outlines that have a rep-
resentative hierarchy element at a single 1D line. Fol-
lowing this visual metaphor we are able to display a
sequence of hierarchies in a scalable side-by-side rep-
resentation and plot occurring links in between.
Figure 3 illustrates how a traditional node-link di-
agram looks like when an indented visual metaphor is
used. The color coding in Figure 3 (b) is applied to
better indicate the depth metric in the indented plot.
Here, a red to green color gradient is used, i.e. the root
node is represented in red color whereas the nodes lo-
cated deepest in the hierarchy are colored in green.
This design is helpful when only the indented plot
sequence is inspected and gives a better impression
about depth in the hierarchy. If edges are drawn this
feature can be switched off to not lead to irritations
when several color codings are used on top of each
other. Instead, a black-to-white color or transparency
gradient can be used instead.
For the time-varying hierarchy data we use a time-
to-space mapping by encoding each hierarchy on one
indented plot in a side-by-side view to parallel verti-
cal lines similar to the concept used in parallel coordi-
nates plots (Inselberg and Dimsdale, 1990); see Fig-
ure 4 for an illustration of such a side-by-side view.
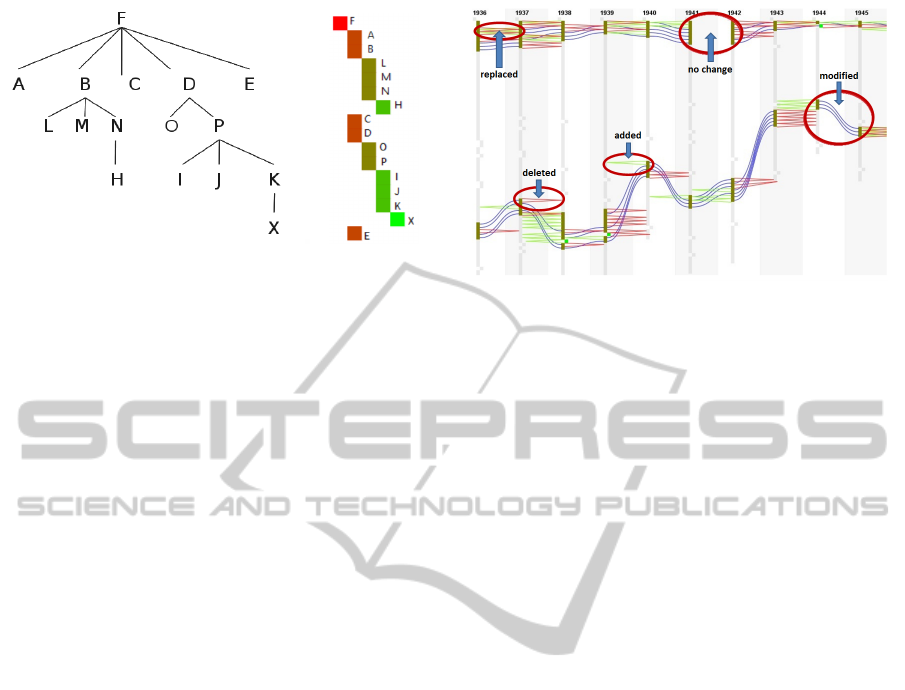
Figure 4: Dynamic hierarchy visualization of an evolving
prefix tree structure generated from frequently occurring
words in more than 2,000,000 paper titles extracted from
DBLP. Only vertices matching a specific text pattern are
taken into account.
4.2 Change Phenomena in Hierarchies
There are several change phenomena that may occur
when comparing two different hierarchies. In our de-
sign we decided to use red for removed objects, green
for added objects, and blue for persisting but moved
objects.
• Deletion of a node: If a node disappears from a
hierarchy H
i
to a subsequent hierarchy H
i+1
we
indicate this by two red straight lines starting at
the position in hierarchy H
i
where the node is still
present and pointing to the position in hierarchy
H
i+1
where this specific node was originally lo-
cated, see change from Figure 1 to Figure 2 (a)
and Figure 4.
• Addition of a node: If a node is added in a hierar-
chy H
i+1
that was not present in hierarchy H
i
we
draw two green straight lines that originate at the
position of this added node in hierarchy H
i
and
point to the position where it is located now in
hierarchy H
i+1
, see change from Figure 2 (a) to
Figure 2 (b) and Figure 4.
• Exchange of node positions: The exchange of
two positions can be modeled by two modified
node positions and hence, two twisted blue col-
ored curved lines are drawn between hierarchy H
i
and hierarchy H
i+1
indicating the exchange, see
change from Figure 2 (b) to Figure 2 (c) and Fig-
ure 4.
• Modified node position: If a node changes its
position in a displayed hierarchy H
i
to a subse-
quent hierarchy H
i+1
this is indicated by curved
blue colored lines connecting both representative
objects of the same node, see change from Fig-
ure 2 (c) to Figure 2 (d) and Figure 4.
IVAPP2014-InternationalConferenceonInformationVisualizationTheoryandApplications
94

All other more complex hierarchy changes can be
achieved by combining these simple rules.
Figure 4 shows how the change phenomena illus-
trated in Figures 2 (a) - (d) can be represented by a
side-by-side view of indented plots with color coded
straight or curved links. The color coded links — red,
green, and blue ones — can serve as an overview to
get a first impression if and in what time step more
vertices are added, deleted, exchanged, or modified.
Our tool also allows the user to obtain some statis-
tics about these change phenomena indicated as color
coded bar charts, see Figure 5 where the graphical
user interface (GUI) of our visualization tool is illus-
trated.
4.3 Interactive Features
The tool supports several interactive features to ex-
plore the dynamic hierarchical data such as collaps-
ing and expanding specific nodes, getting information
on a specific element, and selecting a subregion for
a hierarchy on a larger scale for a better exploration.
Some of the tool’s features and functionalities are ex-
plained in the following:
• Region selection: Parts of the indented plot can
be selected and this region is then highlighted and
displayed to the right hand side of the original hi-
erarchy in a larger scale.
• Hierarchy expanding/collapsing: Clicking on a
node allows the user to collapse or expand the
corresponding subhierarchy. When a node is col-
lapsed all its children are hidden, and whenever
the node is expanded again the children reappear.
• Text pattern search: Typing in certain text frag-
ments starts a search for the specified text as a
substring in the textual descriptions of the vertices
and highlights the corresponding nodes found, see
also Figure 4. This features can be used to find
word trails for example.
• Zooming: A zoom in/out horizontal slider bar can
be used for a larger/smaller scale.
• Details-on-demand: By moving the mouse on
any element on the display screen a more de-
tailed information for a specific node like the node
name, number of children of the node, the parent
name, and the depth is displayed.
• Color coding: For a better visualization of the
different hierarchy levels, each level of nodes is
represented in a different color to distinguish it
from other elements. The used color gradients can
be changed at user’s demand.
• Change filter: Only the changes of interest can
be displayed, i.e. either added, deleted, modi-
fied, or exchanged elements. This means that only
the colored links of interest are displayed to the
viewer.
• Delta percentage: The percentage of change for
added, deleted and modified/exchanged nodes be-
tween two consecutive hierarchies selected can be
displayed.
5 CASE STUDY
The DBLP bibliography dataset contains more than
2,000,000 paper titles to date. From this data, all
words occurring in the paper titles can be extracted
and prefix hierarchies can be generated for each year
starting in 1936 and ending up in 2012 resulting in 77
hierarchies.
Displaying the hierarchical organization of the
prefix trees as indented plots in a side-by-side rep-
resentation can give us interesting insights into
newly introduced, deleted, or moved words or word
groups in the lexicographically ordered and vertically
mapped tree structure. For this case study we first
compute the 100 most frequently occurring words in
paper titles (stop words removed) for each year that
occur at least 10 times in this year. From these prefix
trees we compute the dynamic prefix tree differences.
By our visualization approach we are now able to see
both the hierarchical structure in each year as well as
the added, deleted, modified, or exchanged vertices.
This means that we are able to analyze how the pub-
lication behavior of researchers changes due to novel
findings and breaking hot topics or obsolete and unin-
teresting research areas.
Figure 5 shows the dynamic prefix tree structure
and the added, deleted, exchanged, and modified el-
ements for a selected time interval (years 1942 until
1951). The first insight that we get is the fact that be-
fore the year 1948 there are not even 100 words that
occur at least 10 times in all of the paper titles pub-
lished. In 1944, there is a minimum of words occur-
ring at least 10 times. From 1942 to 1943 many words
are removed from the list of the top 100 and are not
replaced by new words occuring at least 10 times in
this year. We hypothesize that there was a hot topic
in these early years which is not researched anymore
that much in the following years. Having a look at our
visualization (Figure 5) we see the many red straight
lines starting at 1942 and ending at 1943 for example.
Using a filter function for showing only the deleted el-
ements we can now easily hover the mouse to the sin-
VisualizingHierarchyChangesbyDynamicIndentedPlots
95
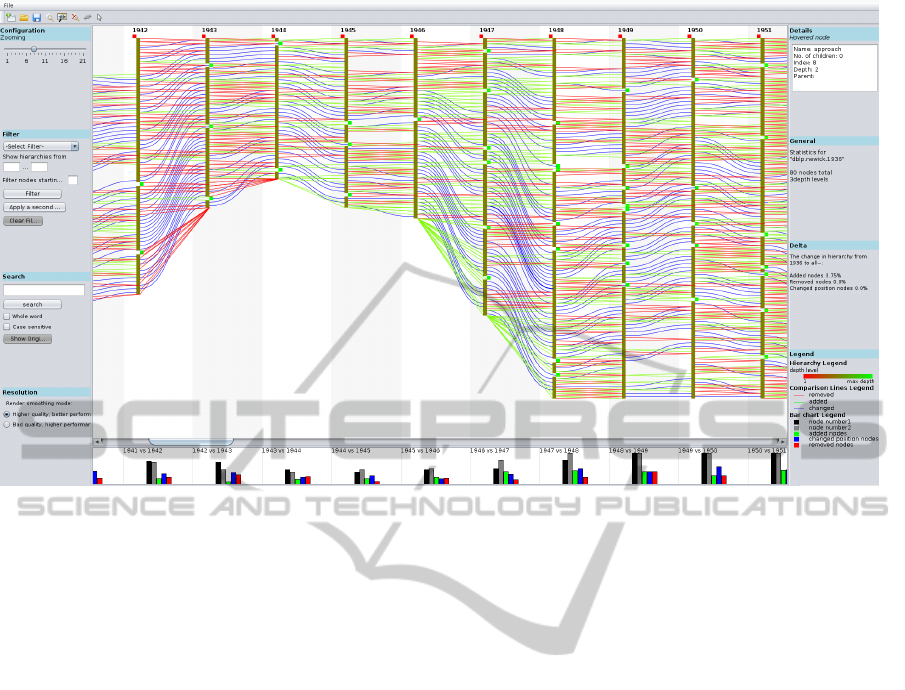
Figure 5: The graphical user interface of our visualization tool for analyzing dynamic hierarchies. It is divided into four main
parts. The panel on the left hand side is responsible for parameter settings and filter values. The center panel shows the time-
varying hierarchies whereas the panel on the right hand side is used for data output such as details on demand and legends.
The bottom panel shows some statistical information about the vertices from different categories such as added, deleted, or
changed vertices.
gle lines and obtain textual details about the deleted
words:
For example, we see that the words ’types’,
’tarski’, ’paradox’, ’analysis’, and ’application’ do
not belong to the prefix tree of the top 100 words in
1943. On the other side, words like ’theorem’, ’the-
ory’, ’system’, ’set’, or ’sequence’ are still present in
1943 which can either be found out by inspecting the
blue colored curved lines or looking for empty gaps
which means nothing has changed there from one
year to the other.
We can also use the visualization for finding
longer word trails in the dynamic prefix trees. For this
we first filter for modified or exchanged elements and
get only blue colored curved lines (added and deleted
ones are grayed out). By hovering the mouse to blue
colored lines or corresponding nodes we find words
that occur for a longer time. The words ’calculus’ and
’calculi’ can be found which are present for several
subsequent years: ’calculus’ starts to occur at least 10
times in 1936 and is present until 1955, disappears
in 1956 and 1957, and reappears in 1958 and 1959
again. From 1960 on, it will never occur in the top
100 words. The plural form ’calculi’ first occurs in
1939 and 1940 in the top 100, then from 1942 to 1945,
and again from 1947 until 1951. In later years (1956
until 1958) the word ’calculation’ as well as ’calcul’
occurs at least 10 times in the top 100. After 1960, all
of these words never occur again in the top 100 which
shows that research in this field may have changed.
6 DISCUSSION
Our novel visualization approach is based on the vi-
sual metaphor of indentation used for representing hi-
erarchies in order to allow a redundant-free and com-
pact representation with a low data-ink ratio. Further-
more, we use the concept of time-to-space mapping
that has some benefits when inspecting time-varying
phenomena in the hierarchical data such as trends,
countertrends, periodicities, temporal shifts, and also
anomalies. Benefits and drawbacks of the proposed
visualization technique can be summarized in the fol-
lowing way.
For visualizing a static hierarchy several aspects
concerning benefits and drawbacks can be discussed:
• Parent-child relationships: By using the con-
cept of indentation for representing a hierarchy
we do not need explicit links for illustrating
parent-child relationships as for example in node-
link diagrams. These are only shown implicitly
by indenting subhierarchies. This results in a
IVAPP2014-InternationalConferenceonInformationVisualizationTheoryandApplications
96

redundant-free diagram and additional crossings
and overlaps with the lines indicating changes be-
tween subsequent hierarchies are avoided. On
the negative side the hierarchical structure is not
that clearly visible as in traditional node-link dia-
grams.
• Representative elements: Indentation allows
representative elements for each hierarchy vertex
— inner as well as leaf vertices — mapped to a
single line. This mapping can be used for attach-
ing additional attributes or in our case showing ex-
plicit lines for changes between subsequent hier-
archies.
For dynamic hierarchy visualization several ben-
efits and drawbacks can be found when compar-
ing time-to-time mappings (animation) with time-to-
space mappings (static display):
• Mental map preservation: We use a static rep-
resentation for the evolving hierarchies. This has
several benefits over an animated diagram. When
abrupt changes occur in the sequence an animated
representation may lead to losing the mental map,
which may make the data unreadable. To solve
this problem in our static representation we use
a side-to-side hierarchy visualization and use ex-
plicit links to guide the eye as also described
by (Graham and Kennedy, 2010). This static rep-
resentation reduces cognitive load, allows for in-
teractive features, and reduces the runtime com-
plexity that would be needed in the animated ap-
proach to produce layouts benefitting from high
dynamic stabilities.
• Time-dependent phenomena: Time-varying be-
haviors can be explored visually in a static repre-
sentation. In an animated sequence this seems to
be problematic since the viewers have to do the
comparisons by relying on their short term mem-
ory. Consequently, trends, countertrends, period-
icities, temporal shifts, or anomalies can be de-
tected much easier in a static representation of dy-
namic data.
• Application of interactions: An animated dia-
gram makes it difficult to apply interactive fea-
tures. The animation has to be stopped first and
then a graphical element can be interactively se-
lected and manipulated. This is easier to apply in
a static diagram where the viewer has much more
time to apply mouse interaction.
• Algorithmic complexity: In an animated dia-
gram for hierarchical data good layout strategies
have to be used in order to achieve dynamic stabil-
ity, a concept that is also used in graph animation.
This is required to preserve the viewer’s mental
map of the animated diagram. In a static plot
of dynamic data such complex algorithms are not
needed. Here, the vertex ordering is not changing
and hierarchies can be added on-the-fly without
computing a totally new layout.
• Visual scalability: Animated diagrams only
show one hierarchy at a time and hence, benefit
from visual scalability. The whole display can be
used to represent this hierarchy. In a side-by-side
visualization, i.e. a time-to-space mapping, dis-
play space is needed for many timesteps which
allows each single diagram to be displayed only
on a small region on screen.
7 CONCLUSIONS AND FUTURE
WORK
In this paper we introduced a visualization technique
for visualizing dynamic hierarchies in a static dia-
gram by making use of the indented outline metaphor.
Large hierarchies are represented by using the con-
cept of several indented plots in a side-by-side rep-
resentation. The changes and differences between
subsequent hierarchies are indicated by color coded
straight or curved lines. Interactive features can be
applied to further navigate in the data, to explore and
analyze it, and to aggregate it in the vertex and time
dimension. A case study for bibliography data from
the digital library DBLP was presented illustrating the
usefulness of the novel dynamic hierarchy visualiza-
tion.
In the future we plan to make the visualization
technique more scalable in the time dimension. More-
over, the vertex ordering for reducing cluttering of
the display by blue colored lines may be a good
strategy to be investigated. The continuation of the
lines across evolution is hard to follow in a cluttered
display and hence, occlusion problems may be re-
duced by computing a good hierarchy layout for each
timestep. Also, a user study should be conducted
investigating the performance of participants when
working with the novel technique. Exploring other
application examples for dynamic hierarchies are also
of interest for future work.
ACKNOWLEDGEMENTS
In part, this work was supported by Deutsche
Forschungsgemeinschaft (DFG) within SFB 716 /
D.5.
VisualizingHierarchyChangesbyDynamicIndentedPlots
97

REFERENCES
Balzer, M., Deussen, O., and Lewerentz, C. (2005). Voronoi
treemaps for the visualization of software metrics. In
Proceedings of Software Visualization, pages 165–172.
Beck, F., Burch, M., and Diehl, S. (2009). Towards an
aesthetic dimensions framework for dynamic graph visu-
alisations. In Proceedings of Information Visualisation,
pages 592–597.
Bruls, M., Huizing, K., and van Wijk, J. J. (2000). Squar-
ified treemaps. In Proceedings of Joint Eurograph-
ics/IEEE TVCG Symposium on Visualization, pages 33–
42.
Burch, M. and Diehl, S. (2006). Trees in a Treemap: Vi-
sualizing multiple hierarchies. In Visualization and Data
Analysis, SPIE Press, 6060, pages 224–235.
Burch, M. and Diehl, S. (2008). TimeRadarTrees: Visual-
izing dynamic compound digraphs. Computer Graphics
Forum, 27(3):823–830.
Burch, M., Heinrich, J., Konevtsova, N., H
¨
oferlin, M., and
Weiskopf, D. (2011a). Evaluation of traditional, or-
thogonal, and radial tree diagrams by an eye tracking
study. IEEE Transactions on Visualization and Computer
Graphics, 17(12):2440–2448.
Burch, M., Raschke, M., Greis, M., and Weiskopf, D.
(2012). Enriching indented pixel tree plots with node-
oriented quantitative, categorical, relational, and time-
series data. In Proceedings of Diagrams, pages 102–116.
Burch, M., Raschke, M., and Weiskopf, D. (2010). Indented
Pixel Tree Plots. In Proceedings of the International
Symposium on Visual Computing, pages 338–349.
Burch, M., Vehlow, C., Beck, F., Diehl, S., and Weiskopf,
D. (2011b). Parallel edge splatting for scalable dynamic
graph visualization. IEEE Transactions on Visualization
and Computer Graphics, 17(12):2344–2353.
Card, S. K., Suh, B., Pendleton, B. A., Heer, B., and Bod-
nar, J. W. (2006). Time tree: Exploring time changing
hierarchies. In IEEE VAST, pages 3–10.
Diehl, S. and G
¨
org, C. (2002). Graphs, they are changing.
In Proceedings of Graph Drawing, pages 23–30.
Eades, P. (1992). Drawing free trees. Bulletin of the Institute
for Combinatorics and its Applications, 5(2):10–36.
Frishman, Y. and Tal, A. (2007). Online dynamic graph
drawing. In Proceedings of EuroVis, pages 75–82.
Graham, M. and Kennedy, J. B. (2010). A survey of
multiple tree visualisation. Information Visualization,
9(4):235–252.
Holten, D. and van Wijk, J. J. (2008). Visual comparison of
hierarchically organized data. Computer Graphics Fo-
rum, 27(3):759–766.
Inselberg, A. and Dimsdale, B. (1990). Parallel coordinates:
A tool for visualizing multi-dimensional geometry. In
IEEE Visualization, pages 361–378.
Johnson, B. and Shneiderman, B. (1991). Tree-Maps: A
space-filling approach to the visualization of hierarchical
information structures. In Proceedings of IEEE Visual-
ization Conference, pages 284–291.
Kruskal, J. and Landwehr, J. (1983). Icicle plots: Better
displays for hierarchical clustering. The American Statis-
tician, 37(2):162–168.
Ley, M. (2009). DBLP: Some lessons learned. Proceedings
of Very Large Data Bases, 2(2):1493–1500.
McGuffin, M. J. and Robert, J.-M. (2010). Quantifying the
space-efficiency of 2D graphical representations of trees.
Information Visualization, 9(2):115–140.
Misue, K., Eades, P., Lai, W., and Sugiyama, K. (1995).
Layout adjustment and the mental map. Journal of Visual
Languages and Computation, 6(2):183–210.
Munzner, T., Guimbretiere, F., Tasiran, S., Zhou, Y., and
Zhang, L. (2003). TreeJuxtaposer: Scalable tree com-
parison using focus+context with guaranteed visibility.
ACM Transactions on Graphics, 22:453–462.
Nocaj, A. and Brandes, U. (2012). Computing Voronoi
treemaps: Faster, simpler, and resolution-independent.
Computer Graphics Forum, 31(3):855–864.
Purchase, H. C. (1997). Which aesthetic has the greatest ef-
fect on human understanding? In Proceedings of Graph
Drawing, pages 248–261.
Reingold, E. M. and Tilford, J. S. (1981). Tidier drawings
of trees. IEEE Transactions on Software Engineering,
7(2):223–228.
Shneiderman, B. (1992). Tree visualization with tree-maps:
2-d space-filling approach. ACM Transactions on Graph-
ics, 11(1):92–99.
Shneiderman, B. (1996). The eyes have it: A task by data
type taxonomy for information visualizations. In IEEE
Symposium on Visual Languages, pages 336–343.
Telea, A. and Auber, D. (2008). Code Flows: Visualizing
structural evolution of source code. Computer Graphics
Forum, 27(3):831–838.
Tu, Y. and Shen, H.-W. (2007). Visualizing changes of hier-
archical data using treemaps. IEEE Transactions on Vi-
sualization and Computer Graphics, 13(6):1286–1293.
Tufte, E. R. (1983). The visual display of quantitative in-
formation. Cheshire, CO: Graphics Press, p. 197.
van Ham, F. (2003). Using multilevel call matrices in large
software projects. In INFOVIS, pages 227–232.
van Wijk, J. J. and van de Wetering, H. (1999). Cushion
treemaps: Visualization of hierarchical information. In
Proceedings of Information Visualization, pages 73–78.
IVAPP2014-InternationalConferenceonInformationVisualizationTheoryandApplications
98
